
Flexible Table Recognition and Semantic Interpretation System
Marcin Namysl
1,2 a
, Alexander M. Esser
3 b
, Sven Behnke
1,2 c
and Joachim K
¨
ohler
1
1
Fraunhofer IAIS, Sankt Augustin, Germany
2
Autonomous Intelligent Systems, University of Bonn, Germany
3
University of Cologne, Germany
Keywords:
Information Extraction, Table Recognition, Table Detection, Table Segmentation, Table Interpretation.
Abstract:
Table extraction is an important but still unsolved problem. In this paper, we introduce a flexible and modular
table extraction system. We develop two rule-based algorithms that perform the complete table recognition
process, including table detection and segmentation, and support the most frequent table formats. Moreover, to
incorporate the extraction of semantic information, we develop a graph-based table interpretation method. We
conduct extensive experiments on the challenging table recognition benchmarks ICDAR 2013 and ICDAR 2019,
achieving results competitive with state-of-the-art approaches. Our complete information extraction system
exhibited a high
F
1
score of 0.7380. To support future research on information extraction from documents,
we make the resources (ground-truth annotations, evaluation scripts, algorithm parameters) from our table
interpretation experiment publicly available.
1 INTRODUCTION
Information can hardly be presented in a more com-
pressed way than in a table. Humans can easily com-
prehend documents with tabular data. Although auto-
matic table extraction has been widely studied before
(§2), it has not yet been completely solved. Due to the
heterogeneity of document formats (
e. g.,
invoices, sci-
entific papers, or balance sheets), this task is extremely
hard. However, as the number of digitized documents
steadily increases, a solution is urgently needed to
automatically extract information from tabular data.
In this paper, we introduce a holistic approach that
combines table recognition and interpretation modules
(Figure 1). Specifically, we propose two rule-based
table recognition methods that perform table detection
and segmentation at once. Our book tabs heuristic
recognizes tables that are typeset with a L
A
T
E
X pack-
age booktabs
1
, which is widely used in scientific and
technical publications (§3.2). Our second algorithm
handles the most popular bordered table format (§3.1).
Furthermore, we complemented the basic formulation
of the table recognition task by including a table in-
a
https://orcid.org/0000-0001-7066-1726
b
https://orcid.org/0000-0002-5974-2637
c
https://orcid.org/0000-0002-5040-7525
1
https://ctan.org/pkg/booktabs
terpretation module. To this end, we implemented a
rule-based interpretation method that leverages reg-
ular expressions and an approximate (fuzzy) string
matching algorithm (§4).
Our approach is flexible, allowing both image-
based and digital-born documents, and modular, allow-
ing us to separately adapt single processing steps. Both
are crucial for a table extraction system because differ-
ent processing steps need to be optimized, depending
on the document type and the layout of the extremely
heterogeneous input data. For some documents, the
challenge might be the table detection, for others the
segmentation, or interpretation. High interpretability
of the system is essential. Deep learning-based end-to-
end approaches, which are trained to directly extract
specific values from documents, will only be suitable
for specific document types contained in the training
data. Our system, however, can easily be adjusted
to any document type and layout, due to its modular
structure.
Our contributions can be summarized as follows:
•
We propose two interpretable rule-based table
recognition methods developed to extract data
from widely-used tabular layouts (§3).
•
We provide a general formulation of the table inter-
pretation task as a maximum weighted matching
on a corresponding graph (§4).
Namysl, M., Esser, A., Behnke, S. and Köhler, J.
Flexible Table Recognition and Semantic Interpretation System.
DOI: 10.5220/0010767600003124
In Proceedings of the 17th International Joint Conference on Computer Vision, Imaging and Computer Graphics Theory and Applications (VISIGRAPP 2022) - Volume 4: VISAPP, pages
27-37
ISBN: 978-989-758-555-5; ISSN: 2184-4321
Copyright
c
2022 by SCITEPRESS – Science and Technology Publications, Lda. All rights reserved
27

Preprocessing
Table
Recognition
Table
Interpretation
Table Extraction
("SAHA activity towards HDAC6" : "20.7")
("Revenue 2020" : "30 500")
Figure 1: The diagram of our system. We focus on the table extraction task. Preprocessing involves binarization, skew angle
correction, layout analysis, and OCR. Table recognition includes table detection and segmentation. Table interpretation is
domain- and application-dependent. The result is a matching between the table cells and meanings.
•
We evaluate our table recognition algorithms on
challenging data sets demonstrating the utility of
our approach (§5, §6) and revealing issues of the
evaluation protocol employed in a recent competi-
tion on table recognition.
•
We perform the evaluation of the information ex-
traction task from tabular data and achieve a high
F
1
score of 0.7380 proving the utility of our ap-
proach. We make the resources from this experi-
ment publicly available.
2
2 RELATED WORK
In the following, we briefly summarize recent
3
ap-
proaches that perform complete table recognition. We
review both heuristic-based and learning-based meth-
ods.
2.1 Heuristic-based Methods
Hassan and Baumgartner (2007) described a system
that parses the low-level data from the PDF documents
and extracts the HTML representation of tables. They
locate and segment tables by analyzing the spatial
features of text blocks. Their system can detect cells
that span multiple rows or columns.
Ruffolo and Oro (2009) introduced PDF-TREX,
a heuristic bottom-up approach for table recognition
in single-column PDF documents. It uses the spatial
features of page elements to align and group them into
paragraphs and tables. Similarly, it finds the rows and
columns and obtains table cells from their intersec-
tions.
Nurminen (2013) proposed a set of heuristics for
table detection and segmentation. Specifically, they
locate subsequent text boxes with common left, middle,
or right coordinates and assign them the probability of
belonging to a table object.
2
https://github.com/mnamysl/table-interpretation
3
Please refer to Silva et al. (2005) for a comprehensive
review of prior approaches.
Rastan et al. (2015) proposed TEXUS, a task-based
table processing method. They located table lines and
used transitions between them and main text lines to
detect table positions. They used alignments of text
chunks inside the table region to identify columns
and determined the dominant table line pattern to find
rows.
Shigarov et al. (2018) proposed TabbyPDF, a
heuristic-based approach for table detection and struc-
ture recognition from untagged PDF documents. Their
system uses both textual and graphical features such
as horizontal and vertical distances, fonts, and rulings.
Moreover, they exploit the feature of the appearance of
text printing instructions and the positions of a drawing
cursor.
2.2 Learning-based Methods
Recently, many deep learning-based methods were pro-
posed to solve the image-based table recognition prob-
lem. To achieve acceptable results, these approaches
need many examples for training. Deep learning meth-
ods are often coupled with heuristics that implement
the missing functionality.
Schreiber et al. (2017) proposed DeepDeSRT that
employs the Faster R-CNN model for table detection
and a semantic segmentation approach for structure
recognition. As preprocessing, they stretch the images
vertically and horizontally to facilitate the separation
of rows and columns by the model. Moreover, they
apply postprocessing to fix problems with spurious
detections and conjoined regions.
Reza et al. (2019) applied conditional Generative
Adversarial Networks for table localization and an en-
coder decoder-based model for table row- and column
segmentation. Segmentation was evaluated separately
for rows and columns on proprietary data.
Paliwal et al. (2019) proposed TableNet, an encoder
decoder-based neural architecture for table recognition.
Their encoder is shared between the table region detec-
tion and column segmentation decoders. Subsequently,
rule-based row extraction is employed to segment in-
dividual cells.
VISAPP 2022 - 17th International Conference on Computer Vision Theory and Applications
28

Prasad et al. (2020) proposed CascadeTab-Net that
uses the instance segmentation technique to detect
tables and segment the cells in a single inference step.
Their model predicts the segmentation of cells only for
the borderless tables and employs simple rule-based
text and line detection heuristics for extracting cells
from bordered tables.
In contrast to prior work, our method is flexible.
It selects the required processing steps as needed and
works with both image-based and digital-born PDF
files.
2.3 Table Interpretation
Table interpretation is strongly use case-specific.
There is no state-of-the-art method that fits all sce-
narios, but a variety of approaches from the area of
natural language processing are used.
Popular methods involve string matching, calculat-
ing the Levenshtein distance (Levenshtein, 1966), or
Regular Expressions (RegEx) (Kleene, 1951),
e. g.,
for
matching a column title or the data type of a col-
umn (Yan and He, 2018). Other methods, like word
embeddings (Mikolov et al., 2013), entity recognition,
relation extraction, or semantic parsing, semantically
represent table contents. More complex solutions are
specifically trained for a certain use case,
e. g.,
a deep
learning approach to understand balance sheets.
2.3.1 Semantic Type Detection
The most related task to our use case is semantic type
detection. Semantic types describe the data by pro-
viding the correspondence between the columns and
the real-world concepts, such as locations, names, or
identification numbers.
A widely adopted method of detecting semantic
types is to employ dictionary lookup and RegEx match-
ing of column headers and values. Many popular data
preparation and visualization tools
4
incorporate this
technique to enhance their data analysis capabilities.
A deep learning-based approach that pairs column
headers with 78 semantic types from a knowledge
base was introduced recently (Hulsebos et al., 2019).
Moreover, Zhang et al. (2020) combined deep learning,
topic modeling, structured prediction, and the context
of a column for recognition.
In favor of flexibility, we utilized the RegEx and
soft string matching algorithms to detect semantic
types using the content of both header and data cells.
4
Popular data analysis systems: https://powerbi.
microsoft.com, https://www.trifacta.com, https://datastudio.
google.com.
3 PROPOSED TABLE
RECOGNITION METHOD
Figure 1 illustrates the information flow between the
modules of our system. Preprocessing enables us to
work with either born-digital PDF files or documents
scans. To our best knowledge, there are few table
recognition approaches that support both types of input.
Most approaches require born-digital PDFs.
More specifically, we employ a layout analysis
module (Konya, 2013) to extract solid separators (rul-
ing lines), textual, and non-textual page regions from
an input document. We then use our heuristics to ex-
tract both the location and the structure of each table.
Our methods can be easily applied to both horizon-
tal and vertical page layouts. In the following, we
describe how they work in the case of the horizontal
layout. For the vertical layout, all steps are identical,
except that we swap the horizontal and the vertical
separators with each other. Moreover, we discard all
candidates that overlap any valid table region that was
already detected by the previously applied heuristic.
Therefore, the order in which we apply our methods
impacts the final results. As the book tabs heuris-
tic could generate spurious candidates from bordered
tables, we first apply the separator-based method fol-
lowed by the book tabs algorithm in all experiments.
Although our table segmentation algorithms would
handle ruleless table layouts (cf. 3.2), in this work, we
are focused on information extraction from the tabular
layouts that contain at least partial rulings.
3.1 Separator-based Table Recognition
Our separator-based heuristic (Figure 2) starts by sort-
ing the horizontal and the vertical separators by the
top and the left position, respectively.
3.1.1 Separator Merging
First, all separator boxes are expanded by 5 pixels on
each side to increase the chance of intersection with
the neighboring ruling lines that have a different ori-
entation (vertical or horizontal). Then, we iteratively
merge all separator boxes if they intersect with each
other (Figure 2b). We repeat this process until no
further intersection can be found.
3.1.2 Table Labels Assignment
To improve precision, we search for the presence of
predefined keywords (
e. g.,
”table”, ”Tab.”) in the close
neighborhood of separator boxes and mark the table as
labeled or unlabeled. If the labels are required by the
Flexible Table Recognition and Semantic Interpretation System
29
(a) Input Image
(b) Separator Merging
(c) Cell Merging
(d) Segmentation Result
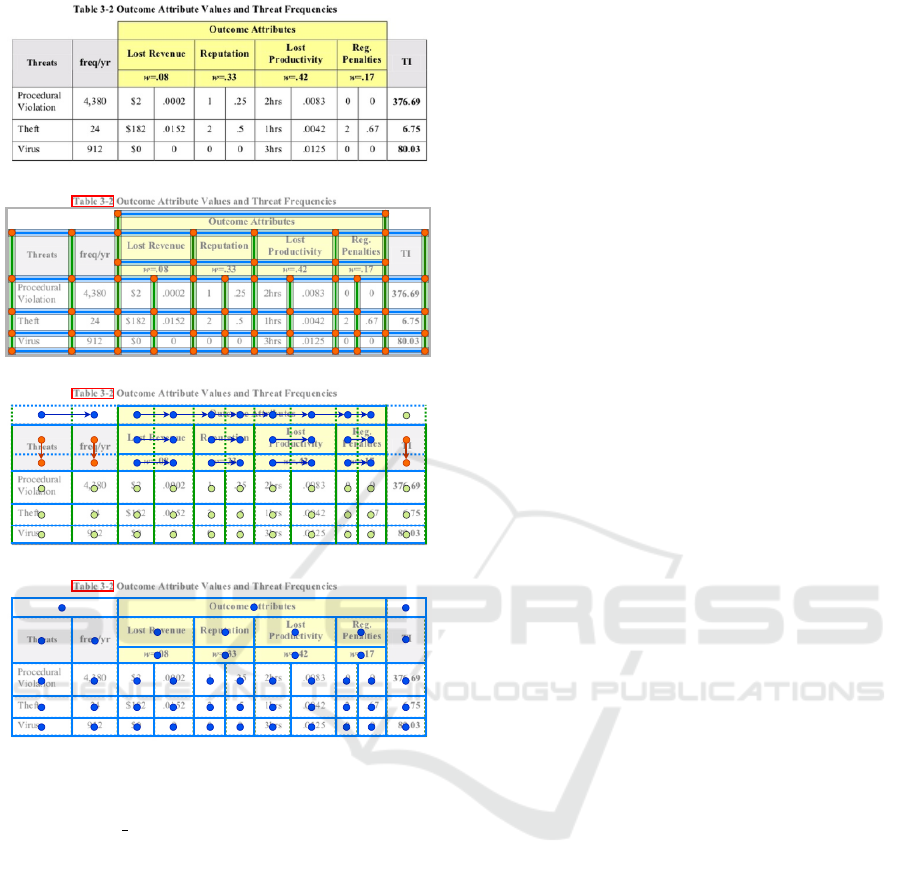
Figure 2: Illustration of the main processing steps of our
solid separator-based heuristic: (a) A table image cropped
from the cTDaR t10047 file (ICDAR 2019). (b) Separator
merging stage. Vertical and horizontal separator regions
are marked green and blue, respectively. Orange circles
correspond to the intersection points. The red box represents
the detected table label. (c) Cell merging stage. Blue and
orange circles correspond to the centers of the cells that
were merged horizontally and vertically, respectively. Green
circles represent the center of fully bordered cells. Arrows
mark the merging direction. (d) Segmentation result. Blue
circles represent the center of the recognized cells.
current configuration, we remove all unlabeled tables
from the set of already found candidates.
3.1.3 Table Grid Estimation
Subsequently, we derive a rough grid structure of each
table candidate. Each pair of subsequent vertical or
horizontal separators forms a table column or table
row region, respectively. We calculate the cell regions
based on intersections between the column and the
row boxes. This procedure returns a list of roughly
segmented table grids.
3.1.4 Table Grid Refinement
Some cells in the grid need to be refined by merging
them with the neighboring cells to recover the multi-
row and multi-column cells. Our approach is inspired
by the union-finding algorithm (Hoshen and Kopel-
man, 1976). We perform a raster scan through the
rough grid of cells. For each cell, scanning in the
left-to-right direction, we check whether the area near
the right border of the cell’s box overlaps any vertical
separator assigned to the current table candidate. If
this is not the case, we merge the current cell with its
right neighbor and proceed to the next cell. This pro-
cedure is then repeated in the top-to-down direction.
We illustrate this process in Figure 2c. Note that the
column spans of the cells that need to be merged must
be equal.
3.2 Book Tabs Table Recognition
The book tabs format consists of three main compo-
nents: a top, middle, and bottom rule (cf. examples in
Figure 3a and Figure 4a). The middle rule separates
the table header and the table body region. Option-
ally, a multi-level header structure can be represented
using shorter cmidrules. These inner rules span multi-
ple columns aggregated under the same higher-level
header. Our book tabs heuristic (Figure 3 and Figure 4)
uses horizontal separators for documents with standard
orientation.
3.2.1 Table Region Detection
First, the separators are sorted by the top position. We
search for triples of consecutive separators with similar
coordinates of their left and right sides. Moreover, we
perform a label assignment step as in §3.1.
3.2.2 Table Rows Detection
In the previous step, we also collect all inner separa-
tors (cmidrules) that are located between the top and
the middle rule. We group all inner separators by their
y position to isolate different levels of the header’s hier-
archy and to separate header rows. The row borders in
the body region of the table are determined using the
horizontal profile calculated by projecting all words
within the body region of a table candidate (Figure 3c).
The row borders are then estimated in the middle of
the gaps in the resulting profile.
VISAPP 2022 - 17th International Conference on Computer Vision Theory and Applications
30
(a) Input Image
(b) Segmentation Grid
(c) Row Segmentation
(d) Column Segmentation
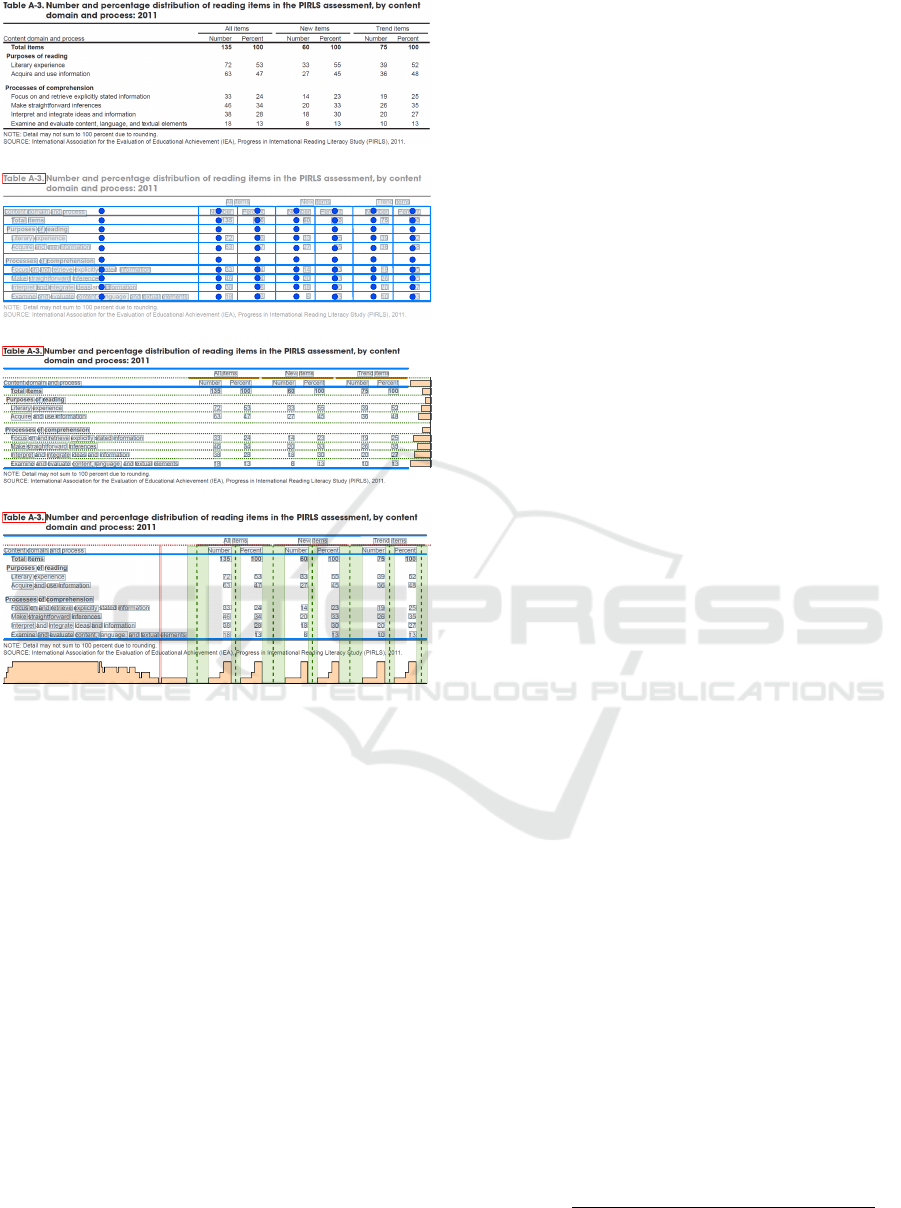
Figure 3: Illustration of the table body and lowest-level
header segmentation of our book tabs-based heuristic. (a)
A table image cropped from the us-021 file (ICDAR 2013).
(b) The resulting segmentation grid. Blue lines and circles
represent the borders and the centers of the cells, respectively.
The boxes with gray backgrounds outline the words within
the table area. (c) Row segmentation. Blue and orange
lines represent the top/middle/bottom and the cmidrule rule
lines, respectively. Orange bars to the right correspond to the
horizontal profile (running sum of pixels in the text regions
in each row). Green dotted lines correspond to the row
borders. (d) Column segmentation. The dotted red line
is a border of the lowest-level header. Orange bars at the
bottom correspond to the vertical profile (running sum of
pixels in the word regions in each column). We clip the
values in the profile for better visualization. The column
gaps that are wider/narrower than
D
column
are highlighted in
green/red, respectively. Green vertical dotted lines represent
the detected column borders.
3.2.3 Table Columns Detection
We determine the median unit distance
D
page
(the dis-
tance divided by the word height) between two words
within a page. Assuming that the table font is constant,
we also calculate the mean word height within the
table
H
table
. For each table candidate, we determine the
threshold used to locate gaps between two consecutive
table columns using
D
column
= D
page
H
table
γ
, where
γ
is a hyperparameter. We project all page regions within
the body region and the lowest-level header row (Fig-
ure 3d). The higher-level headers are excluded, as they
contain multi-column cells. We analyze the projection
to find all intervals with a length above
D
column
. The
center positions of these intervals form the column
borders. All gaps with length below
D
column
corre-
spond to vertically aligned words that form spurious
columns.
3.2.4 Table Grid Estimation and Refinement
We compute the grid of the cell boxes from the in-
tersections between the row and the column borders
(Figure 3b). To recognize the complex header hierar-
chy, we merge all roughly detected cells that intersect
the same inner separator segment (Figure 4b).
4 PROPOSED TABLE
INTERPRETATION METHOD
Our algorithm takes a recognized table as input and
assigns meanings
m ∈ M
to the columns
c ∈ C
(Fig-
ure 5c). For each
m
, we define a customized set of
affinity rules describing a column that is likely to be
matched with m (Figure 5b):
(1)
Title Keyword Score: Fuzzy matching between the
title of a column and the predefined keywords.
(2)
Title RegEx Score: Exact matching of the title of a
column with a customized regular expression.
(3)
Data Type Score: Exact matching of the content of
the cells in a column with regular expressions for
predefined types (e.g., integer, date, etc.).
(4)
Content RegEx Score: Exact matching of the con-
tent of the cells in a column with a customized
regular expression.
Fuzzy matching corresponds to the Levenshtein (Lev-
enshtein, 1966) distance between two strings divided
by the length of the longer string. The RegEx scores
return
1.0
if the matching succeeded and
0.0
otherwise.
Moreover, the content and data type scores are aver-
aged over the scores for the cells in the corresponding
column. The final affinity score
S
for a column
c
with
a meaning
m
is computed as presented in Equation (1):
S(c, m) =
w
c
max(S
Rx
c
, S
DT
c
) + w
t
max(S
Rx
t
, S
KW
t
)
w
c
+ w
t
,
(1)
Flexible Table Recognition and Semantic Interpretation System
31
(a) Input Image
(b) Header Cell Merging
(c) Final Header Segmentation
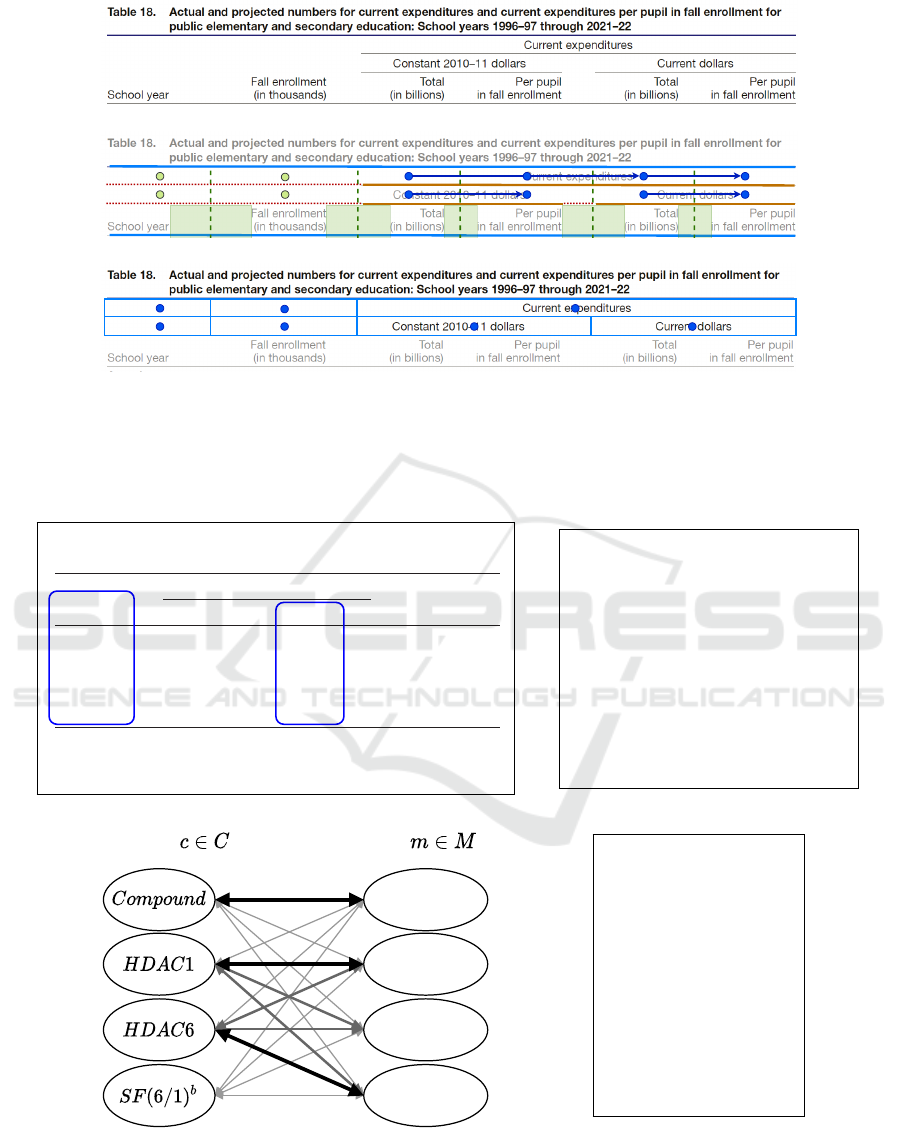
Figure 4: Illustration of the higher-level header segmentation of our book tabs-based heuristic. (a) The top part of a table from
the us-018 file (ICDAR 2013). (b) Header cell merging. Orange lines represent the cmidrule lines. Green areas and lines
correspond to column white spaces and borders, respectively. Blue circles are the centers of the cells that intersect the same
cmidrule line and thus need to be merged. The cells marked with green circles remain unchanged. (c) Header segmentation.
Blue lines and circles correspond to the borders and the centers of the cells in the final grid, respectively.
www.biosciencetrends.com
BioScience Trends. 2019; 13(2):197-203.
201
7 (breast cancer), and HL-60 (leukemia). Treatment
with our two compounds as well as the positive
control SAHA and ACY1215 for 72 h resulted in
dose-dependent growth inhibition of all four cancer
cell lines (Table 2). Contrast to the strong enzyme
inhibitory activity, our two compounds MH1-18 and
MH1-21 showed moderate activity in suppressing
the cell proliferation, with IC
50
values more than 40
μM for the four cancer lines. This result is consistent
with the low antiproliferative activity of many known
selective HDAC6 inhibitors (20,30). For example, in
our previous work, we designed and synthesized three
novel HDAC6 inhibitors LYP-2, -3, and -6 with the
4-aminopiperidine-1-carboxamide as the core structure
which showed moderate efficacy in suppressing the
proliferation of cancer cells (20). In another study,
HDAC6 selective inhibitor 4-hydroxybenzoic acid
failed to induce significant cell death in MCF-7 cells
at concentrations below 20 μM (30). On the other
hand, the relatively low antiproliferation activity of
MH1-18 and MH1-21 may possibly be attributed to
their high polarity, as the calculated LogP (cLogP)
values of MH1-18 and MH1-21 were -1.03 and 0.40
(by ChemDraw 14.0), respectively. While the cLogP
values of ACY1215 and SAHA were 3.38 and 0.989.
The permeability across the cell membrane of our
compounds might be further improved.
3.5. Compound MH1-21 suppressed the migratory
capability of MCF-7 tumor cells
As reported, HDAC6 plays a significant role in
migration of tumor cells (31), in this work, we tested
the anti-migration activity of compound MH1-21 which
displayed best inhibitory activity toward HDAC6 with
good selective index. To investigate the anti-migration
effect of MH1-21, an in vitro wound healing assay was
performed using MCF-7 cells. Results were showed
in Figure 2, which indicated that treatment with three
concentrations of MH1-21 (12.5, 25 and 50 μM) all
remarkably reduced the migratory capability of MCF-
7 cells compared to that of the blank control group at
12, 24, 36 and 48 h after wound creation. This result
suggested that compound MH1-21 possessing potent
Figure 2. MH1-21 suppressed migration of MCF-7 cells.
The effect of MH1-21 on MCF-7 tumor cell migration was
determined using a wound healing assay. The cells were
exposed to 12.5, 25, or 50 μM of MH1-21 for 12, 24, 36, and
48 h, respectively, and the wound areas were measured at each
time point. *p < 0.05, **p < 0.01, ***p < 0.001 vs. control.
Figure 1. The inhibition rates of all 21 compounds against
HDACs at 1 μM concentration.
Table 1. Inhibitory activity of four representative
compounds toward HDAC1 and 6
Compound
MH1-18
MH1-21
SAHA
ACY1215
HDAC6
11.5
8.6
20.7
8.0
HDAC1
119.2
105.6
43.2
73.0
a
The IC
50
values are the means of three experiments.
b
SF(6/1):
selectivity factor for HDAC6 over HDAC1. SF(6/1) = IC
50
(HDAC1)/
IC
50
(HDAC6).
SF(6/1)
b
10.4
12.3
2.1
9.1
IC
50
a
, nM
Table 2. Antiproliferative eects on four tumor cell lines
Compound
MH1-18
MH1-21
ACY1215
SAHA
NCI-H226
N.D.
119.3
7.44
5.41
SGC-7901
N.D.
166.3
10.2
5.8
a
IC
50
values are the mean of at least three experiments. N.D., not
determined.
IC
50
a
, nM
HL-60
57.7
43.8
6.73
3.87
MCF-7
N.D.
226.4
6.31
7.10
(a) Input Table
[
{ "id": "compound",
"keywords": ["compound", "compd"],
"titleRegex": "",
"datatype": "string",
"weightTitle": 0.9,
"weightContent": 0.1,
"minAffinityScore": 0.5
},
{ "id": "hdac6_gene",
"keywords": ["HDAC6"],
"titleRegex": "ˆHDAC[-]{0,1}6[ˆ\\d].*$",
"datatype": ["double", "range", "integer"],
"weightTitle": 0.7,
"weightContent": 0.3,
"minAffinityScore": 0.85
}
]
(b) Configuration File
Columns
HDAC3 GENE
HDAC6 GENE
Meanings
COMPOUND
HDAC1 GENE
(c) Interpretation Graph
[
{ "compound": "MH1-18",
"hdac6_gene": "11.5"
},
{ "compound": "MH1-21",
"hdac6_gene": "8.6"
},
{ "compound": "SAHA",
"hdac6_gene": "20.7"
},
{ "compound": "ACY1215",
"hdac6_gene": "8.0"
}
]
(d) Extracted Tuples
Figure 5: Illustration of our table interpretation method: (a) A table extracted from Miao et al. (2019). The columns
corresponding to the defined meanings are marked with blue boxes. (b) A JSON file defining the meanings COMPOUND and
HDAC6 GENE, and rules for matching columns to these meanings. (c) Table interpretation graph: Columns
c ∈ C
are mapped
to the meanings
m ∈ M
. For each mapping, an affinity value is calculated, symbolized by the thickness of the arrows. (d) The
extracted tuples that represent the inhibitory activity of each compound towards the HDAC6 gene.
VISAPP 2022 - 17th International Conference on Computer Vision Theory and Applications
32

where
w
t
and
w
c
are the weights of the title and the
content property groups, respectively.
S
Rx
c
and
S
DT
c
are the affinity scores of the content RegEx and the
data type, respectively.
S
Rx
t
and
S
KW
t
correspond to the
scores of the title RegEx and the fuzzy matching with
the keywords, respectively. The sum of weights must
be a positive number. Moreover, if a particular rule is
not defined for a meaning, the corresponding score is
set to zero.
To perform the matching between the meanings
and the columns in a table, we create a weighted bipar-
tite graph with two sets of vertices: the meanings on
one side and the columns on the other side (Figure 5c).
We first link all columns with all meanings with an
edge weighted by the affinity scores that specify how
likely a column matches with a certain meaning. We
prune the connections that do not reach a predefined re-
quired minimum affinity value. Subsequently, we find
the best assignment using maximum weighted match-
ing (Edmonds, 1965) on the bipartite graph. Finally,
we extract the tuples
x
i, j
, where
i
is an index of a row
in the body part of the table, and
j
is the index of a
matched meaning (cf. Figure 5d).
5 TABLE RECOGNITION
EXPERIMENTS
5.1 Data Sets
The ICDAR 2013 Table Competition data set (G
¨
obel
et al., 2013) contains born-digital business and govern-
ment PDF documents with 156 tables. Ground-truth
annotations for both table detection and segmentation
tasks are available. As many tables in this data set are
compatible with our heuristics, we refer to the experi-
ment on this data set as the in-domain evaluation.
The ICDAR 2019 Table Detection and Recognition
data set (cTDaR; Gao et al. (2019)) is a collection
of modern and archival document images. We used
only the former part, as the latter consists of handwrit-
ten documents and the analysis of hand-drawn tables
is outside the scope of this work. We evaluated the
complete recognition process (track B2), as it is the
most challenging task. As this data set contains vari-
ous tabular layouts, we regard this experiment as an
out-of-domain evaluation.
5.2 Hyperparameters
For ICDAR 2013, the table labels were required by the
book tabs heuristic. For ICDAR 2019, we fed images
to the layout analysis component, and turn off the re-
quirement of table label presence for both heuristics.
We set
γ = 2.0
in all experiments. We tuned the above
hyperparameters on two held-out sets: The practice
data released in the ICDAR 2013 competition (no in-
tersection with the evaluation test set) that consists of
58
PDF documents and
16
images randomly sampled
from the track A data set (table detection, not evaluated
in this paper) of the ICDAR 2019 competition.
5.3 ICDAR 2013 Results (In-domain
Evaluation)
We first validated our approach on a popular table
recognition benchmark from the ICDAR 2013 Table
Competition
5
. We matched the ground-truth and the
recognized tables at the Intersection over Union (IoU)
threshold of 0.5 (
IoU
min
). IoU is defined as the ra-
tio between the area of the overlap and the union of
two bounding boxes. If two tables were matched at
IoU ≥ IoU
min
, their lists of adjacency relations, i.e.,
relations between the neighboring cells in a table, were
compared by using precision and recall measures (cf.
G
¨
obel et al. (2013)). All ground-truth tables that did
not match with any recognized table at IoU ≥ IoU
min
were classified as not detected and their adjacency re-
lations were counted as false-negative relations. Con-
sequently, all adjacency relations from the recognized
tables that did not match with any ground-truth table
at
IoU ≥ IoU
min
were counted as false-positive rela-
tions. We included all false-positive and false-negative
relations in the reported complete recognition scores
(precision, recall, and F
1
).
In Table 1, we present the results of our method
in the complete recognition task. For comparison, we
present the best previously published results on this
data set
6
. We outperform the other methods in terms
of precision. Moreover, we achieve the F
1
score on
par with the best academic methods.
5.4 ICDAR 2019 Results
(Out-of-Domain Evaluation)
We tested our approach on the cTDaR data set of docu-
ment scans with various layouts, employing the official
tools and metrics for evaluation
7
.
Table 2 presents our results in comparison with the
best-reported scores. Note that only two participant
5
http://www.tamirhassan.com/html/competition.html
6
We only included the prior work that reported the results
of the complete recognition process. Moreover, we excluded
methods that used a subset of the data for evaluation.
7
https://github.com/cndplab-founder/ICDAR2019
cTDaR
Flexible Table Recognition and Semantic Interpretation System
33

Table 1: ICDAR 2013 evaluation. We report the precision, recall, and F
1
score (per-document averages) for the complete
recognition process.
Method Precision Recall F
1
FineReader (G
¨
obel et al., 2013) 0.8710 0.8835 0.8772
OmniPage (G
¨
obel et al., 2013) 0.8460 0.8380 0.8420
Nurminen (G
¨
obel et al., 2013) 0.8693 0.8078 0.8374
Ours 0.9179 0.7616 0.8325
TabbyPDF (Shigarov et al., 2018)
0.8339 0.8298 0.8318
TEXUS (Rastan et al., 2015) 0.8071 0.7823 0.7945
Table 2: ICDAR 2019 evaluation. We report the precision, recall, and F
1
score for the complete table recognition process for
track B2 (modern documents) for two reference values of the IoU threshold between the ground-truth and the recognized cells.
For comparison, we include the best results reported in previous works. WAvg.F
1
denotes the average F
1
score weighted by the
IoU threshold for IoU ∈ {0.6, 0.7, 0.8, 0.9}.
Method
IoU = 0.6 IoU = 0.7
WAvg. F
1
Precision Recall Precision Recall
CascadeTabNet (Prasad et al., 2020) - - - - 0.23
NLPR-PAL (Gao et al., 2019) 0.32 0.42 0.27 0.35 0.20
Ours 0.45 0.16 0.41 0.14 0.16
HCL IDORAN (Gao et al., 2019) 1E-3 1E-3 1E-3 7E-4 3E-4
methods were registered for the structure recognition
track in this competition, which emphasizes the dif-
ficulty of this task. Our approach was outperformed
by the deep learning-based methods that reported the
state-of-the-art results in terms of the weighted average
F
1
score (WAvg.F
1
).
Nevertheless, we argue that this score is not ade-
quate to compare table recognition systems. In Fig-
ure 6, we report the detailed results of our method
with different IoU thresholds for the cell matching
procedure. The WAvg.F
1
measure proposed in this
competition is biased towards high overlap-ratios be-
tween cells and strongly penalizes lower IoU scores,
although such scores are not necessarily needed to re-
liably recognize the content of the cells, which is the
ultimate goal of information extraction from tabular
data. Note that our method achieved results better than
the best WAvg.F
1
score for all IoU thresholds less than
or equal to 0.7. Moreover, our approach exhibits high
precision, outperforming the state-of-the-art results.
The lower recall scores result from the large variety of
table layouts present in this data set.
5.5 Discussion and Limitations
Besides many advantages, we also noticed some limi-
tations in our approach. First, it is prone to the errors
propagated from the upstream components of our sys-
tem that may cause missing or spurious separators.
Moreover, heuristic-based methods generally exhibit
lower recall, as the hand-crafted rules need to be de-
signed for each supported layout. Heuristic methods
are, however, more interpretable and can be extended
to other scenarios. Furthermore, our system is not
fully parameter-free. Due to the great heterogeneity of
documents, the parameters have to be adapted to differ-
ent layouts. However, in contrast to the deep learning
methods, this adaptation requires comparatively less
training data.
6 TABLE INTERPRETATION
EXPERIMENT
6.1 Evaluation Data Set
For table interpretation, we were not able to find any
common, publicly available benchmark, neither for
general data nor for our use case. Therefore, we anno-
tated 13 documents with tables from our biomedical
data collection. We selected documents containing
tables presenting the inhibitory activity of different
compounds toward the HDAC
9
gene.
The ground-truth data for a table consists of a list
of tuples, each representing an intersection of a data
row and the columns that correspond to the defined
8
https://github.com/tesseract-ocr/tesseract
9
Histone deacetylase: https://en.wikipedia.org/wiki/
Histone deacetylase. Specifically, we focused on the HDAC1
and HDAC6 target genes.
VISAPP 2022 - 17th International Conference on Computer Vision Theory and Applications
34
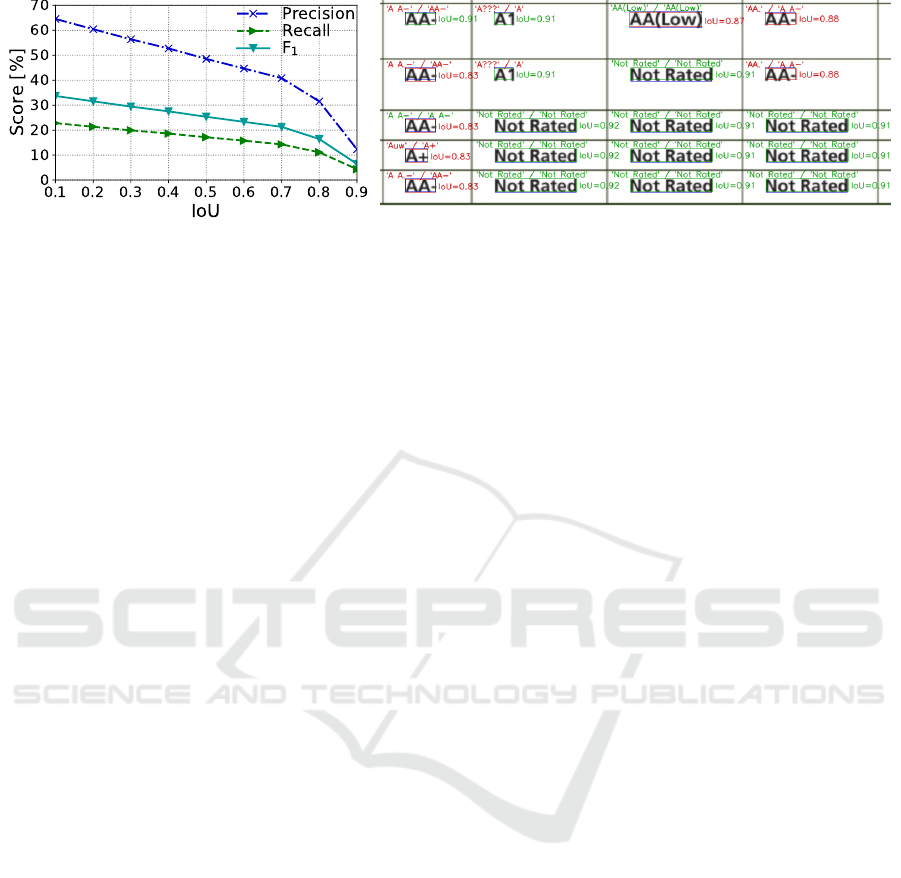
Figure 6: Extended ICDAR 2019 data set results for our method. Left: IoU-F
1
, IoU-Precision, and IoU-Recall curves for the
complete recognition process. Right: An excerpt from the cTDaR10001 document. Blue boxes correspond to the ground-truth
regions. Green and red boxes are the regions recognized above and below the IoU
= 0.9
threshold, respectively. Above the
boxes, we marked the text recognized by the Tesseract 4 OCR engine
8
depicted in the ground-truth and recognized regions
(green text indicates identical results). The results for regions produced by our method are better, although several matches
were rejected at IoU= 0.9, which lowered our WAvg.F
1
score.
meanings. The annotations are stored in JSON files
(cf. Figure 5d) with the following name pattern:
<FILE_ID>_<PAGE_NR>_<TABLE_IDX>.json
where
<FILE_ID>
is the file identifier,
<PAGE_NR>
is
the page number in the corresponding PDF file, and
<TABLE_IDX> is the index of a table on a page.
We manually annotated 113 tuples from 17 tables
and used them as ground-truth data in our experiment.
We present an example of a ground-truth file in Fig-
ure 9 in the appendix. Moreover, we selected a sepa-
rate development set of four documents for fine-tuning.
6.2 Evaluation Setup
Note that not every table in a document contains infor-
mation germane to our scenario. Even if it is the case,
not every column has to contain relevant information.
Therefore, we carefully designed the rules employed
by our method (§4) using the development data. To
this end, we employed the fuzzy and RegEx string
matching algorithms. In Figure 8, we present the exact
set of rules that we developed.
To evaluate our table extraction method, we first
recognized all tables in the evaluation data set using
our table recognition algorithms (§3). We used the
same hyper-parameters as in the ICDAR 2013 exper-
iment (§5.2). We then employed our interpretation
method to extract the relevant tuples from the recog-
nized tables. To facilitate evaluation, the extracted
tuples for each table are stored in a separate JSON file
(§5d). Moreover, we use the same file name pattern as
in the case of the ground-truth files.
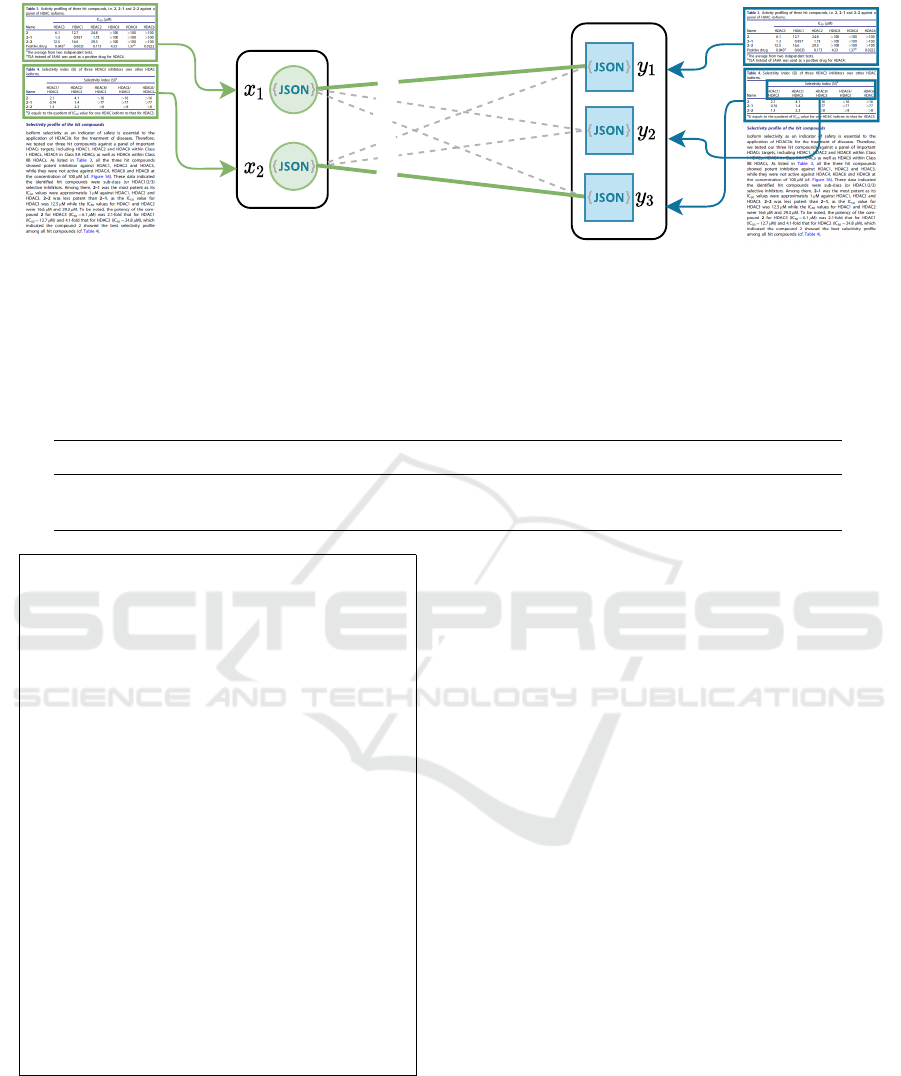
The evaluation script takes two sets of JSON files
that correspond to the ground-truth and the recognized
tables, respectively, as input. For every page, we cre-
ated a bipartite graph with two sets of nodes corre-
sponding to the ground-truth and the recognized tables,
respectively (Figure 7). Subsequently, we performed
maximum weighted matching (Edmonds, 1965) to find
the correspondence between these two sets of tables.
Finally, we gathered the results from all pages and
calculated the exact precision, recall, and F
1
score.
Note that all tuples from the missed reference tables
and incorrectly extracted relations were also included
in these results. It is worth noting that these scores
reflect the cumulative performance of the complete
table extraction process.
6.3 Evaluation Results and Discussion
Table 3 presents the results of our method. We ex-
tracted 74 tuples from 10 out of 28 tables. We
achieved a solid complete table extraction F
1
score of
0.7380
. Moreover, when we excluded the results from
the missed reference tables, our table interpretation
method exhibited a high F
1
score of
0.9388
, proving
its utility. Furthermore, the quantitative analysis re-
vealed that only one false-positive and false-negative
error was directly related to the designed interpreta-
tion rules. The remaining errors resulted from table
segmentation issues like incorrectly merged cells.
7 CONCLUSIONS
In this paper, we presented our flexible and modular
table extraction system. To infer the exact structure
of tables in unstructured documents, we developed
two heuristics that work with both born-digital and
image-based inputs (§3). For semantic information
extraction, we introduced a configurable graph-based
table interpretation method (§4).
We conducted extensive experiments on challeng-
ing table recognition benchmarks and achieved results
that are competitive with state-of-the-art methods (§5).
Flexible Table Recognition and Semantic Interpretation System
35
0.8
0.3
0.1
0.2
0.3
0.9
Figure 7: A weighted bipartite interpretation graph with two ground-truth and three recognized tables (green circles and blue
squares, respectively). Each vertex corresponds to a set of tuples extracted from a table. We store each set in a separate JSON
file. The edge weights are the
F
1
scores of the matching between the corresponding sets of tuples. Green solid lines mark the
matching with the maximum sum of weights. The y
2
vertex corresponds to a false-positive result.
Table 3: Results of information extraction from tabular data. We include the scores obtained both through the end-to-end table
extraction process (Ours: end-to-end) and solely from the correctly recognized tables (Ours: interpretation-only). We report
the precision, recall, and F
1
score. TP, FP, and FN refer to the number of tuples that were perfectly matched (true-positive),
missed (false-negative), or incorrectly recognized (false-positive), respectively.
Method TP FP FN Precision Recall F
1
Ours: end-to-end 69 4 45 0.9452 0.6053 0.7380
Ours: interpretation-only 69 4 5 0.9452 0.9324 0.9388
[
{ "id": "compound",
"keywords": ["Compound", "compd", "Comp.", "cpd"],
"titleRegex": "",
"datatype": "string",
"weightTitle": 1.0,
"weightContent": 0.0,
"minAffinityScore": 0.5
},
{ "id": "hdac6_ic50",
"keywords": ["HDAC6"],
"titleRegex": "ˆHDAC[-]{0,1}6[ˆ\\d].*$",
"datatype": ["double", "range", "integer"],
"weightTitle": 1.0,
"weightContent": 0.0,
"minAffinityScore": 0.85
},
{ "id": "hdac1_ic50",
"keywords": ["HDAC1"],
"titleRegex": "ˆHDAC[-]{0,1}1[ˆ\\d].*$",
"datatype": ["double", "range", "integer"],
"weightTitle": 1.0,
"weightContent": 0.0,
"minAffinityScore": 0.85
}
]
Figure 8: A JSON file defining the meanings and rules for
matching columns to these meanings used in our table inter-
pretation experiment.
In particular, we outperformed other approaches in
terms of precision in all evaluation scenarios.
Finally, we evaluated the accuracy of the complete
information extraction process and confirmed the util-
ity of our holistic approach (§6). To foster future re-
search on information extraction from tabular data, we
made the evaluation scripts, ground-truth annotations,
hyper-parameters, and results of our method publicly
available.
We expect that a system combining deep learning-
based detection and heuristic-based segmentation
would further improve the accuracy of complete table
recognition. Therefore, in future work, we integrate a
deep learning-based detection module to decrease the
precision-recall gap in our results.
Our method has been evaluated on common bench-
marks but is not limited to these use cases. Our system
is (1) flexible, allowing both image-based and digi-
tal-born documents, (2) hybrid, combining heuristics
for different layouts, (3) modular, covering all pro-
cessing steps, and allowing to separately adapt the
interpretation module to specific scenarios. Perspec-
tively, we intend to process various documents, such
as invoices or balance sheets.
ACKNOWLEDGMENTS
This work was supported by the Fraunhofer Internal
Programs under Grant No. 836 885.
VISAPP 2022 - 17th International Conference on Computer Vision Theory and Applications
36

REFERENCES
Edmonds, J. (1965). Maximum matching and a polyhe-
dron with
0, 1
vertices. J. of Res. the Nat. Bureau of
Standards, 69 B:125–130.
Gao, L., Huang, Y., D
´
ejean, H., Meunier, J.-L., Yan, Q.,
Fang, Y., Kleber, F., and Lang, E. (2019). ICDAR
2019 competition on table detection and recognition
(cTDaR). In Int. Conf. Document Analysis and Recog-
nition (ICDAR), pages 1510–1515.
G
¨
obel, M., Hassan, T., Oro, E., and Orsi, G. (2013). IC-
DAR 2013 table competition. In Int. Conf. Document
Analysis and Recognition (ICDAR), pages 1449–1453.
Hassan, T. and Baumgartner, R. (2007). Table recognition
and understanding from PDF files. In Int. Conf. Doc-
ument Analysis and Recognition (ICDAR), volume 2,
pages 1143–1147.
Hoshen, J. and Kopelman, R. (1976). Percolation and cluster
distribution. I. cluster multiple labeling technique and
critical concentration algorithm. Phys. Rev. B, 14:3438–
3445.
Hulsebos, M., Hu, K., Bakker, M., Zgraggen, E., Satya-
narayan, A., Kraska, T., Demiralp, c., and Hidalgo, C.
(2019). Sherlock: A deep learning approach to seman-
tic data type detection. In ACM SIGKDD Int. Conf.
Knowledge Discovery and Data Mining (KDD), page
1500–1508.
Kleene, S. C. (1951). Representation of events in nerve nets
and finite automata. Technical report, Rand Project Air
Force Santa Monica, CA.
Konya, I. V. (2013). Adaptive Methods for Robust Document
Image Understanding. PhD thesis, University of Bonn,
Germany.
Levenshtein, V. (1966). Binary codes capable of correct-
ing deletions, insertions and reversals. Soviet Physics
Doklady, 10:707.
Miao, H., Gao, J., Mou, Z., Wang, B., Zhang, L., Su, L., Han,
Y., and Luan, Y. (2019). Design, synthesis and biologi-
cal evaluation of 4-piperidin-4-yl-triazole derivatives
as novel histone deacetylase inhibitors. BioScience
Trends, 13(2):197–203.
Mikolov, T., Chen, K., Corrado, G., and Dean, J. (2013).
Efficient estimation of word representations in vector
space. preprint arXiv:1301.3781.
Nurminen, A. (2013). Algorithmic extraction of data in
tables in PDF documents. Master’s thesis, Tampere
University of Technology.
Paliwal, S. S., D, V., Rahul, R., Sharma, M., and Vig, L.
(2019). TableNet: Deep learning model for end-to-
end table detection and tabular data extraction from
scanned document images. In Int. Conf. Document
Analysis and Recognition (ICDAR), pages 128–133.
Prasad, D., Gadpal, A., Kapadni, K., Visave, M., and Sul-
tanpure, K. (2020). CascadeTabNet: An approach for
end to end table detection and structure recognition
from image-based documents. In IEEE/CVF Conf.
Computer Vision and Pattern Recognition Workshops
(CVPRW), pages 2439–2447.
Rastan, R., Paik, H.-Y., and Shepherd, J. (2015). TEXUS:
A task-based approach for table extraction and under-
standing. In ACM Symp. Document Engineering (Do-
cEng), page 25–34.
Reza, M. M., Bukhari, S. S., Jenckel, M., and Dengel, A.
(2019). Table localization and segmentation using
GAN and CNN. In Int. Conf. Document Analysis and
Recognition Workshops (ICDARW), volume 5, pages
152–157.
Ruffolo, M. and Oro, E. (2009). PDF-TREX: An approach
for recognizing and extracting tables from PDF docu-
ments. In Int. Conf. Document Analysis and Recogni-
tion (ICDAR).
Schreiber, S., Agne, S., Wolf, I., Dengel, A., and Ahmed,
S. (2017). DeepDeSRT: Deep learning for detection
and structure recognition of tables in document im-
ages. In Int. Conf. Document Analysis and Recognition
(ICDAR), pages 1162–1167.
Shigarov, A., Altaev, A., Mikhailov, A., Paramonov, V., and
Cherkashin, E. (2018). TabbyPDF: Web-based system
for PDF table extraction. In Information and Software
Technologies, pages 257–269. Springer.
Silva, A. C. E., Jorge, A., and Torgo, L. (2005). Design of an
end-to-end method to extract information from tables.
Int. J. of Document Analysis and Recognition (IJDAR),
8:144–171.
Yan, C. and He, Y. (2018). Synthesizing type-detection logic
for rich semantic data types using open-source code.
In Int. Conf. Management of Data (SIGMOD), page
35–50.
Zhang, D., Suhara, Y., Li, J., Hulsebos, M.,
C¸
a
˘
gatay Demi-
ralp, and Tan, W.-C. (2020). Sato: Contextual semantic
type detection in tables. preprint arXiv:1911.06311.
APPENDIX
In this section, we present an example of a ground-
truth file from our data set (Figure 9) that we used to
evaluate table interpretation (cf. §6).
[
{
"compound": "9b (IC50;nM)",
"hdac1_ic50": "84.9 \u00b1 25.1",
"hdac6_ic50": "95.9 \u00b1 0.78"
},
{
"compound": "SAHA (IC50;nM)",
"hdac1_ic50": "102.7 \u00b1 5.9",
"hdac6_ic50": "198.5 \u00b1 103.0"
}
]
Figure 9: An example of a ground-truth file from our
collection used in our table interpretation experiment
(11 page07 table0.json).
Flexible Table Recognition and Semantic Interpretation System
37
