
Bioinformatics Analysis of Gene Targets for Birt-Hogg-Dube
Syndrome Associated with Renal Cell Cancer using NetworkAnalyst
Mariemme Keilsy D. Martos and Marineil C. Gomez
School of Chemical, Biological, Material Engineering and Sciences, Mapua University,
Muralla St. Intramuros, Manila 1002, Philippines
Keywords: Renal Cell Cancer, Chromophobe Renal Cell Cancer Birt-Hogg-Dube Syndrome.
Abstract: CrRCC (chromophobe renal cell cancer) belongs to the group of non-clear cell cancer which accounts 4%-
5% of RCC. Birt-Hogg-Dube Syndrome (BHDS), a subtype for crRCC, occurs due to the germline mutation
of Folliculin (FLCN). Each disease has designated treatment and contrasting prognosis, but the histological
features of this syndrome may overlap with the other subtypes of RCC which makes it difficult to differentiate
and it has a limited amount of information available due to its uncommonness. This study aims to differentiate
the pathway and genes involved in BHDS disease through NetworkAnalyst. The dataset was gathered from
ArrayExpress and generated 395 significant DEGs in BHDS, which was then used to produce a pathway
enrichment network and protein-protein interaction (PPI). Cytoskeletal protein binding correlating with hub
genes KIT, RHOB, and UBC in BHDS indicates that this disease has a high risk for cell metastasis. This study
gives a new promising therapeutic target for the said disease.
1 INTRODUCTION
Every year, there are approximately 338,000 new
renal cell carcinoma releases in the world and about
30% of new renal cell carcinoma patients have
metastases at the time of diagnosis (Li et al., 2021).
Renal cell carcinoma (RCC) is a frequently diagnosed
cancer with high prevalence (Y. Y. Chen et al., 2020).
It is a heterogeneous tumor that derives from
epithelial cells of the renal tubular, which represents
a comprehensive 80% of all main RCC kidney tumors
(Singh, 2021). Obesity, hypertension, and cigarette
smoking are well-known risk factor for RCC although
their impact may be different depending on the
population. Renal cell carcinoma is more prone to
male gender than females and a high incidence is
generally seen from the sixth to eight decades of its
existence that proves gender, race, and age affects the
occurrence of RCC (Thompson et al., 2008). Genes
that are typically involved in renal cell carcinomas
such as VHL, MET, FLCN, SDH, TSC1, and TSC2
have an important role regarding with regulation of
cellular metabolic processes which suggest a
dysregulation of metabolic pathways involved in
oxygen, energy, and/or nutrient sensing as a key
feature of RCC carcinogenesis (Linehan, Srinivasan,
& Schmidt, 2010).
RCC has many histological subtypes with
different molecular drivers in which clear cell RCC is
the most prevalent subtype, approximately for about
75%. The remaining subtypes include papillary renal
cell cancer (pRCC), chromophobe renal cancer
(crRCC), MiT family translocation, and other rare
types (F. Chen et al., 2016). Most genomic alterations
in RCC were well defined until the World Health
Organization (WHO) in 2016 discovered
classifications of tumors included subtypes which
include Hereditary Leiomyomatosis and Renal Cell
Cancer (HLRCC), von Hippel-Lindau disease
(VHL), Birt-Hogg-Dube Syndrome (BHDS), and
Hereditary Papillary renal carcinoma (HPRCC)
(Moch, Cubilla, Humphrey, Reuter, & Ulbright,
2016).
Birt-Hogg-Dube Syndrome (BHDS) is a major
autosomal dominantly inherited syndrome. BHDS is
mostly involved with chromophobe renal cell
carcinoma (crRCC), which is the third common
subtype of RCC as it accounts 4%-5% of the incidence
rate. This syndrome is associated with other benign or
malignant tumors in other organs. Patients with BHDS
deal with the RCC subtype chromophobe cell RCC,
which is often considered as the counterpart of the
benign oncocytoma, own hybrid forms (oncocytoma-
chromophobe) (Murphy, Burns, Murtagh, Rooshenas,
Martos, M. and Gomez, M.
Bioinformatics Analysis of Gene Targets for Birt-Hogg-Dube Syndrome Associated with Renal Cell Cancer using NetworkAnalyst.
DOI: 10.5220/0010767400003123
In Proceedings of the 15th International Joint Conference on Biomedical Engineering Systems and Technologies (BIOSTEC 2022) - Volume 3: BIOINFORMATICS, pages 73-80
ISBN: 978-989-758-552-4; ISSN: 2184-4305
Copyright
c
2022 by SCITEPRESS – Science and Technology Publications, Lda. All rights reserved
73

& Caskey, 2021). This hereditary syndrome is
becoming more evident due to the advancement in
pathological and molecular characterization and since
there are many histological features are associated
with distinct RCC hereditary, overlapping of their
features is possible (Carlo et al., 2019).
It is important to identify patients at risk for
hereditary RCC, as it may influence care (e.g. radical
versus partial nephrectomy and surveillance type and
schedule) and family members at risk could be
offered specific screening to enable early detection.
Each subtype is endowed with its unique risk factors,
prognosis, prevalence, survival rate, responsiveness
to diverse therapeutic agents, and clinical outcomes.
Furthermore, the main treatment is surgery combined
with chemotherapy and immunotherapy, but the
therapeutic effect is limited (Fisher, Gore, & Larkin,
2013). Therefore, it is necessary to further study the
pathogenesis of BHD syndrome to find possible early
diagnostic markers and therapeutic targets.
The objectives of the study are identifying the
main gene/s concern in differentiating the
pathogenesis on different classifications of RCC
specifically on BHDS disease and then integrating it
on web-tool based mainly named NetworkAnalyst
that will enable the user to construct a protein-protein
interaction network that will aid classification of the
pathophysiological pathways of this subtype of RCC.
This study focuses on the genes and pathways that
are needed to differentiate the specific subtype of
RCC therefore aimed at one organ, which is the
kidney. As the NetworkAnalyst is used as the main-
tool-based software, it also limits the resource of
collected microarray data by choosing the
ArrayExpress as the library resource for the dataset of
BHDS (E-GEOD-21816). It is also noted that
research on human tissues is used in conducting this
study on gene expressed table.
2 METHODOLOGY
2.1 Data Collection
The gene expression dataset of BHDS [E-GEOD-
21816 (GPL10175 Platform)] was manually searched
and gathered from ArrayExpress database. The
ArrayExpress (https://ebi.ac.uk/arrayexpress) is an
open-source platform for the storage of genetic data.
The E-GEOD-21816 dataset includes 6 normal kidney
tissues and 6 Birt-Hogg-Dube syndromes associated
with renal tumors patients. These microarray datasets
(BHDS kidney tissues vs. normal kidney tissues and
HLRCC kidney tissues vs normal kidney tissues) are
inputted in text file (.txt) and are uploaded in
NetworkAnalyst. Table 1 consists of the inclusions
and exclusions criteria for the microarray dataset.
Table 1: Inclusions and Exclusions criteria for microarray
datasets.
Inclusion Exclusion
Kidney tissues No other organ tissues
Homo sa
p
ien or
g
anis
m
Non-human or
g
anism
BHDS No other subtypes of
disease
2.2 Data Preprocessing, Quality Check,
and Normalization
In uploading, the gene expression table, data should
be specified according to their specific organism, data
type, ID type, and gene-level summarization. Both
datasets are specified as homo sapien, microarray
data, Entrez ID, and mean, accordingly. After the
datasets are successfully uploaded, a quality check
and normalization of the data are done to enable to
have more refined data analysis. Diagnostic plots
such as box plots and density plots are included in
both the quality check category and the normalization
category. These diagnostic plots give different
perspectives on the data. The distribution of gene
expression values can be seen through these
diagnostic plots and the results of different
normalization methods on sample clustering can be
visualized using PCA plots (G. Zhou et al., 2019).
Box plots are applied to examine the normalization
status. Log scale is applied if all data values are 20
while quantile normalization is used if all samples
have identical distribution (Xia, Gill, & Hancock,
2015). The two datasets are filtered and further
normalized to quantile normalization.
2.3 Identification of DEGs
NetworkAnalyst may also be used to distinguish
DEGs between renal tumor tissue and normal kidney
tissue samples. If one probe set does not contain the
homologous gene, or if one gene has numerous probe
sets, the data are removed (Li et al., 2021). Fold
change of the genes present in BHDS tumor
compared to normal kidney tissue were analyzed
using the LIMMA package. The comparison of
interest is set to its specific comparison (control vs.
infected). To determine the genes that are
significantly expressed on both datasets, the FDR
adjusted p-values were kept to less than 0.05. Based
on the fold change, genes were categorized into two
classes, up-regulated genes (log2FC > 2) and down-
BIOINFORMATICS 2022 - 13th International Conference on Bioinformatics Models, Methods and Algorithms
74
regulated genes (log2FC < -2), the cut-off statistic
criteria were based in the study of L. Zhou et al. (L.
Zhou, Li, Li, & Huang, 2020). Genes that were
commonly up-regulated and down-regulated in both
datasets were used to further analysis.
2.4 Pathway Enrichment Analysis
The pathway and process enrichment analysis were
performed in all the common DEGs in both datasets.
NetworkAnalyst allows users to perform functional
enrichment analysis for highlighted nodes using
different databases such as GO, KEGG, PANTHER,
and Reactome pathway databases (Xia, Benner, &
Hancock, 2014). KEGG, PANTHER, and Reactome
are commonly used for biological information
databases worldwide. The GO resource includes three
aspects of biology which are biological process (BP),
cellular component (CC), and molecular function
(MF), and it is also commonly used in bioinformatics.
The rule of significant is that P-value < 0.05 (Li et al.,
2021).
2.5 Networking Mapping and Visual
Analytics
This step deals with constructing PPI networks,
heatmaps, volcano plots, and other visualization
steps. The summary-level data (P values and fold
changes) from the two datasets are extracted and
integrated to identify genes that are significantly
altered in expression, based on overall evidence (Xia
et al., 2014). The significant genes of the datasets are
presented in PPI networks and visualization analysis.
In the PPI network, the number of nodes, edges, and
seed proteins are summarized for each network (Xia
et al., 2015). The clustering analysis of expression
levels of hub genes is performed using interactive
heatmaps or enrichment networks. The heatmap
visualization tool shows detailed gene expression
patterns underlying individual functions; while the
enrichment network tool provides an overview of all
enriched functions with similar ones connected by
edges (G. Zhou et al., 2019) that uses different
databases mentioned above.
3 RESULTS
3.1 Identification of DEGs
Following the preprocessing of the raw dataset, and
then thoroughly running it through the LIMMA
package, a total of 395 significant genes was
identified in the dataset of E-GEOD-21816. With cut-
off statistic criteria of p-value ≤ 0.05 and fold change
(FC) ≥ 2 or FC < -2, each set has generated their own
up and down regulated genes, for E-GEOD-21816
consists of 148 down-regulated genes and 247 up-
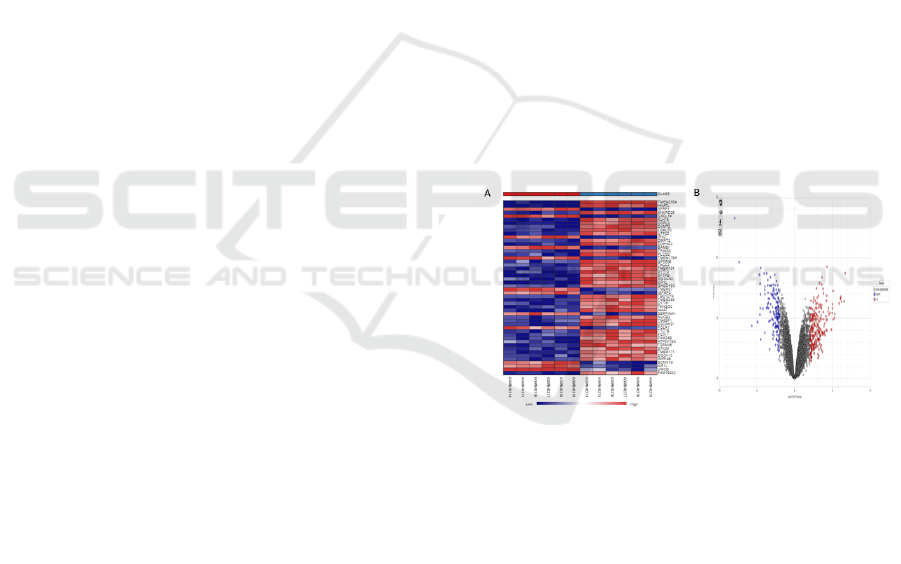
regulated genes. The visualization of the resulted
DEGs of BHDS dataset was done through volcano
plots heatmaps (Figure 1). Based on the DEGs,
heatmap analysis showed clear segregation of
patients with BHDS from the control sample (Figure
1A and Figure 1B). The top up and down regulated
DEGs ranked by fold change in BHDS is listed in
Table 2.
3.2 Pathway Enrichment Analysis
It was concluded that while PPIs are reliable in
discerning specific hub nodes that can describe the
gene’s centrality towards protein genes, it is only
enclosed within a specific subnetwork, hence the
usage of gene set enrichment analysis (GSEA). GSEA
is primarily used as a visual data analysis within the
NetworkAnalyst to produce gene count for the
enriched KEGG and GO pathways. P-value was added
to determine the probability of connection between the
pathway and BHDS genes seen in Tables 3 & 4.
Figure 1: Hierarchical clustering heatmap of (A) BHDS and
control sample. Volcano plot of DEGs between (B) BHDS
sample and control sample. The red circles found in the
volcano plots signify up-regulated genes while the blue
circles are the down-regulated genes, and the white circles
are non-significant genes. From the heatmap, the first six
columns from the left are the normal kidney tissue and the
last 6 columns are the tumor samples. The blue shade
signifies low expressed genes while the red shade defines
the high expressed genes.
3.3 Protein-Protein Interaction
Using both up and down regulated DEGs that were
produced by the statistical analyzation of the provided
sets, Hub nodes were identified through the string
interactome database and therefore established the
protein-protein interaction. As stated above, Table 5
Bioinformatics Analysis of Gene Targets for Birt-Hogg-Dube Syndrome Associated with Renal Cell Cancer using NetworkAnalyst
75

shows PPI can be used to determine the specific
subtype’s centrality towards BHDS genes. Figure 3
contains the visual representation of PPI network
from DEGs of BHDS.
4 DISCUSSION
The different types of renal cell carcinoma may pose
some difficulty in differentiating histologically as
many features of the subtypes overlap each other.
And because they all have designated treatment and
as well as contrasting prognosis, the utilization of
gene-expression microarray analysis is therefore
essential in the identification of molecular
pathogenesis that will aid in distinguishing
biomarkers that is important in clinical diagnosis,
especially in diseases where there is a limited amount
of information available due to the rarity of some
disorders (Caliskan, Andac, & Arga, 2020).
With that in mind, NetworkAnalyst was chosen as
the designated program that will generate gene
expression profiles as an innovative move to further
test the program if it is accurate enough to be used not
only to detect biomarkers but also construct pathways
specifically for BHDS.
As previously stated, renal cell carcinoma has a
high prevalence rate (Fisher et al., 2013) and within
the aforementioned subtype; chromophobe, though
not as much predominantly known as clear cell RCC
is shown more significant than its counterparts. And
from the previously gathered studies, BHDS has been
mentioned the most by papers by the papers amongst
the tumors that are enclosed within the chromophobe
subtype and was therefore selected to be analyzed
thoroughly.
4.1 Birt-Hogg-Dube Syndrome (BHDS)
Birt-Hogg-Sube syndrome (BHDS), a subtype of
chromophobe renal cell cancer (crRCC), is a
hereditary condition characterized by skin
fibrofolliculomas, pulmonary cysts, spontaneous
pneumothoraces, and multiple RCCs (Nickerson et
al., 2002). The germline mutation in the folliculin
(FLCN) gene affects this disorder but its function
remains unknown.
As DEGs from the dataset were used to produce
the pathway enrichment network analysis using
GSEA (Figure 2), therefore it conveys a much larger
visualization in terms of connection of gene towards
the disease. Referring to Tables 3 & 4 that include the
KEGG and GO pathways enriched from the DEGs of
BHDS.
Figure 2: Visual representation of GO: MF pathway
enriched in BHDS using GSEA network.
4.2 Pathway for BHDS
From reviewing the result in Table 4, it was
interpreted that while the research of Moch et al. may
say that the chromophobe form of RCC has a lowered
risk for metastasis (Moch & Ohashi, 2021), but its
subtype; specifically BHDS showed that cytoskeletal
protein binding has the highest genome count with
Table 2: The top up and down regulated DEGs of BHDS ranked by log2FC.
U
p
-re
g
ulated
g
enes Down-re
g
ulated
g
enes
Gene Symbol Log2Fc P-value Gene Symbol Log2FC P-value
Birt-Hogg-Dube Syndrome (BHDS)
CXCL14 6.689 7.1641E-13 TMEM255A -7.9156 3.856E-18
ALDOB 6.558 2.346E-9 HHATL -7.3352 3.413E-14
CALB1 6.177 2.567E-9 DAPL1 -5.6567 1.465E-6
UMOD 6.106 6.362E-10 PVALB -4.8824 5.800E-7
NAT8 6.048 2.388E-7 CKMT2 -4.6471 1.508E-12
PDZK1IP1 6.0416 1.1997E-9 PDZK1IP1 6.0416 1.1997E-9
ASS1 5.8721 3.8722E-9 ASS1 5.8721 3.8722E-9
PAH 5.3302 6.6718E-8 PAH 5.3302 6.6718E-8
BBOX1 5.2498 1.6913E-7 BBOX1 5.2498 1.6913E-7
PROM1 5.1054 2.7515E-7 PROM1 5.1054 2.7515E-7
BIOINFORMATICS 2022 - 13th International Conference on Bioinformatics Models, Methods and Algorithms
76

Table 3: Top KEGG pathways in the enrichment analysis
of significant DEGs associated with BHDS.
Birt-Hogg-Dube Syndrome (BHDS)
Pathway Gene
Count
P. value
Focal adhesion 168/199 1.57E-4
Fluid shear stress and
atherosclerosis
119/139 1.64E-4
Cell adhesion molecules 105/146 1.64E-4
Leukocyte transendothelial
migration
89/112 1.68E-4
TGF-
b
eta si
g
nalin
g
p
athwa
y
71/92 1.71E-4
Protein digestion and
absorption
70/90 1.72E-4
Bios
y
nthesis of amino acids 61/75 1.75E-4
Complement and
coa
g
ulation cascades
59/79 1.75E-4
Glycolysis/Gluconeogenesis 51/68 1.77E-4
Oxidative
p
hos
p
hor
y
lation 106/133 2.55E-4
Table 4: Top GO (BP, MF, CC) terms in the enrichment
analysis of significant DEGs associated with BHDS.
PATHWAY GENE
COUNT
P-VALUE
Biological Process (BP)
Wound Healing 483/610 1.4E-4
Positive regulation of cell
proliferation
478/668 1.4E-4
Regulation of anatomical
structure morphogenesis
478/605 1.4E-4
Regulation of body fluid
levels
469/595 1.4E-4
Vasculature development
429/523 1.43E-4
Response to biotic
stimulus
432/614 1.43E-4
Response to other
mechanism
413/586 1.44E-4
Negative regulation of
development process
404/563 1.44E-4
Regulation of growth
408/518 1.44E-4
Negative regulation of
cell proliferation
409/526 1.44E-4
Molecular Function (MF)
Cytoskeletal protein
binding
497/635 1.39E-4
Calcium ion binding
442/662 1.41E-4
Structural molecule
activity
428/624 1.43E-4
Actin binding
278/356 1.51E-4
Metal ion transmembrane
transporter activity
267/373 1.52E-4
Enzyme inhibitor activity
229/322 1.54E-4
Substrate specific channel
activity
228/376 1.54E-4
Anion transmembrane
transporter activity
165/229 1.60E-4
Secondary active
transmembrane activity
146/192 1.61E-4
Glycosaminoglycan
binding
136/172 1.63E-4
Cellular Component (CC)
Cell surface
351/488 1.47E-4
Extracellular matrix
313/424 1.48E-4
Actin cytoskeleton
292/366 1.5E-4
Proteinaceous
extracellular matrix
262/362 1.51E-4
Cell-cell junction
232/292 1.54E-4
Apical plasma membrane
169/212 1.62E-4
Extracellular matrix part
139/178 1.64E-4
External side of plasma
membrane
142/202 1.64E-4
Apical junction complex
96/117 1.7E-4
Anchored to membrane
97/146 1.7E-4
Table 5: The top 10 significant hub genes of BHDS
according to their betweenness and their designated p-
values.
Hub Nodes P-value Betweenness
BHDS
KIT 7.00E-9 102791.3
RHOB 2.74E-9 68625.94
UBC 0.062274 63768.85
PLG 0.003165 40525.61
AGT 4.70E-5 40265.16
THBS1 4.09E-7 38286.66
SRC 0.36754 33653.63
KNG1 2.34E-5 30817.65
FHL2 7.28E-6 29003.64
PRKAR2B 8.04E-7 27625.94
497/635 and has significantly lowered p-value of
1.39E-4 which means that a lot of genes that is
involved in cytoskeletal protein binding pathway is
included with the progression of BHDS. This in turn,
may potentially point out that unlike the previously
constructed views of BHDS, it may possibly have a
higher risk of metastasis. Figure 4 shows a schematic
representation of the mechanism of cytoskeletal
protein binding pathway enriched in BHDS.
4.2.1 Cytoskeletal Protein Binding
Cytoskeletal proteins contain different sub-families
of proteins mainly which are Microtubules, Actin,
and Intermediate Filaments (Pacheco & Gallo, 2016).
The mechanism of these proteins is altered in cancer
cells as they promote tumor growth by increasing the
cells’ migratory and invasive function alongside its
ability to proliferate and the resistance to cellular
Bioinformatics Analysis of Gene Targets for Birt-Hogg-Dube Syndrome Associated with Renal Cell Cancer using NetworkAnalyst
77

environmental stress such as: mitochondrial and
oxidative stress (Allen et al., 2020). Mutations from
these genes may result in metastasis and therefore and
because of the high genome count and the
significance of its p-value, this may very well allude
to the possible metastatic characteristic of BHDS.
4.3 Hub Nodes for BHDS
In alignment with the statement above, three hub
nodes were selected in terms of increasing
betweenness. As this describes the gene’s centrality
towards other genes that are involved in the diseases’
progression. These are: KIT (betweenness:
102791.3), RHOB (betweenness: 68625.94), and
UBC (betweenness: 63768.85) in descending order.
4.3.1 c-KIT Gene Expression
C-KIT proto-oncogene is located on chromosome 4q
and is considered to be part of class III of tyrosine
kinase receptor (TKR) family. It is known to regulate
several physiological functions such as:
hematopoiesis, erythropoiesis, lymphopoiesis,
megakaryopoiesis, gametopoiesis, and
melanogenesis (Martinez-Anton, Gras, Bourdin,
Dubreuil, & Chanez, 2019). All of these are essential
to the biological process of human beings. Numerous
research have suspected that this particular gene
could be a potential biomarker to the chromophobe
type of RCC as evidences show that it is found 77%
to 100% in cases of this type of variety, and therefore
is also a potentially targeted for therapeutic
modalities (Yamazaki et al., 2003).
Using NetworkAnalyst, Figure 5 shown that C-
KIT is connected to a gene called RAC1. RAC1 is
considered as one of the key regulators for cellular
motility and structure as the members of RAC family
is considered to hold regulatory functions over
cytoskeletal structures, mainly Actin (Tejada-Simon,
2015). As it primarily controls the mechanism behind
the moderation of other signaling pathways that are
involved in cell cycle regulation, cellular growth,
formation of cell-cell adhesion, and contact
inhibition, and these mediated activities are
considered to be highly involved in progression of
malignancy as it is included in angiogenesis,
invasion, and metastasis which are dependent from
the mutations from the genes assigned in it (Olson &
Sahai, 2009).
Figure 3: (A) The top 10 extracted hub nodes (Left to Right,
Top to Bottom: PRKAR2B, KIT, FHL2, UBC, RHOB,
KNG1, AGT, SRC, THBS1, PLG) The red-colored gene
are seed genes, while purple-colored gene are: protein gene.
(B) Along with the overall presentation of protein-protein
interaction network for BHDS.
4.3.2 RHOB Gene Expression
RhoB is part of the Ras Homolog gene gamily or
better known as Rho subgroup of GTPase which is
included along with RhoA and RhoC. This family of
genes is critical for analyzing regulation of cellular
action and modulation of cytoskeleton-mediated
motion and adhesion, as well as protein trafficking
(Haga & Ridley, 2016).
Rho GTPases functions are directed by
conversion of GDP-bound inactive states to GTP-
bound active states. This activation is caused by three
factors: Guanine nucleotide exchange factors (GEFs),
GTPase activating proteins (GAPs), and guanine
nucleotide dissociation inhibitors (GDI). The
switches between active and inactive form are critical
in regulating intracellular signaling pathways
(Gampel & Mellor, 2002; Haga & Ridley, 2016).
Though the three subgroups of Rho GTPase share
similar homology, they have different functions.
Mainly RhoB is believed to have a putative tumor
suppressor role, compared to the other two, which is
claimed to have an oncogenic association (Ju &
Gilkes, 2018). This particular function of RhoB
serves in the signaling pathways including the EGFR,
RAS, PI3K/AKT/mTOR, and MYC pathways
(Gutierrez et al., 2019).
4.3.3 UBC Gene Expression
Ubiquitin C gene is described as a stress-inducible
gene, upregulated upon different cell treatments as
well as in other diseases (Radici, Bianchi, Crinelli, &
Magnani, 2013). As it is one of the main hub nodes
shown in the table above that was detected through
the use of NetworkAnalyst, upon further inspection,
WNK4 a subfamily of WNK protein is the one
associated gene connected to UBC (Figure 5).
BIOINFORMATICS 2022 - 13th International Conference on Bioinformatics Models, Methods and Algorithms
78
Interestingly, recent studies about the link
between WNK4 and Rho GTPases have emerged; it
shows that WNK4 can be isolated in a complex with
Rho-GDI (Zhang et al., 2009) and while it is observed
that the expression of WNK4 was found to be
correlated with invasiveness as with metastatic
tumors such as infiltrative gliomas or in other neural
tumor cells the exact relationship between the genes
is still largely undetermined (Hong et al., 2007). In
addition, WNK4 is required for the activation of
extracellular signal-regulated kinases and Mitogen-
activated Protein/ERK Kinases (MEKK2/3)
pathways. Alongside other reports, this suggests that
WNK4 is involved in many factors that attribute to
carcinogenesis and is an important role in tumor cell
growth and remodeling of extracellular matrix for
tumor invasion (Sie et al., 2020).
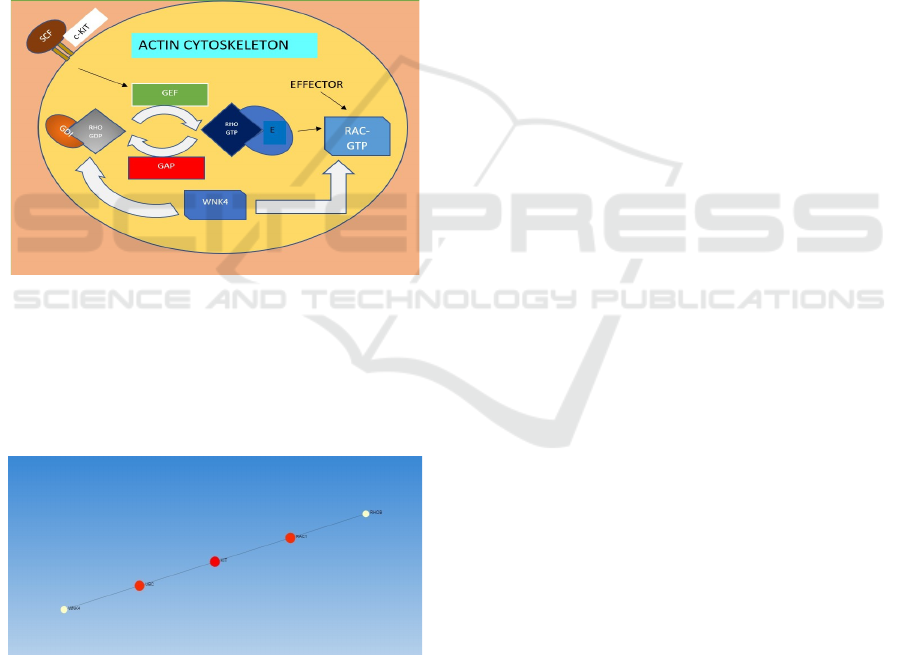
Figure 4: The mechanism of the pathway enriched in
BHDS: Cytoskeletal protein binding. As C- KIT forms a
heterodimer, SCF binds to it resulting to activation of RHO
GTPase from inactive state. Then RHO GTPase will
promote the activation of an effector such as RAC1 that
regulates the Actin cytoskeleton. RAC1 can also be affected
with the correlation of WNK4 with RHO GDI.
Figure 5: Protein-Protein Interaction of WNK 4 gene
connecting to seed gene UBC and seed gene KIT to RAC1
gene.
And in that note, the connection between these
genes and the given pathways may still up for further
studies, they may support the suspicions that there are
other characteristics traits of BHDS that have not
been explored fully, and the presence of genes in the
result above, bodes significance in terms of
determinants for other biomarkers that may comprise
this disease but also for alternative targeted
treatments that may help patients in the future
5 CONCLUSION
The resulted hub genes from the PPI networks, which
were ranked according to its betweenness, correspond
with the high scored gene count and p-value enriched
pathways. With the relation of the pathway and hub
genes in the BHDS disease, it showed different
pathophysiological features of this subtype of RCC.
In this study, RAC1 and WNK4 genes were found to
be connected to KIT, RHOB, and UBC respectively.
These genes are known to highly affect the cell
metastasis of patient with BHDS and play crucial role
in Cytoskeletal protein binding, as these hub nodes
control the regulation of cellular action and
modulation of cytoskeletal structures.
In conclusion, this study gave significantly fresh
insights for further examination on topics of diagnosis
and the widening berth of therapeutic modalities for
BHDS.
REFERENCES
Allen, A., Gau, D., Francoeur, P., Sturm, J., Wang, Y.,
Martin, R., … Roy, P. (2020). Actin-binding protein
profilin1 promotes aggressiveness of clear-cell renal
cell carcinoma cells. Journal of Biological Chemistry.
https://doi.org/10.1074/jbc.RA120.013963
Caliskan, A., Andac, A. C., & Arga, K. Y. (2020). Novel
molecular signatures and potential therapeutics in renal
cell carcinomas: Insights from a comparative analysis
of subtypes. Genomics. https://doi.org/10.1016/
j.ygeno.2020.06.003
Carlo, M. I., Hakimi, A. A., Stewart, G. D., Bratslavsky, G.,
Brugarolas, J., Chen, Y. B., … Coleman, J. A. (2019).
Familial Kidney Cancer: Implications of New
Syndromes and Molecular Insights. European Urology.
https://doi.org/10.1016/j.eururo.2019.06.015
Chen, F., Zhang, Y., Şenbabaoğlu, Y., Ciriello, G., Yang,
L., Reznik, E., … Creighton, C. J. (2016). Multilevel
Genomics-Based Taxonomy of Renal Cell Carcinoma.
Cell Reports. https://doi.org/10.1016/j.celrep.2016.
02.024
Chen, Y. Y., Hu, H. H., Wang, Y. N., Liu, J. R., Liu, H. J.,
Liu, J. L., & Zhao, Y. Y. (2020). Metabolomics in renal
cell carcinoma: From biomarker identification to
pathomechanism insights. Archives of Biochemistry
and Biophysics. https://doi.org/10.1016/j.abb.
2020.108623
Bioinformatics Analysis of Gene Targets for Birt-Hogg-Dube Syndrome Associated with Renal Cell Cancer using NetworkAnalyst
79

Fisher, R., Gore, M., & Larkin, J. (2013). Current and future
systemic treatments for renal cell carcinoma. Seminars
in Cancer Biology. https://doi.org/10.1016/
j.semcancer.2012.06.004
Gampel, A., & Mellor, H. (2002). Small interfering RNAs
as a tool to assign Rho GTPase exchange-factor
function in vivo. Biochemical Journal. https://doi.
org/10.1042/BJ20020844
Gutierrez, E., Cahatol, I., Bailey, C. A. R., Lafargue, A.,
Zhang, N., Song, Y., … Zhang, C. (2019). Regulation
of RhoB gene expression during tumorigenesis and
aging process and its potential applications in these
processes. Cancers. https://doi.org/10.3390/cancer
s11060818
Haga, R. B., & Ridley, A. J. (2016). Rho GTPases:
Regulation and roles in cancer cell biology. Small
GTPases. https://doi.org/10.1080/21541248.2016.123
2583
Hong, C., Moorefield, K. S., Jun, P., Aldape, K. D.,
Kharbanda, S., Phillips, H. S., & Costello, J. F. (2007).
Epigenome scans and cancer genome sequencing
converge on WNK2, a kinase-independent suppressor of
cell growth. Proceedings of the National Academy of
Sciences of the United States of America.
https://doi.org/10.1073/pnas.0700683104
Ju, J. A., & Gilkes, D. M. (2018). Rhob: Team oncogene or
team tumor suppressor? Genes. https://doi.org/
10.3390/genes9020067
Li, F., Jin, Y., Pei, X., Guo, P., Dong, K., Wang, H., …
Wang, Z. (2021). Bioinformatics analysis and
verification of gene targets for renal clear cell
carcinoma. Computational Biology and Chemistry.
https://doi.org/10.1016/j.compbiolchem.2021.107453
Linehan, W. M., Srinivasan, R., & Schmidt, L. S. (2010).
The genetic basis of kidney cancer: A metabolic
disease. Nature Reviews Urology. https://doi.org/
10.1038/nrurol.2010.47
Martinez-Anton, A., Gras, D., Bourdin, A., Dubreuil, P., &
Chanez, P. (2019). KIT as a therapeutic target for non-
oncological diseases. Pharmacology and Therapeutics.
https://doi.org/10.1016/j.pharmthera.2018.12.008
Moch, H., Cubilla, A. L., Humphrey, P. A., Reuter, V. E.,
& Ulbright, T. M. (2016). The 2016 WHO
Classification of Tumours of the Urinary System and
Male Genital Organs—Part A: Renal, Penile, and
Testicular Tumours. European Urology. https://doi.
org/10.1016/j.eururo.2016.02.029
Moch, H., & Ohashi, R. (2021). Chromophobe renal cell
carcinoma: current and controversial issues. Pathology.
https://doi.org/10.1016/j.pathol.2020.09.015
Murphy, E., Burns, A., Murtagh, F. E. M., Rooshenas, L.,
& Caskey, F. J. (2021). The Prepare for Kidney Care
Study: prepare for renal dialysis versus responsive
management in advanced chronic kidney disease.
Nephrology, Dialysis, Transplantation : Official
Publication of the European Dialysis and Transplant
Association - European Renal Association.
https://doi.org/10.1093/ndt/gfaa209
Nickerson, M. L., Warren, M. B., Toro, J. R., Matrosova,
V., Glenn, G., Turner, M. L., … Schmidt, L. S. (2002).
Mutations in a novel gene lead to kidney tumors, lung
wall defects, and benign tumors of the hair follicle in
patients with the Birt-Hogg-Dubé syndrome. Cancer
Cell. https://doi.org/10.1016/S1535-6108(02)00104-6
Olson, M. F., & Sahai, E. (2009). The actin cytoskeleton in
cancer cell motility. Clinical and Experimental
Metastasis. https://doi.org/10.1007/s10585-008-9174-2
Pacheco, A., & Gallo, G. (2016). Actin filament-microtubule
interactions in axon initiation and branching. Brain
Research Bulletin. https://doi.org/10.1016/j.brain
resbull.2016.07.013
Radici, L., Bianchi, M., Crinelli, R., & Magnani, M. (2013).
Ubiquitin C gene: Structure, function, and transcriptional
regulation. Advances in Bioscience and Biotechnology.
https://doi.org/10.4236/abb.2013.412141
Sie, Z. L., Li, R. Y., Sampurna, B. P., Hsu, P. J., Liu, S. C.,
Wang, H. D.,Yuh, C. H. (2020). WNK1 kinase stimulates
angiogenesis to promote tumor growth and metastasis.
Cancers. https://doi.org/10.3390/cancers12030575
Singh, D. (2021). Current updates and future perspectives
on the management of renal cell carcinoma. Life
Sciences. https://doi.org/10.1016/j.lfs.2020.118632
Tejada-Simon, M. V. (2015). Modulation of actin dynamics
by Rac1 to target cognitive function. Journal of
Neurochemistry. https://doi.org/10.1111/jnc.13100
Thompson, R. H., Ordonez, M. A., Iasonos, A., Secin, F. P.,
Guillonneau, B., Russo, P., & Touijer, K. (2008). Renal
Cell Carcinoma in Young and Old Patients-Is There a
Difference? Journal of Urology. https://doi.org/1
0.1016/j.juro.2008.06.037
Xia, J., Benner, M. J., & Hancock, R. E. W. (2014).
NetworkAnalyst - Integrative approaches for protein-
protein interaction network analysis and visual
exploration. Nucleic Acids Research. https://doi.
org/10.1093/nar/gku443
Xia, J., Gill, E. E., & Hancock, R. E. W. (2015).
NetworkAnalyst for statistical, visual and network-
based meta-analysis of gene expression data. Nature
Protocols. https://doi.org/10.1038/nprot.2015.052
Yamazaki, K., Sakamoto, M., Ohta, T., Kanai, Y., Ohki,
M., & Hirohashi, S. (2003). Overexpression of KIT in
chromophobe renal cell carcinoma. Oncogene.
https://doi.org/10.1038/sj.onc.1206153
Zhang, Z., Xu, X., Zhang, Y., Zhou, J., Yu, Z., & He, C.
(2009). LINGO-1 interacts with WNK1 to regulate
nogo-induced inhibition of neurite extension. Journal
of Biological Chemistry. https://doi.org/10.1074/
jbc.M808751200
Zhou, G., Soufan, O., Ewald, J., Hancock, R. E. W., Basu,
N., & Xia, J. (2019). NetworkAnalyst 3.0: A visual
analytics platform for comprehensive gene expression
profiling and meta-analysis. Nucleic Acids Research.
https://doi.org/10.1093/nar/gkz240
Zhou, L., Li, Y., Li, Z., & Huang, Q. (2020). Mining
therapeutic and prognostic significance of STATs in
renal cell carcinoma with bioinformatics analysis.
Genomics. https://doi.org/10.1016/j.ygeno.2020.06.032
BIOINFORMATICS 2022 - 13th International Conference on Bioinformatics Models, Methods and Algorithms
80
