
Methodology for Assessing the Quality of an Educational Program and
Educational Activities of a Higher Education Institution Using a Neural
Network
Andriy V. Ryabko
1 a
, Tetiana A. Vakaliuk
2,3,4 b
, Oksana V. Zaika
1 c
, Roman P. Kukharchuk
1 d
,
Viacheslav V. Osadchyi
5 e
and Inesa V. Novitska
6 f
1
Olexander Dovzhenko Glukhiv National Pedagogical University, 24 Kyievo-Moskovska Str., Glukhiv, 41400, Ukraine
2
Zhytomyr Polytechnic State University, 103 Chudnivska Str., Zhytomyr, 10005, Ukraine
3
Institute for Digitalisation of Education of the NAES of Ukraine, 9 M. Berlynskoho Str., Kyiv, 04060, Ukraine
4
Kryvyi Rih State Pedagogical University, 54 Gagarin Ave., Kryvyi Rih, 50086, Ukraine
5
Borys Grinchenko Kyiv University, 18/2 Bulvarno-Kudriavska Str., Kyiv, 04053, Ukraine
6
Zhytomyr Ivan Franko State University, 30 Velyka Berdychivska Str., Zhytomyr, 10002, Ukraine
Keywords:
Evaluation Criteria, Educational Program, Educational Activities, Prognostication, Rating, ANFIS, Artificial
Neural Networks.
Abstract:
The article discusses a methodology for assessing the quality of educational programs and activities in higher
education institutions using artificial intelligence tools such as the adaptive system of neuro-fuzzy inference
(ANFIS) and an L-layer neural network. The purpose of the study was to address the problem of objectivity
in self-assessment and identify potential problems and shortcomings in educational activities before the start
of an accreditation examination. The study used student ratings on a four-level assessment scale as input
data for the L-layer neural network, and the criteria for assessing the quality of the educational program as
input variables for the ANFIS system. The hypothesis was that students with higher ratings of educational
achievement would provide more objective assessments of the quality criteria of the educational program
and activities. The results showed that the L-layer neural network made more accurate predictions than the
ANFIS model. The article suggests that this approach can provide higher education managers with qualitative
forecasts to determine the quality of educational services and identify potential problems before the start of
an accreditation examination. However, the study acknowledges the need for further research on larger data
volumes to improve the predictive capabilities of the models.
1 INTRODUCTION
In assessing the quality of education, as well as in
conducting pedagogical research, we are faced with
information that has non-numerical characteristics
that are difficult to formalize. For example, the num-
ber of computers, the number of students, the area
of educational premises in a higher education insti-
tution are measurable, but the evaluation of the edu-
a
https://orcid.org/0000-0001-7728-6498
b
https://orcid.org/0000-0001-6825-4697
c
https://orcid.org/0000-0002-8479-9408
d
https://orcid.org/0000-0002-7588-7406
e
https://orcid.org/0000-0001-5659-4774
f
https://orcid.org/0000-0003-0780-0580
cational program and educational activities according
to the educational program is carried out according
to non-numerical criteria. The institution in the pro-
cess of self-assessment, and subsequently the experts
in the process of accreditation examination, must as-
sess according to the assessment scale, which covers
four levels of compliance with the criteria: A, B, E, F.
As a result, there is a need to build methods for
quantitative description of processes and subjects re-
lated to assessing the quality of the educational pro-
gram and educational activities. Of particular im-
portance is the quality of education, which means
some total indicator that reflects the results of the
educational institution, as well as compliance with
the needs and expectations of society (different so-
cial groups) in the formation of individual competen-
Ryabko, A., Vakaliuk, T., Zaika, O., Kukharchuk, R., Osadchyi, V. and Novitska, I.
Methodology for Assessing the Quality of an Educational Program and Educational Activities of a Higher Education Institution Using a Neural Network.
DOI: 10.5220/0012062800003431
In Proceedings of the 2nd Myroslav I. Zhaldak Symposium on Advances in Educational Technology (AET 2021), pages 179-198
ISBN: 978-989-758-662-0
Copyright
c
2023 by SCITEPRESS – Science and Technology Publications, Lda. Under CC license (CC BY-NC-ND 4.0)
179

cies. The methods of quantitative evaluation of the
educational program and educational activities under
this program will allow the higher education institu-
tion to identify existing shortcomings and potential
problems, as well as provide an opportunity to address
them before the accreditation examination.
Assessing the quality of educational programs and
educational activities is complicated by the fact that
the value of this indicator depends on many factors,
possibly with an unknown nature of influence. Also
in this case there is a specificity of the “product” of
education – a graduate of an educational institution,
which should be considered as a complex system.
There are various methods and algorithms for assess-
ing the quality of educational activities. In this study,
we propose a method of assessing the quality of edu-
cational programs and educational activities based on
the neuro-fuzzy approach, due to the active develop-
ment of analytical systems, based on the technology
of artificial intelligence. The most popular and proven
of these technologies are neural networks, which suc-
cessfully solve a variety of “fuzzy” tasks – predic-
tion, classification, recognition of handwritten text,
language, images (Markova et al., 2018; Tarasenko
et al., 2019; Kirichek et al., 2019; Porokhnya and
Ostapenko, 2019; Horal et al., 2020; Valko and Os-
adchyi, 2020). In such problems, where traditional
technologies are powerless, neural networks often act
as the only effective solution. In this work, artificial
neural networks are used to solve the problem of as-
sessing the quality of educational programs and edu-
cational activities.
Mandatory conditions for accreditation are com-
pliance with the educational program and educational
activities of the higher education institution under this
educational program with the criteria established by
law. In particular, the forms and methods of teach-
ing should contribute to the achievement of the stated
goals of the educational program and program learn-
ing outcomes.
Since the educational program and educational
activities must meet the requirements of a student-
centered approach and the principles of academic
freedom, the hypothesis of the study is that based on a
sample of students and graduates of higher education,
the quality of educational programs and educational
activities, which will be able to adequately perform a
comprehensive assessment of the quality of the edu-
cational program and educational activities.
Intelligent data processing using a neural network
allows forming forecast probabilities of values of fu-
ture results of accreditation examination in a higher
education institution, which can contribute to the im-
provement of measures to improve the educational
program. The results of forecasting can be used by
the management of faculties and graduating depart-
ments as informative and recommendatory. In ad-
dition, guarantors of educational programs based on
forecasts can plan activities and individual work with
teachers to positively change the forecast. Thanks to
the analysis of the received data it is possible to reveal
weak points of the educational process that will give
the chance to modernize it.
With this in mind, the article aims to substanti-
ate, develop and implement a mathematical model of
a comprehensive assessment of the quality of educa-
tional programs and educational activities based on
the methods of the neuro-fuzzy approach.
1.1 Theoretical Background
Assessing the quality of educational activities accord-
ing to clearly defined criteria and methodologies is
an important task in the process of accreditation of
educational programs, which are used to train appli-
cants for higher education in Ukraine. In the pro-
cess of preparing for accreditation and preparation of
materials for self-assessment of the educational pro-
gram, there are problems in determining the objec-
tivity of self-assessment and finding potential prob-
lems and shortcomings of educational activities. Due
to this problem, the urgent task is to find mathematical
tools that could be used by managers of higher edu-
cation institutions in their approaches to determining
the quality of educational services offered.
The paradigm shift in educational philosophy and
practice has led to focusing primarily on student
learning outcomes. The educational process should
be results-oriented – what exactly students know and
can actually do. Accordingly, student-centered learn-
ing is an approach in which students influence the
content, activities, materials, and pace of their learn-
ing. This model of learning puts the student at the
center of the learning process (Black et al., 2015).
EU initiatives call for increased efficiency, inter-
national attractiveness, and competitiveness of higher
education institutions. W
¨
achter et al. (W
¨
achter et al.,
2015) considers different approaches to quality, qual-
ity assurance, and ratings, analyzes recent research,
critically analyzes these approaches in a compara-
tive perspective, provides recommendations and pol-
icy options for parliament.
The problem of determining a set of effective indi-
cators that are easy to determine and can be applied to
both large public universities and small regional pri-
vate colleges, from university programs to alternative
programs is also relevant for the United States (Ham-
merness and Klette, 2015).
AET 2021 - Myroslav I. Zhaldak Symposium on Advances in Educational Technology
180

Cherniak et al. (Cherniak et al., 2020) investigated
the possibility of assessing the quality of qualime-
try objects by graph analytical method, ie to apply
the principle of determining the area and volume un-
der curved surfaces both in the plane and in space,
which are created by combining estimates of individ-
ual quality indicators on a dimensionless scale. It is
shown that, as a rule, mathematical dependences are
nonlinear and their research is reduced to the devel-
opment of universal methods that could be applied to
objects of qualimetry, regardless of their nature, com-
plexity, importance, and more. Having unit quality in-
dicators in a single (dimensionless) rating scale, it is
proposed to determine a single comprehensive quality
indicator of the object of qualimetry using the method
of integration, which takes into account the evaluation
of unit quality indicators.
Parvu and Ipate (Parvu and Ipate, 2007) propose a
mathematical model based on a set of indicators that
are adapted to the classification structure of intellec-
tual capital, which is unanimously recognized world-
wide, namely to the external and internal structure and
competence of employees. The Rompedet method, an
original product of the Romanian school of manage-
ment (Isac et al., 2010), was used as a mathematical
calculation tool.
When assessing the quality of education, we are
faced with a huge number of different criteria, each
of which may consist of many sub-criteria, therefore,
the task of assessing the quality of education in its
mathematical formulation is multi-criteria. Problem
situations that are modeled and described by linear
models and depend on many factors play an impor-
tant role, so solving a multicriteria decision-making
problem is often accompanied by solving multicrite-
ria linear programming problems, or in other words,
vector optimization problems.
Given these problems, mathematical models of in-
tegrated quality assessment using methods that are
based on the convolution of criteria were also of in-
terest for our study. Models and methods of multi-
criteria optimization are considered in (Kondruk and
Maliar, 2019), in particular, the method of additive
convolution of criteria and the method of multiplica-
tive and minimax convolution of criteria. The method
of multiplicative convolution of partial criteria to a
single generalized indicator, which provides as a nor-
malized divisor to use the maximum (minimum) val-
ues of partial criteria, obtaining which does not cause
significant difficulties, ie is carried out on many avail-
able design solutions is considered in (Grytsyuk and
Grytsiuk, 2014). Chervak (Chervak, 2010) uses one
of the methods of solving the Paretian multicriteria
optimization problem as a mathematical tool of the
decision-making process. To organize the selection
problems on the same admissible set of alternatives,
the concept of the super criterion of any criterion is
introduced; if the criterion is a super criterion of this
criterion on this set, then the last criterion is a sub-
criteria of the first. It is shown that the solution of
the problem of multicriteria selection by the Paretian
convolution is reduced to the solution of the problems
of scalar or lexicographic optimization.
The theory of artificial neural networks and mod-
els of deep learning is considered in the fundamental
works (Goodfellow et al., 2016; M
¨
uller et al., 1995;
Sivanandam et al., 2006), system design based on a
neuro-fuzzy approach (Shtovba, 2007; Shtovba and
Pankevych, 2018).
The use of neural networks to classify the status
of a graduate of a higher education institution based
on selected academic, demographic, and other indica-
tors is considered by Lesinski et al. (Lesinski et al.,
2016). A multilayer neural network with feedback
is used as a model. The model was taught based
on more than 5,000 records of entrance exams and
university databases. Nine input variables consisted
of categorical and numerical data that contained in-
formation about high school education, test results,
assessment of high school teachers, parental assess-
ment, and others. Based on these inputs, the multi-
layer neural network predicted the success of univer-
sity entrants. With the help of the neural network,
it was possible to predict the success of graduates
and achieve the best performance with an accuracy
of classification exceeding 95%. Black et al. (Black
et al., 2015) examining the relationship between qual-
ity and success of high school students in college
found no convincing evidence that exposure charac-
teristics of high school diminish over time teaching
students.
To address the issue of determining the quality
of educational training, Mahapatra and Khan (Ma-
hapatra and Khan, 2007) developed the EduQUAL
methodology and proposed an integrative approach
using neural networks to assess the quality of educa-
tion. Four neural network models based on a feedback
algorithm are used to predict the quality of education
for different stakeholders. This study showed that the
P-E Gap model is the best model for all stakeholders.
The need to introduce neural network technology
in educational courses of educational institutions in-
dicates by Semerikov et al. (Semerikov et al., 2022).
Educational neural networks are often used for fore-
casting. For example, students must choose courses
that interest them for the next semester. Due to lim-
itations, including lack of sufficient resources and
the overhead of several courses, some universities
Methodology for Assessing the Quality of an Educational Program and Educational Activities of a Higher Education Institution Using a
Neural Network
181

may not be able to teach all courses of the student’s
choice. Universities need to know each student’s re-
quirements for each course each semester for optimal
course planning. Kardan et al. (Kardan et al., 2013)
used a neural network to model student choice behav-
ior and apply the resulting function to predict the fi-
nal enrollment of students for each course. The re-
sults showed high prediction accuracy based on ex-
perimental data. Arsad et al. (Arsad et al., 2013),
Osadchyi et al. (Osadchyi et al., 2018), Okubo et al.
(Okubo et al., 2017b) prove that the use of neural net-
works in predicting educational processes will allow
obtaining results with a much higher level of accu-
racy and less time. According to Abu Naser et al.
(Abu Naser et al., 2015), an artificial neural network
can correctly predict the success of more than 80% of
future students.
Chaban and Kukhtiak (Chaban and Kukhtiak,
2020) analyze the problem of the social system, which
consists of many students and teachers of higher ed-
ucation to create effective learning pairs “teacher-
student”. Elements of the theory of artificial intelli-
gence based on artificial neural networks were used
to form the mentioned learning pairs. Okubo et al.
(Okubo et al., 2017a) propose to use a recurrent neu-
ral network (RNN) to predict students’ final grades
using journal data stored in educational systems.
Liu et al. (Liu et al., 2022) propose a method
for assessing the quality of preparation for graduate
school, which is based on the algorithm of neural net-
work backpropagation and stress testing. This method
creates a publicly available list of indicators consist-
ing of 19 criteria in 4 groups of criteria, such as at-
titudes towards teaching, teaching content, approach
to teaching, and the main characteristics of teachers.
After the neural network algorithm is used to deter-
mine the optimal parameters of the evaluation model,
a sensitivity test is used to identify indicators that have
a significant impact on the quality of education. Also,
scenario analysis is used to study the impact of the
quality of education in pre-defined situations, provid-
ing theoretical and empirical support for assessing the
quality of postgraduate teaching, improving the qual-
ity of education, and professional growth of teachers.
Educational institutions are constantly striving to
improve the services they offer, their goal is to have
the best teaching staff, improve the quality of teach-
ing and academic success of students. Knowledge of
the factors influencing student learning can help uni-
versities and learning centers adapt their curricula and
teaching methods to students’ needs. One of the first
measures taken by educational institutions in the con-
text of the COVID-19 pandemic was the creation of
virtual learning environments (Pererva et al., 2020).
To understand the factors influencing the university
learning process in virtual learning environments, Ri-
vas et al. (Rivas et al., 2021) applied several automatic
learning methods to publicly available data sets, in-
cluding tree-like models and various types of artificial
neural networks.
The availability of educational data supported by
learning platforms provides opportunities to study
student behavior and solve problems in higher edu-
cation, optimize the educational environment and en-
sure decision-making using an artificial neural net-
work (Waheed et al., 2020).
Cader (Cader, 2020) uses a deep neural network to
assess students’ acquisition of knowledge and skills.
It is noted that the obstacle to the application of the
method in teaching is the relatively small amount of
data in the form of available estimates required for
neural network training. A new method of data aug-
mentation is proposed – asynchronous data augmen-
tation through pre-categorization, which solves this
problem. Using the proposed method, it is possible
to carry out neural network training even for small
amounts of data.
Do and Chen (Do and Chen, 2013) present a
neuro-fuzzy classifier that used the results of previ-
ous exams and other related factors as input variables
and classified students based on their expected learn-
ing outcomes. The results showed that the proposed
approach achieved high accuracy compared to the re-
sults obtained based on other known approaches to
classification, in particular, Naive Bayes, neural net-
works, and others.
Fazlollahtabar and Mahdavi (Fazlollahtabar and
Mahdavi, 2009) proposed a neuro-fuzzy approach
based on evolutionary techniques to obtain the opti-
mal learning pathway for both teacher and student.
The neuro-fuzzy approach allows providing recom-
mendations to the teacher for making pedagogical de-
cisions based on the student’s learning style. On the
other hand, the neural network approach is used for
the student to create a personalized curriculum profile
based on the individual needs of the student in a fuzzy
environment.
Taylan and Karag
¨
ozo
˘
glu (Taylan and
Karag
¨
ozo
˘
glu, 2009) use a systematic approach
to designing a fuzzy inference system based on a
class of neural networks to assess student achieve-
ment. The developed method uses a fuzzy system,
supplemented by neural networks, to enhance some
of its characteristics, such as flexibility, speed,
and adaptability, called the adaptive neuro-fuzzy
inference system (ANFIS). The results of the ANFIS
model are as reliable as statistical methods, but they
encourage a more natural way of interpreting student
AET 2021 - Myroslav I. Zhaldak Symposium on Advances in Educational Technology
182

learning outcomes.
In comparison with these works, this study fills a
gap in the methods of a comprehensive assessment of
the quality of educational programs and educational
activities based on a neuro-fuzzy approach.
1.2 Methods
In this study, methods of mathematical modeling and
computational experiment based on statistical pro-
cessing of data assessments of the quality of ed-
ucational programs and educational activities were
used. The essence of the methodology of mathemat-
ical modeling is to replace the original object with
its mathematical model and study it with the help of
computer technology. Processing, analysis, and in-
terpretation of calculation results were carried out by
constant comparison with the results of statistical pro-
cessing of expert estimates. In the course of the re-
search, refinements were made and the mathematical
model was revised and the cycle of the computational
experiment was repeated.
The methodology for assessing the quality of the
curriculum and educational activities is built using
methods and tools of artificial intelligence, imple-
mented in the package Fuzzy Logic Toolbox system
MATLAB in the form of adaptive neuro-fuzzy output
ANFIS.
A fuzzy inference system can be represented as a
neuro-fuzzy network – a neural network of direct sig-
nal propagation of a special type, or ANFIS-model.
The architecture of a neuro-fuzzy network is isomor-
phic to a fuzzy knowledge base. Neuro-fuzzy net-
works use differentiated implementations of triangu-
lar norms (multiplication and probabilistic OR), as
well as smooth membership functions. This makes it
possible to use fast algorithms for training neural net-
works based on the backpropagation method to tune
neuro-fuzzy networks.
ANFIS implements the Sugeno fuzzy inference
system through a five-layer feed-forward neural net-
work. Purpose of network layers:
• first layer – terms of input variables;
• the second layer – antecedents (parcels) of fuzzy
rules;
• the third layer is the normalization of the degree
of implementation of the rules;
• the fourth layer is the conclusion of the rules;
• fifth layer – aggregation of the result obtained ac-
cording to different rules.
The network inputs are not allocated to a separate
layer. Figure 1 shows an ANFIS network with two
input variables (x
1
and x
2
) and four fuzzy rules. Three
terms are used for the linguistic evaluation of the input
variable, and two terms for the variable.
Figure 1: An example of an ANFIS network.
We will use the following notation:
• x
1
, x
2
, ..., x
n
– network inputs;
• y – network output;
• R
r
: if x
1
= a
1,r
, ..., x
n
= a
n,r
it y = b
0,r
+ b
1,r
x
1
+
... + b
n,r
x
n
is a fuzzy rule with a serial number r;
• m – number of rules r = 1, m,
• a
i,r
– fuzzy term with a membership function
µ
r
(x
i
) used for linguistic evaluation of a variable
x
i
in the r-th rule (r = 1, m, i = 1, n);
• b
q,r
are the conclusion coefficients of the r-th rule
(r = 1, m, q = 0, n).
ANFIS-network works as follows.
Layer 1. Each node of the first layer represents
one term with a bell membership function. The in-
puts of the network are connected only to their terms.
The number of nodes in the first layer is equal to the
sum of the cardinalities of the term set of input vari-
ables. The degree of belonging of the value of the
input variable to the corresponding fuzzy term is fed
to the output of the node:
µ
r
(x
i
) =
1
1 +
x
i
−c
a
2b
, (1)
where a, b and c are membership function parameters
that can be tuned.
Layer 2. The number of nodes in the second layer
is m. Each node of this layer corresponds to one fuzzy
rule. The node of the second layer is connected to the
nodes of the first layer, which form the antecedents
of the corresponding rule. Therefore, each node of
the second layer can receive from 1 to n signals. The
output of the node is the degree of execution of the
rule, calculated as the product of the input signals.
Let us denote the outputs of the nodes of this layer as
τ
r
, r = 1, m.
Layer 3. The number of nodes in the third layer is
also m. Each node of this layer calculates the relative
level of execution of the fuzzy rule according to the
formula:
τ
∗
r
=
τ
r
∑
m
j=1
τ
j
. (2)
Methodology for Assessing the Quality of an Educational Program and Educational Activities of a Higher Education Institution Using a
Neural Network
183

Layer 4. The number of nodes in the fourth layer
is also m. Each node is connected to one node of the
third layer, as well as to all inputs of the network (fig-
ure 1 connections to the inputs are not shown). The
node of the fourth layer calculates the contribution of
one fuzzy rule to the network output by the formula:
y
r
= τ
∗
r
(b
0,r
+ b
1,r
x
1
+ ... + b
n,r
x
n
). (3)
Layer 5. A single node of this layer sums up the
contributions of all rules:
y = y
1
+ ... + y
r
+ ... + y
m
. (4)
Typical neural network training procedures can be
applied to tune an ANFIS network, as it uses only
differentiated features. It is common to use a com-
bination of gradient descent as a backpropagation
algorithm and the least-squares method. The error
backpropagation algorithm regulates the parameters
of rule antecedents, that is, membership functions.
The least-squares method evaluates the rule inference
coefficients since they are linearly related to the net-
work output.
Each iteration of the tuning procedure is per-
formed in two steps.
In the first stage, a training sample is fed to the
inputs, and, based on the discrepancy between the de-
sired and actual behavior of the network, the optimal
parameters of the nodes of the fourth layer are deter-
mined using the least-squares method.
In the second stage, the residual mismatch is trans-
mitted from the network output to the inputs, and the
parameters of the nodes of the first layer are modified
by the backpropagation of the error. At the same time,
the rule inference coefficients found at the previous
stage do not change. The iterative tuning procedure
continues as long as the mismatch exceeds a prede-
termined value. To tune the membership functions, in
addition to the error backpropagation method, other
optimization algorithms can be used, for example, the
Levenberg-Marquardt method.
The ANFIS editor in Matlab allows you to auto-
matically synthesize a neuro-fuzzy network from ex-
perimental data. In this case, the accessories of the
synthesized systems are tuned (trained) in such a way
as to minimize the deviations between the results of
fuzzy modeling and experimental data. The ANFIS
editor is loaded using the anfisedit command.
The ANFIS editor contains 3 top menus – File,
Edit and View, visualization area, ANFIS properties
area, data loading area, source fuzzy inference system
generation area, training area, testing area, current in-
formation output area, as well as Help and Close but-
tons, which allows you to call the help window and
close the ANFIS editor, respectively.
Participants in the experiment – full-time master’s
students (22 people) and graduates of higher educa-
tion institutions of the previous term of study are the
same specialties (32 people) – a total of 54 people.
This number of respondents is due to the number of
indicators of quality criteria because the data format
of the artificial network in MATLAB supports square
matrices, in this case, 54x54. Before the accredi-
tation examination, students were offered question-
naires with a proposal to assess the quality of the edu-
cational program and educational activities of the spe-
cialty on an assessment scale covering four levels: F,
E, B, A. Student assessments were used to form the
vector of artificial neural network inputs. After the ac-
creditation examination, the expert assessments were
used to check the quality of the prediction of the arti-
ficial neural network.
The experience of European countries demon-
strates the expediency of involving students in accred-
itation examination. For example, the Polish Accred-
itation Commission consists of 80 – 90 members ap-
pointed by the Minister of Science and Higher Educa-
tion among the candidates nominated by the Senates
of higher education institutions, the conferences of
rectors of scientific schools and universities in Poland,
the Parliament of Students of Poland (the President
of the Student Parliament is a member of the Polish
Accreditation Commission). In Slovakia, Academic
Ranking and Rating Agency is a civic association
founded in 2004 on the initiative of former student
leaders and academics. The Slovenian Quality Assur-
ance Agency for Higher Education SQAA-NAKVIS
(Slovenian Quality Assurance Agency for Higher Ed-
ucation) appoints at least three members of each ex-
pert group, of which at least one foreign expert, an
expert in the field of quality assessment of higher ed-
ucation and one representative from among students)
and others (Tryhub, 2016).
To ensure the representativeness of the sample, the
study of its design was carried out based on random-
ization. The decision on the statistical deviation of the
null hypothesis regarding the differences between the
averages, thus, was also associated with the procedure
of random sampling.
The rating scale covers four levels of compliance
by the requirements of the legislation (F, E, B, A)
(Verkhovna Rada of Ukraine, 2019). Also, the leg-
islation establishes 10 criteria for assessing the qual-
ity of the educational program (Verkhovna Rada of
Ukraine, 2019):
1) design and objectives of the educational program
(4);
2) structure and content of the educational program
(9);
AET 2021 - Myroslav I. Zhaldak Symposium on Advances in Educational Technology
184

3) access to the educational program and recognition
of learning outcomes (4);
4) teaching and learning according to the educational
program (5);
5) control measures, evaluation of applicants for
higher education and academic integrity (4);
6) human resources (6);
7) educational environment and material resources
(6);
8) internal quality assurance of the educational pro-
gram (7);
9) transparency and publicity (3);
10) learning through research (6).
In turn, each of these criteria has from 3 to 9 in-
dicators (the number is indicated in parentheses). To-
gether, all 10 criteria contain 54 indicators.
2 RESULTS
At the first stage of the study, the collection and sta-
tistical processing of data on the results of the as-
sessment of students and graduates of higher educa-
tion educational programs and educational activities
on the educational program for each criterion.
In the second stage, a computational experiment
was performed. The cycle of the computational ex-
periment was carried out in several stages:
1) the choice of approximation and mathematical
formulation of the problem (construction of a
mathematical model of the phenomenon under
study);
2) development of a computational algorithm for
solving the problem;
3) implementation of the algorithm in the form of a
program for the PC;
4) settlements on the PC;
5) processing, analysis and interpretation of calcula-
tion results, comparison with the results of statis-
tical processing of expert estimates and, if neces-
sary, refinement or revision of the mathematical
model, i.e. return to the first stage and repeat the
cycle of the computational experiment.
Assessing the quality of the curriculum and learn-
ing activities is complicated by the fact that each of
the 10 criteria, in turn, consists of several indica-
tors (3-9) and is due to many factors, possibly with
an unknown nature of influence, which is also non-
numerical. To assess the quality of the curriculum and
training activities, it is proposed to use a two-tier sys-
tem based on the ANFIS package and artificial neural
networks to predict assessment scores.
The ANFIS hybrid system is a combination of the
Sugeno neuro-fuzzy inference method with the ability
to train a five-layer artificial neural network (ANN) of
direct propagation with a single output and multiple
inputs, which are fuzzy linguistic variables. As input
variables of the ANFIS system, we use the criteria for
evaluating the quality of the educational program of
10 groups of factors V
i
(i = 1, ..., 10).
The output variable of the ANFIS system is a nu-
merical assessment of the quality of the curriculum
and training activities and is defined as a function
y = f (V
1
,V
2
,V
3
,V
4
,V
5
,V
6
,V
7
,V
8
,V
9
,V
1
0).
Layer 1 of the ANFIS system for the linguistic
evaluation of input parameters uses the term set of
all possible values of the linguistic variable. A
V i
=
{“F”, “E”, “B”, “A”}. In symbolic form we write:
A
V i
= {F < i >, E < i >, B < i >, A < i >}. The term
set of the original linguistic variable y is the set of
values of quality assessments of the curriculum and
educational activities: T
y
= {F, E, B, A}. The outputs
of the nodes of layer 1 are the values of the member-
ship functions at specific values of the input variables.
Layer 2 is non-adaptive and defines the precondi-
tions of fuzzy production rules. Production rules –
a form of representation of human knowledge in the
form of a sentence type – if (condition), then (action).
The rules provide a formal way to present recommen-
dations, guidance, or strategies. They are ideal in
cases where the knowledge of the subject area arises
from the empirical associations accumulated during
the work on solving problems in a particular field.
Each node of this layer is connected to those nodes
of layer 1, which form the prerequisites of the cor-
responding rule. To solve this problem, four fuzzy
production rules are formulated: P = {p
1
, p
2
, p
3
, p
4
},
because according to the features of the ANFIS net-
work, the number of network rules must correspond
to the dimension of the term set of the source variable
y.
Nodes perform a fuzzy logical operation “I”
(min). The outputs of the nodes of this layer are the
degree of truth (fulfillment) of the preconditions of
each of the four fuzzy production rules, which are cal-
culated by the formulas:
w
1
= min(µ
F1
(V
1
), µ
F2
(V
2
), µ
F3
(V
3
), µ
F4
(V
4
))
w
2
= min(µ
E1
(V
1
), µ
E2
(V
2
), µ
E3
(V
3
), µ
E4
(V
4
))
w
3
= min(µ
B1
(V
1
), µ
B2
(V
2
), µ
B3
(V
3
), µ
B4
(V
4
))
w
4
= min(µ
A1
(V
1
), µ
A2
(V
2
), µ
A3
(V
3
), µ
A4
(V
4
))
.
(5)
Layer 3 normalizes the degree of implementation
of each of the fuzzy production rules (calculation of
Methodology for Assessing the Quality of an Educational Program and Educational Activities of a Higher Education Institution Using a
Neural Network
185

the relative degree of implementation of the rules) as
follows:
w
h
=
w
h
h
∑
i=1
w
i
, (6)
where h = 1, ..., 4 is production rule number. Layer 4
calculates the contribution of each fuzzy production
rule to the output of the network according to the for-
mula.
y
h
(v,V) = w
h
(v
(0)
h
+ v
(1)
h
V
1
+ v
(2)
h
V
2
+ v
(3)
h
V
3
+
+ v
(4)
h
V
4
+ v
(5)
h
V
5
),
(7)
where v
(0)
h
– coefficients of the initial function (i =
0, ..., 5).
Layer 5 summarizes the contributions of all the
rules:
y =
4
∑
i=1
y
i
. (8)
Training of the ANFIS network was carried out
for 24 epochs by a hybrid method. During training,
the type of membership functions, the type of initial
function, and their coefficients are selected. As a re-
sult of training a fuzzy network for four rules, Gaus-
sian functions were adopted as membership functions,
and a linear function was adopted as the initial func-
tion. As a result of training, membership functions
and their coefficients were also obtained.
To assess each of the 10 groups of factors that
affect the quality of the curriculum and educational
activities by the evaluation criteria, 10 modules are
used, which are implemented using artificial neural
networks. Thus, it is necessary to design neural net-
works, a mathematical model of a comprehensive as-
sessment of the quality of the educational program
and educational activities based on the methods of the
neuro-fuzzy approach. For this purpose, the Neural
Network Toolbox was used. To form neural networks,
it is necessary to determine their topology, learning
mechanism, and testing procedure. Also, the training
of an artificial neural network requires input data –
a sample of answers of students and graduates with
reliable quality indicators, determined based on these
criteria.
A standard L-layer feedforward neural network
consists of a layer of input nodes (we will stick to
the position that it is not contained in the network as
an independent layer), (L − 1) hidden layers, and an
output layer that is connected in series in the forward
direction and does not contain a connection between
elements within a layer and feedback between layers.
The most popular class of multilayer feed-forward
networks is formed by multilayer perceptrons, where
each computational element uses a limit or sigmoidal
activation function. A multilayer perceptron can form
arbitrarily complex decision limits and implement ar-
bitrary Boolean functions. The development of a
backpropagation algorithm for determining weights
in a multilayer perceptron has made these networks
the most popular among researchers and users of neu-
ral networks. The vast majority of programs involve
the use of such multilayer perceptrons. Networks con-
sisting of successive layers of neurons are more com-
monly used. Although any network without feedback
can be represented as successive layers, the presence
of many neurons in each layer can significantly speed
up calculations using matrix accelerators.
The popularity of perceptrons is due to a wide
range of available tasks that can be solved with their
help. In the general case, they solve the problem
of approximating multidimensional functions, that is,
constructing a multidimensional mapping F : x ⇒ y
that generalizes a given set of parameters {x
α
⇒ y
α
}.
Depending on the type of output variables (the
type of input variables is not critical), the approxima-
tion of functions can take the form of classification
(discrete set of initial values), or regression (continu-
ous initial values).
Many practical problems of pattern recognition,
noise filtering, time series prediction, etc. come down
to basic settings. The reason for the popularity of
perceptrons is that, for their range of tasks, they are,
firstly, universal, and secondly, they are efficient in
terms of the computational complexity of devices.
As a result of the development of neurocomput-
ing, a large number of efficient models of neural net-
works have been created, focused on solving various
problems. Due to this, artificial neural networks are
successfully used to solve a wide class of practical
problems. Therefore, when solving a specific prob-
lem, it is necessary to solve the issue of choosing the
most appropriate neural network model, its parame-
ters, and the training method.
Typically, a network consists of many sensor ele-
ments (input nodes or source nodes) that form an in-
put layer; one or more hidden layers of computational
neurons, and one output layer of neurons. The input
signal propagates through the network in a forward di-
rection from layer to layer. Such networks are usually
called multilayer perceptrons. They are a generaliza-
tion of a single layer perceptron.
Multilayer perceptrons are successfully used to
solve various problems. At the same time, supervised
learning is performed using such a popular algorithm
as the error back-propagation algorithm. This method
consists of error correction (error-correction learning
rule). It can be thought of as a generalization of the
equally popular adaptive filtering algorithm, the mean
AET 2021 - Myroslav I. Zhaldak Symposium on Advances in Educational Technology
186

squared error minimization (LMS) algorithm.
Multilayer perceptrons have three characteristic
features.
1. Each neuron of the network has a non-linear ac-
tivation function. It should be noted that this
non-linear function is smooth (that is, differenti-
ated everywhere), in contrast to the hard threshold
function used in the Rosenblatt perceptron. The
most popular form of a function that satisfies this
requirement is the sigmoidal nonlinearity, defined
by the logistic function
y
i
=
1
1 + exp(−v
j
)
, (9)
where v
j
is the induced local field (i.e., the
weighted sum of all synaptic inputs plus the limit
value) of neuron j; y
j
is the output of the neuron.
The presence of non-linearity plays a very impor-
tant role, since otherwise the “input-output” map-
ping of the network can be reduced to a conven-
tional single-layer perceptron. Moreover, the use
of the logistic function is biologically motivated,
since it takes into account the recovery phase of a
real neuron.
2. The network contains one or more layers of hid-
den neurons that are not part of the input or output
of the network. These neurons allow the network
to learn how to solve complex problems by se-
quentially extracting the most important features
of the input image (vector).
The network has a high degree of connectivity
(connectivity), implemented using synaptic connec-
tions. Changing the level of network connectivity re-
quires changing the plurality of synaptic connections
or their weights.
The combination of all these properties, along
with learning-by-doing, provides the computational
power of a multilayer perceptron. However, these
same qualities are the reason for the incompleteness
of modern knowledge about the behavior of such
networks. First, the distributed form of nonlinear-
ity and the high connectivity of the network signif-
icantly complicate the theoretical analysis of a mul-
tilayer perceptron. Second, the presence of hidden
neurons makes the learning process more difficult to
visualize. It is in the learning process that it is nec-
essary to determine which signs of the input signal
should be given by hidden neurons. Then the learning
process becomes even more difficult, since the search
must be performed in a wide range of possible func-
tions, and the choice must be made among alternative
representations of the input images.
The emergence of the backpropagation algorithm
was a landmark event in the development of neural
networks, since it implements a computationally effi-
cient method for training a multilayer perceptron. The
backpropagation algorithm does not offer a truly op-
timal solution to all potential problems, but it is most
effective in learning multilayer machines.
An artificial neural network for the analysis of in-
dicators of the quality of the educational program and
educational activities will have the number of input
neurons (according to the number of indicators for all
criteria) 54; output neurons – 54. Input signals were
determined based on students’ assessments of each in-
dicator of this quality criterion, while the scale F, E,
B, A were translated into numerical 1; 2; 3; 4 respec-
tively. Part of the data is given in table 1.
Table 1: Input signals (T) based on students’ assessments of
quality criteria.
Indicators of Student grades
quality criteria 1 2 3 4 5 6 7 ... 54
1 3 4 3 3 4 3 4 . . . 4
2 4 3 3 3 4 3 3 . . . 4
3 3 3 4 3 4 4 3 . . . 4
. . . . . . . . . . . . . . . . . . . . . . . . . . . . . .
54 4 3 3 3 4 3 3 . . . 4
It is important that the neural network can pre-
dict expert assessments if student and graduate assess-
ments are to be ranked in ascending order based on the
determination of the grade point average. According
to the hypothesis, we assume that students with higher
academic performance are better acquainted with the
goals, structure, and content of the educational pro-
gram, the process and characteristics of teaching and
learning according to the educational program, con-
trol measures, assessment system, and all other as-
pects of educational activities. assessments of the
quality of the educational program and educational
activities will be more objective.
The Neural Network Toolbox application package
Matlab Mathematical Modeling Environment (ver-
sion R2014a) was used in the work. After starting
the Matlab system, enter the nntool command on the
command line, which opens the window for entering
data and creating a neural network (Neural Network /
Data Manager) (figure 2).
After starting the MATLAB system, you need to
enter the tool command on the command line, which
will open the window for entering data and creating
a neural network (Neural Network / Data Manager).
Clicking the New button opens the Create Network
or Data window. After selecting the Data tab in the
Name field you must enter a new name of the input
data “P”, and in the Value field the values of the in-
put data, in which the numbers 1-54 are indicators of
Methodology for Assessing the Quality of an Educational Program and Educational Activities of a Higher Education Institution Using a
Neural Network
187

Figure 2: Data entry and neural network creation windows.
quality criteria, and 55-108 – students’ and graduates’
indicators quality criteria.
To create a new network, we chose New, to view
the data you need to select Import. The data is con-
tained in the P.mat file. This file is a matrix of two
lines, in which the numbers 1-54 are indicators of
quality criteria, and 55-108 – are the evaluation of stu-
dents and graduates on the indicators of quality crite-
ria. Its contents are stored in the P.txt file.
The next step is to import the data (figure 3).
The next step was to create data (“T”) – goals,
which are an array of size 54x54, which contains in-
formation about the grades given by the participants
of the experiment – full-time master’s students (22
people) and graduates of higher education institutions
there are specialties (32 people) – a total of 54 peo-
ple. This number of respondents is due to the number
of indicators of quality criteria because the data for-
mat of the artificial network in Matlab supports square
matrices, in this case, 54x54. The data is stored in a
T.mat file. Its contents can be viewed using a text ed-
itor.
We import data in the same way as for the array P.
In the next step, a neural network was created (fig-
ure 4). An artificial neural network for the analysis of
indicators of the quality of the educational program
and educational activities will have the number of in-
put neurons (according to the number of indicators
for all criteria) 54; output neurons – 54. Input sig-
nals were determined based on students’ assessments
for each indicator of this quality criterion, while the
scales F, E, B, A were converted to numerical 1; 2; 3;
4 respectively.
The configuration of the neural network of direct
propagation is chosen based on a heuristic rule: the
number of neurons of the hidden layer is equal to half
of the total number of input and output neurons. The
artificial neural network for the analysis of quality in-
dicators of the educational program and educational
activity will have the number of input neurons 2 (ac-
cording to the dimensionality of the data – indicators
of quality criteria and student evaluation); source neu-
rons 54, therefore, the number of hidden neurons is
28. The View button allows you to view the network
structure (figure 5).
In our case, 2 is the number of input neurons,
which is known to be selected based on the dimension
of the input data (1 – indicators of quality criteria; 2
– student assessments). Output neurons – 54. The
configuration of the neural network of direct propaga-
tion (feed-forward backdrop) is chosen based on the
heuristic rule: the number of neurons in the hidden
layer is equal to half the total number of input and
output neurons, so the hidden layer has 28 neurons.
The next stage is network training and coaching.
Double-clicking with the left mouse button on the cre-
ated neural network network1 in the window of the
Neural Network / Data Manager opens a window with
the network.
The View tab presents the neural network itself.
Go to the Reinitialize Weights tab, where the Input
Ranges column selects the P input from the Get from
AET 2021 - Myroslav I. Zhaldak Symposium on Advances in Educational Technology
188
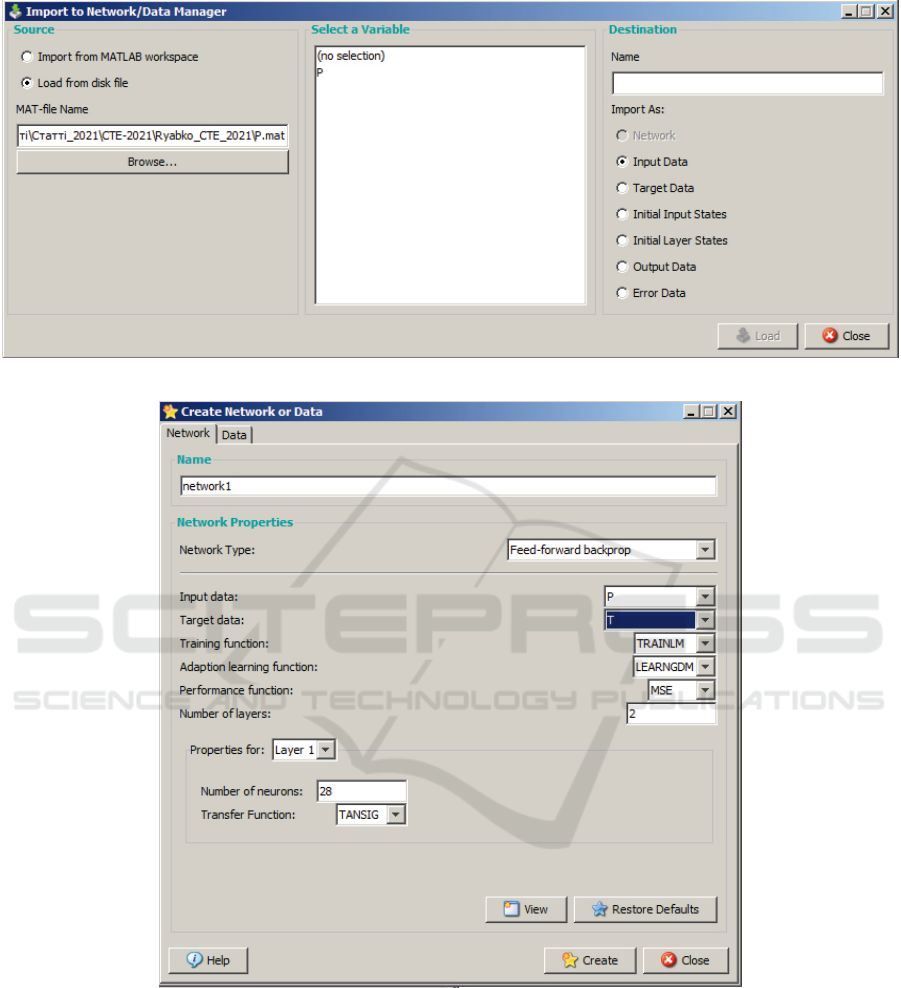
Figure 3: Importing data.
Figure 4: Creating a neural network.
the input list. Then press the Set Input Ranges and
Initialize Weights buttons in succession allowing us
to initialize the scales needed to initialize the entire
network.
The next step is network learning.
Learning the backpropagation method involves
two passes through all layers of the network: forward
and backward. In a forward pass, the image (incom-
ing vector) is fed to the sensor nodes of the network,
after which it propagates through the network from
layer to layer. As a result, a set of output signals is
generated, which is the actual response of the net-
work to a given input image. In forward traversal, all
synaptic weights of the network are fixed. In a back-
ward pass, all synaptic weights are adjusted accord-
ing to the error correction rule, namely: the actual
output of the network is subtracted from the desired
(target) response, resulting in an error signal. This
Methodology for Assessing the Quality of an Educational Program and Educational Activities of a Higher Education Institution Using a
Neural Network
189
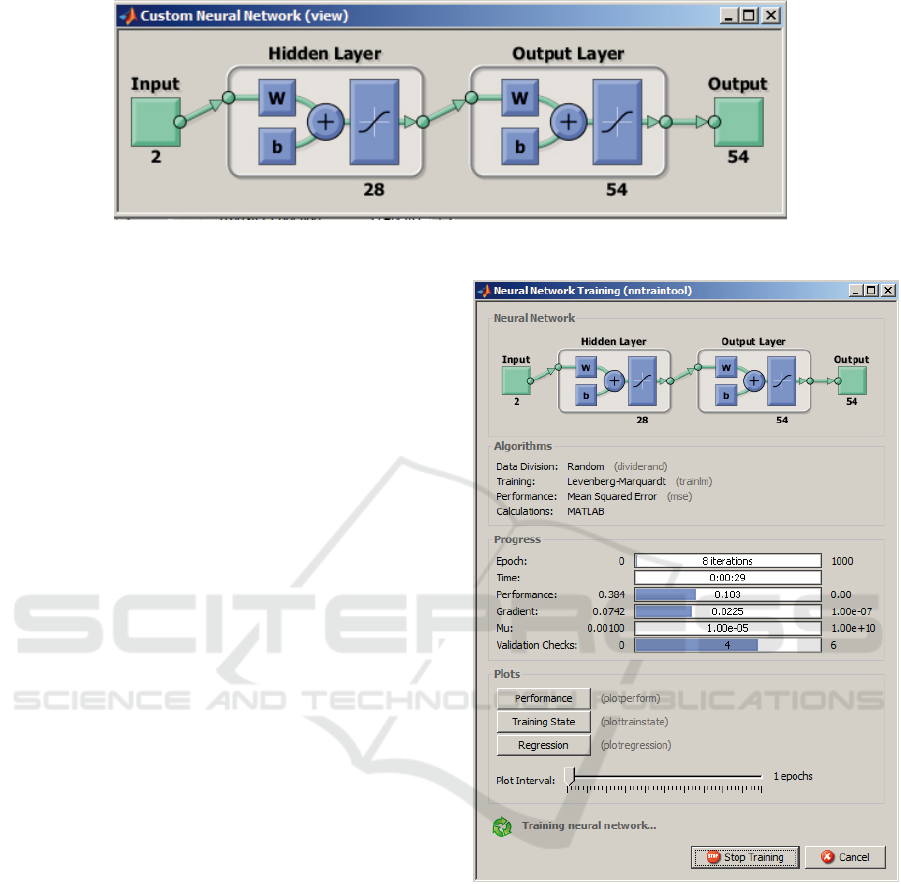
Figure 5: The structure of the neural network.
signal subsequently propagates through the network
in the opposite direction of the synaptic connections.
Hence the name – backpropagation algorithm. The
synaptic weights are tuned to bring the network out-
put as close as possible to the desired statistical mean-
ing. The back-propagation algorithm is sometimes
referred to as the simplified back-propagation algo-
rithm. The learning process using this algorithm is
called back-propagation learning.
Going to the Train tab opens a learning window
in which P and T are selected instead of input data
and targets, respectively (figure 6). On the right of
the Training Results column, you need to change the
name of the Outputs and Errors to O and E, respec-
tively. Then pressing the Train Network button will
start network training, the process of which can be ob-
served in the Neural Network Training window. You
can close the window after graduation.
After the training was completed, two types of
data appeared in the Neural Network / Data Man-
ager window: Output Data (O) and Error Data (E).
Double-clicking on data O opens a window with data
output. By clicking the Export button in the man-
ager window, and then clicking Export again in the
window that opens, you can transfer the data to the
Matlab workspace, where it will be presented in the
most presentable form. You can view the results in
the O.mat and E.mat files.
You can calculate that the average network error is
0.0321, which indicates the efficiency of the system.
After learning the network, you can proceed to
data forecasting. Returning to the Neural Network /
Data Manager window, you need to create additional
input by clicking the New button. Going to the Data
tab, the name of the data changes, for example, to P1,
and the values are set as follows: values 1-54 still in-
dicate the numbers of indicators of quality criteria of
educational programs and educational activities, and
56-109 assessments of students and graduates quality,
and the last column – projected expert assessments.
Next, you need to return to the Network window.
In the Simulate tab of the input values house, the P1
Figure 6: Neural network learning.
array is selected, and the Outputs output value is re-
named to forecast (figure 7).
After clicking the Simulate Network button, you
can return to the Neural Network / Data Manager
window and, by clicking the Export button, copy the
source forecast array to the Matlab workspace. After
receiving the table in the workspace, pay attention to
the last column, which is responsible for forecasting
(figure 8).
The data obtained in the study can be viewed in
the forecast.mat file.
Comparing the data issued by the system and the
real data, we can see that the neural network does
make predictions that are quite close to reality. Com-
AET 2021 - Myroslav I. Zhaldak Symposium on Advances in Educational Technology
190
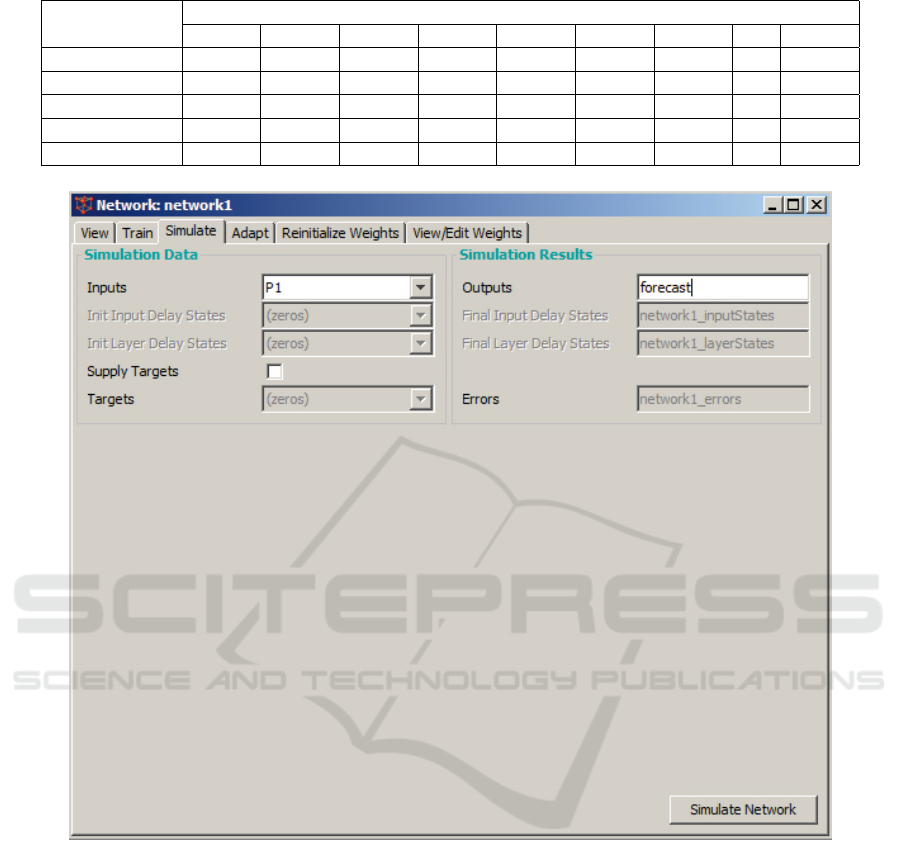
Table 2: Output signals (O).
Indicators of Student grades
quality criteria 1 2 3 4 5 6 7 ... 54
1 3.1985 3.252 3.3058 3.3541 3.3933 3.4235 3.4475 . . . 3.9704
2 3.4521 3.3478 3.2644 3.2035 3.1633 3.1404 3.1319 . . . 3.9997
3 3.1516 3.1812 3.219 3.2627 3.3062 3.3417 3.3638 . . . 3.9992
. . . . . . . . . . . . . . . . . . . . . . . . . . . . . .
54 4 3.4192 3.3522 3.3128 3.291 3.2798 3.2756 . . . 3.9716
Figure 7: Simulate.
pared with expert estimates, the average absolute er-
ror is 0.0321, the relative error is 7.08%.
In the second part of the experiment, forecasting
was carried out using a different type of neural net-
work – a neuro-fuzzy network, or ANFIS-model.
Expert estimates are used as validation data. Cre-
ate data files: training.dat, testing.dat, checking.dat.
It should be noted that attempts to consider large data
volumes lead to a reduction in the number of ob-
servations in the training sample and its simultane-
ous unjustified growth, which can negatively affect
the network’s ability to learn. So, first you need to
turn the available information into a form that is un-
derstandable and meaningful for the neuro-fuzzy net-
work. Consider the average value of the assessment
of each of the 10 criteria for assessing the quality of
the educational program. For training, we use the av-
erage scores of all students for each of the 10 criteria.
For testing, the marks of students numbered from 12
to 30 are used, for verification – the marks that were
put by 31 students.
We preliminarily transpose the data, so the num-
bers of students will be in the rows, and the grades ac-
cording to the quality criteria will be in the columns.
The data in the files contains 10 columns – 9 grades
(incoming) and 1 grade (source). The first file con-
tains 54 lines and 10 columns. The second has 18
rows and 10 columns. The third has one row and 10
Methodology for Assessing the Quality of an Educational Program and Educational Activities of a Higher Education Institution Using a
Neural Network
191
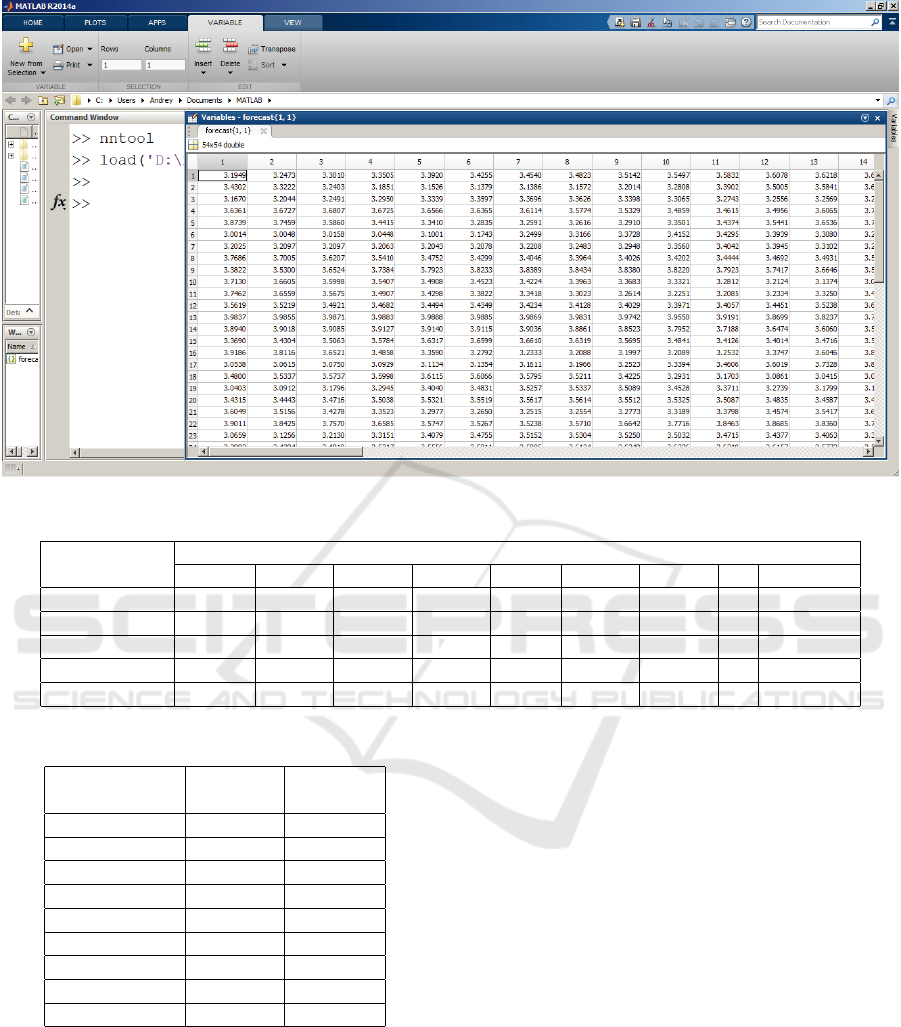
Figure 8: Getting a table with forecasting in the work area.
Table 3: Errors (E).
Indicators of Student grades
quality criteria 1 2 3 4 5 6 7 ... 54
1 -0.199 0.748 -0.306 -0.354 0.607 -0.424 0.552 . . . 0.0000237
2 0.548 -0.348 -0.264 -0.203 0.837 -0.140 -0.132 . . . 0.029607
3 -0.152 -0.181 0.781 -0.263 0.694 0.658 -0.364 . . . 0.00027
. . . . . . . . . . . . . . . . . . . . . . . . . . . . . .
54 0.58076 -0.3522 -0.3128 -0.2909 0.7202 -0.2755 -0.2769 . . . 0.028442
Table 4: Neural network forecast and expert evaluation.
Indicators of Forecast Estimates
quality criteria
1 3.999977 4
2 3.974844 4
3 3.999750 4
4 3.999379 3
5 3.956661 4
6 3.991731 4
7 3.985698 4
. . . . . . . . .
54 3.970182 4
columns.
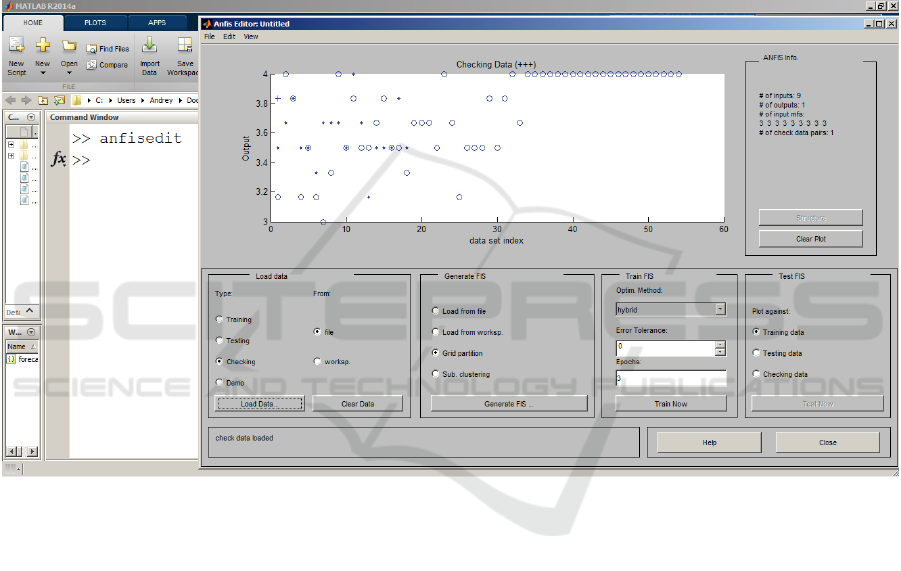
Anfis Editor is used to building MATLAB fuzzy
neural networks. Run the editor with the anfisedit
command. In the Load data menu, select Training,
and From disk, click the load data button. In the win-
dow that opens, select the previously created train-
ing.dat file. In the Load data menu, select Testing and
From disk, click the load data button. In the window
that opens, select the previously created testing.dat.
In the Load data menu, select Checking and From
disk, and click the load data button. In the window
that opens, select the previously created checking.dat.
The visualization area contains two types of informa-
tion: when training the system, the learning curve in
the form of a graph of the dependence of the learning
error on the iteration ordinal number; when loading
data and testing the system – experimental data and
simulation results.
Experimental data and simulation results are dis-
played as a set of points in two-dimensional space. In
this case, the serial number of the data line in the sam-
ple (training, test, or control) is plotted along the ab-
scissa axis, and the value of the initial variable of this
sample line is plotted along the ordinate axis. The fol-
lowing markers are used: blue dot (.) – test set; blue
circle (o) – training sample; blue plus (+) – control
sample; a red asterisk (*) – simulation results.
Then, having set the Generate FIS menu switch
to the Grid partition position, you should press the
Generate FIS button. In this case, the model has 10
input variables, each of which corresponds to 9 terms
AET 2021 - Myroslav I. Zhaldak Symposium on Advances in Educational Technology
192
Training.dat file (first three lines):
3.5000 3.3333 3.5000 3.4000 3.5000 3.3333 3.3333 3.5714 3.3333 3.1667
4.0000 3.4444 3.2500 3.8000 3.7500 3.5000 3.6667 3.4286 3.6667 4.0000
3.2500 3.6667 3.2500 3.4000 3.5000 3.6667 3.0000 3.5714 4.0000 3.8333
Testing.dat file (first four lines):
3.2500 3.4444 3.7500 3.6000 3.2500 3.8333 3.5000 3.4286 3.6667 3.5000
3.7500 3.6667 4.0000 3.2000 3.5000 3.3333 3.1667 3.8571 3.6667 3.6667
4.0000 3.5556 3.5000 3.6000 3.5000 3.8333 3.5000 3.2857 3.3333 3.8333
3.5000 3.5556 3.2500 3.4000 3.5000 3.6667 3.6667 3.5714 4.0000 3.5000
Checking.dat file:
3.5000 3.3333 3.2500 3.4000 4.0000 3.3333 3.8333 3.2857 3.0000 3.8333
Figure 9: Data for network training and validation.
of the gaussmf type. The original variable is deter-
mined by a linear function. Let’s generate a Sugeno-
type fuzzy inference system by pressing the Generate
FIS button. In the window that opens, set 3 mem-
bership functions of the gaussmf type for each input
variable. The choice of the property function here is
because we assume a normal distribution for a random
variable, defined by a Gaussian function according to
probability theory. For the output variable, we set the
membership function const.
To train the hybrid network, we will choose the
backdrop method (error backpropagation) with an er-
ror level of 0 and a number of cycles of 10. Let’s start
training the hybrid network (figure 10).
As can be seen from figure 10, according to the
training results, the average error is approximately
0.007.
We test the fuzzy inference system first on the
training set.
Now let’s test the resulting fuzzy inference sys-
tem on the known values of expert estimates. Now
we download this sample in testing mode in the Anfis
editor. The results are shown in Figure 12. The mean
score of the experts is 3.99; network prediction of the
neural fuzzy network is 3.51. The relative forecast
error is 12.57%.
Comparing the prediction errors of the neuro-
fuzzy network (12.57%) and the L-layer feed-forward
neural network (7.08%), we can see that the lat-
ter makes a more accurate prediction. It should be
noted that the ANFIS model requires significantly
more computing resources from the computer, which
forced us to reduce the number of input variables to
10, which corresponded to the number of program
Methodology for Assessing the Quality of an Educational Program and Educational Activities of a Higher Education Institution Using a
Neural Network
193
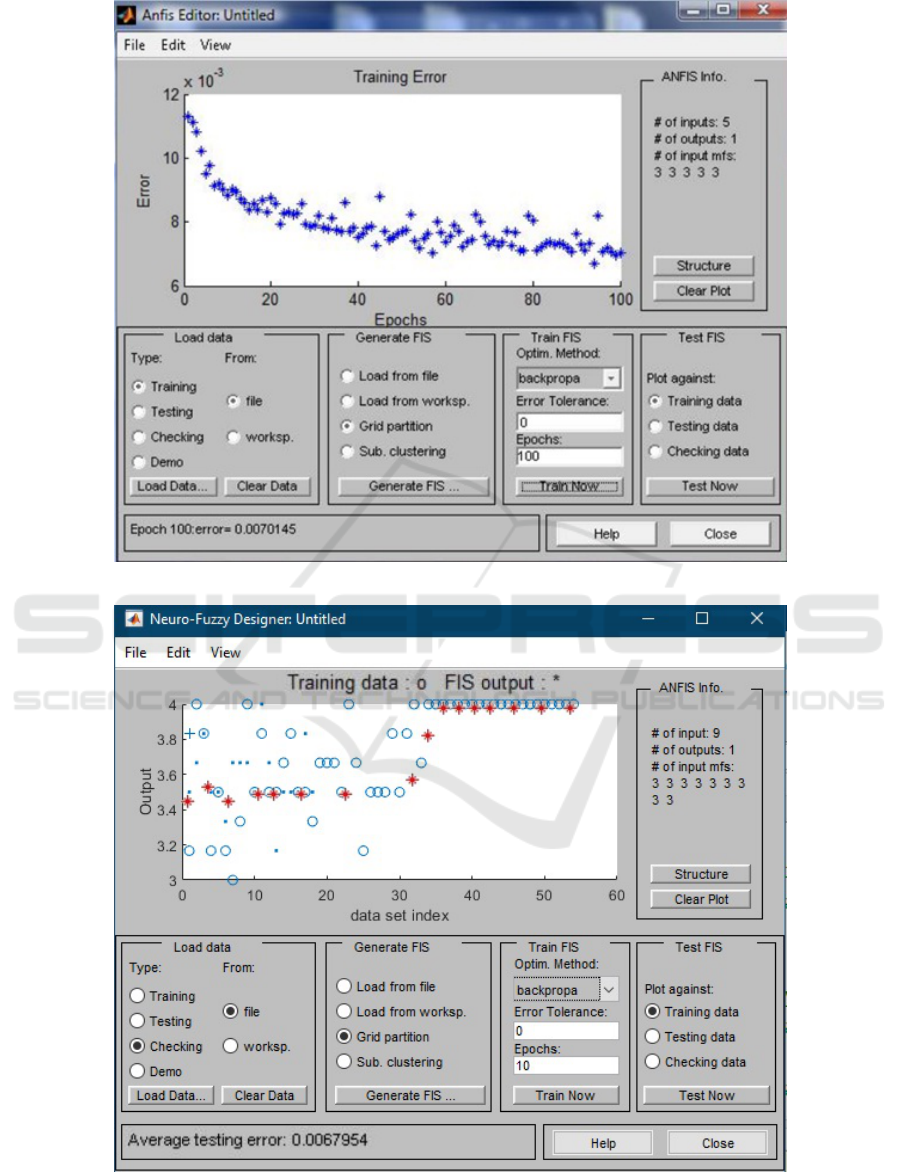
Figure 10: Network training error.
Figure 11: Network training results.
AET 2021 - Myroslav I. Zhaldak Symposium on Advances in Educational Technology
194
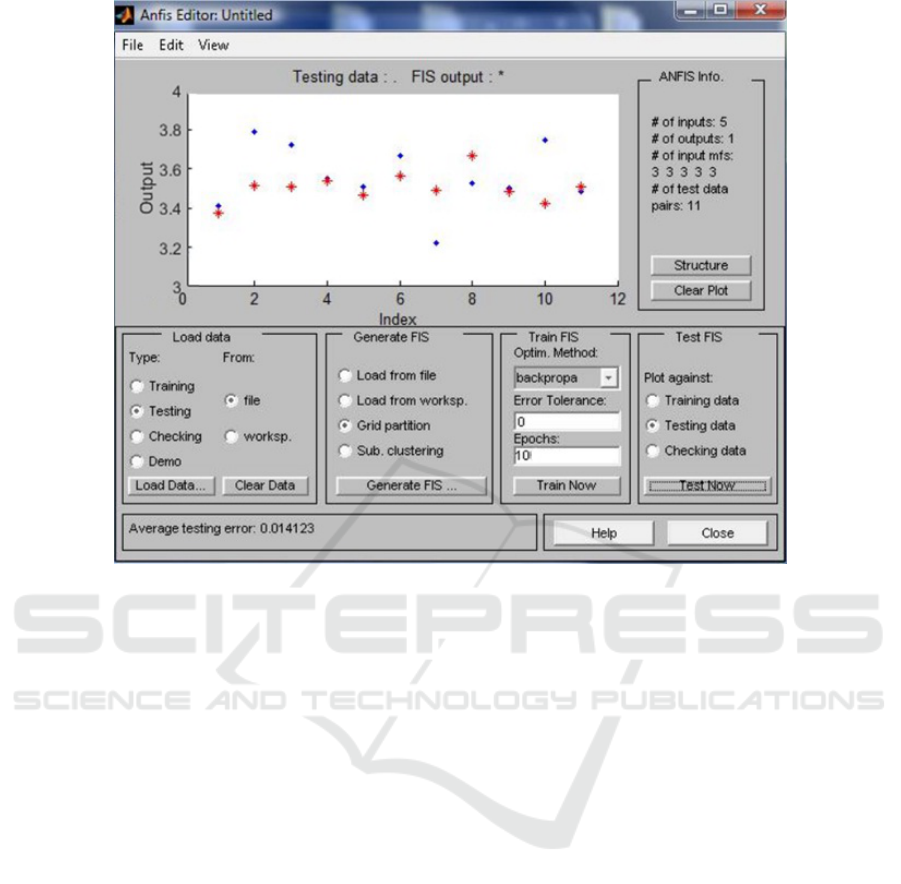
Figure 12: The results of network testing on known values of expert estimates.
evaluation criteria, and use the average values of qual-
ity indicators for each of the criteria. Of course, the
problem requires further study of large data volumes
of other accreditation examinations, but in general,
this approach has demonstrated very good predictive
capabilities.
Table 4 also shows that the quality of the pro-
gram and educational activities is at a fairly high level,
which reflects the average score of the peer review.
3 DISCUSSION
The study aimed to demonstrate the possibility of pre-
dicting the assessment of the quality of educational
programs and educational activities can be adequately
addressed through an artificial neural network and ob-
tain a comprehensive assessment of the quality of ed-
ucational programs and educational activities based
on a possible neuro-fuzzy approach. The mathemat-
ical model involves the use of neural networks and
is based on the technology of analytical processing
of statistical data. Standard methods of mathematical
statistics are used to analyze the estimates received
from respondents.
Debatable are proposals for using students as ex-
perts in the educational program and educational ac-
tivities; it is more appropriate to use teachers from
other educational institutions, but in the process of
preparing for introspection, this approach can be con-
sidered quite appropriate.
The results of the neural network should be con-
sidered not as final, but as a test. As noted, for more
detailed conclusions, it is necessary to train the net-
work on a larger amount of experimental data.
The network structure has room for further im-
provement and customization in future studies.
The assumption that based on a sample of stu-
dents and graduates of higher education the quality
of the educational program and educational activities
can prepare a sample for setting up and teaching ar-
tificial neural networks is confirmed by ordering the
quality of the curriculum of students and graduates.
teaching. In practice, this allows you to predict the re-
sults and identify existing shortcomings and eliminate
them before the accreditation examination. However,
the difficulty of this method is to choose the architec-
ture of the neural network and prepare a training sam-
ple to configure the neural network. In particular, in
the future, it is planned to increase the volume of the
input vector of the artificial neural network, and the
form is based on estimates of teachers, stakeholders,
and experts.
Methodology for Assessing the Quality of an Educational Program and Educational Activities of a Higher Education Institution Using a
Neural Network
195

4 CONCLUSIONS
As a result of a mathematical model of a compre-
hensive evaluation of the quality of educational pro-
grams and educational activities based on the methods
of neuro-fuzzy approach, first managed to work out
a mechanism for obtaining a quantitative evaluation
of educational programs and educational activities in
this program that will allow the institution of higher
education detect shortcomings and potential problems
and solve them before the accreditation examination.
Secondly, based on a sample of students and grad-
uates of higher education to evaluate the quality of
educational programs and educational activities, you
can prepare a training sample for setting up and learn-
ing an artificial neural network that can adequately
perform a comprehensive assessment of educational
programs and educational activities. This can be done
by arranging the assessments of the quality of the cur-
riculum and the educational activities of students and
graduates in ascending order based on the determina-
tion of the average grade point average. It is empha-
sized that these methods are effective provided they
meet the requirements of a student-centered approach
and the principles of academic freedom.
Based on a sample of students and graduates of
higher education, the quality of the educational pro-
gram and educational activities was prepared to pre-
pare a training sample for setting up and teaching ar-
tificial neural network, which was able to adequately
perform a comprehensive assessment of the quality
of educational programs and educational activities. A
comparison of the results of the operation of an ar-
tificial neural network of direct propagation with one
output and several inputs with real data shows that the
neural network does make predictions close to reality.
Compared with expert estimates, the average absolute
error was 0.0321; the relative error was 7.08%.
The results of the study can be used in the prac-
tice of higher education institutions to predict the re-
sults and identify existing shortcomings and eliminate
them before the accreditation examination.
We see prospects for further research in the ap-
plication of software products based on the theory of
neural networks to automate the processes of the or-
ganization, control, and analysis of the educational
process; introduction of neural network software for
direct training of students in certain disciplines.
REFERENCES
Abu Naser, S., Zaqout, I., Abu Ghosh, M., Atallah, R., and
Alajrami, E. (2015). Predicting student performance
using artificial neural network: In the faculty of en-
gineering and information technology. International
Journal of Hybrid Information Technology, 8(2):221–
228. https://doi.org/10.14257/ijhit.2015.8.2.20.
Arsad, P. M., Buniyamin, N., and Manan, J.-l. A. (2013).
A neural network students’ performance prediction
model (NNSPPM). In 2013 IEEE International Con-
ference on Smart Instrumentation, Measurement and
Applications (ICSIMA), pages 1–5. https://doi.org/10.
1109/ICSIMA.2013.6717966.
Black, S. E., Lincove, J., Cullinane, J., and Veron, R.
(2015). Can you leave high school behind? Eco-
nomics of Education Review, 46:52–63. https://doi.
org/10.1016/j.econedurev.2015.02.003.
Cader, A. (2020). The Potential for the Use of Deep Neu-
ral Networks in e-Learning Student Evaluation with
New Data Augmentation Method. In Bittencourt,
I. I., Cukurova, M., Muldner, K., Luckin, R., and
Mill
´
an, E., editors, Artificial Intelligence in Educa-
tion, pages 37–42, Cham. Springer International Pub-
lishing. https://doi.org/10.1007/978-3-030-52240-7
7.
Chaban, H. and Kukhtiak, O. (2020). Application of the ar-
tificial neural networks theory in problems of applied
pedagogy of higher education institutions. Ukrainian
Educational Journal, (1):51–56. https://doi.org/10.
32405/2411-1317-2020-1-51-56.
Cherniak, O., Sorocolat, N., and Kanytska, I. (2020).
Graph analytical method for determining the complex
quality indicator of qualimetry objects. Innovative
Technologies and Scientific Solutions for Industries,
4(14):169–175. https://doi.org/10.30837/ITSSI.2020.
14.169.
Chervak, O. Y. (2010). Teoriya optymalnogo vyboru.
Pidkryteriyi paretivskoyi zgortky kryteriyiv [The the-
ory of optimal choice. Sub-criteria for convolution
of Pareto criteria]. Naukovyj visnyk Uzhgorodskogo
universytetu, 30:28–30. https://dspace.uzhnu.edu.ua/
jspui/handle/lib/7372.
Do, Q. H. and Chen, J.-F. (2013). A neuro-fuzzy approach
in the classification of students’ academic perfor-
mance. Computational intelligence and neuroscience,
2013:179097. https://doi.org/10.1155/2013/179097.
Fazlollahtabar, H. and Mahdavi, I. (2009). User/tutor opti-
mal learning path in e-learning using comprehensive
neuro-fuzzy approach. Educational Research Review,
4(2):142–155. https://doi.org/10.1016/j.edurev.2009.
02.001.
Goodfellow, I., Bengio, Y., and Courville, A. (2016). Deep
Learning. Adaptive Computation and Machine Learn-
ing series. MIT Press. http://www.deeplearningbook.
org.
Grytsyuk, Y. I. and Grytsiuk, M. Y. (2014). The Pecu-
liarities of Multiplicative Coagulation a Partial Cri-
teria Into One Generalized Index. Scientific Bul-
letin of UNFU, 24(11):341–352. https://nv.nltu.edu.
ua/Archive/2014/24 11/57.pdf.
Hammerness, K. and Klette, K. (2015). Indicators of
quality in teacher education: Looking at features
of teacher education from an international perspec-
tive. In Promoting and sustaining a quality teacher
AET 2021 - Myroslav I. Zhaldak Symposium on Advances in Educational Technology
196

workforce, volume 27 of International Perspectives
on Education and Society, pages 239–277. Emerald
Group Publishing Limited. https://doi.org/10.1108/
S1479-367920140000027013.
Horal, L., Khvostina, I., Reznik, N., Shyiko, V., Yashcher-
itsyna, N., Korol, S., and Zaselskiy, V. (2020).
Predicting the economic efficiency of the business
model of an industrial enterprise using machine learn-
ing methods. In Kiv, A., editor, Proceedings of
the Selected Papers of the Special Edition of In-
ternational Conference on Monitoring, Modeling &
Management of Emergent Economy (M3E2-MLPEED
2020), Odessa, Ukraine, July 13-18, 2020, volume
2713 of CEUR Workshop Proceedings, pages 334–
351. CEUR-WS.org. https://ceur-ws.org/Vol-2713/
paper37.pdf.
Isac, C., Nita, D., and Dura, C. (2010). Optimizing
Franchising Investment Decision Using Elec-
tre and Rompedet Methods. The IUP Jour-
nal of Managerial Economics, 8(1/2):7–32.
https://www.iupindia.in/510/IJME
Optimizing
Franchising Investment Decision 7.html.
Kardan, A. A., Sadeghi, H., Ghidary, S. S., and Sani,
M. R. F. (2013). Prediction of student course selec-
tion in online higher education institutes using neural
network. Computers & Education, 65:1–11. https:
//doi.org/10.1016/j.compedu.2013.01.015.
Kirichek, G., Harkusha, V., Timenko, A., and Kulykovska,
N. (2019). System for detecting network anoma-
lies using a hybrid of an uncontrolled and con-
trolled neural network. CEUR Workshop Proceed-
ings, 2546:138–148. https://ceur-ws.org/Vol-2546/
paper09.pdf.
Kondruk, N. E. and Maliar, M. M. (2019). Bagatokry-
terialna optymizatsiia liniinykh system [Multicriteria
optimization of linear systems]. Autdor-Shark, Uzh-
gorod, Ukraine. https://dspace.uzhnu.edu.ua/jspui/
handle/lib/24042.
Lesinski, G., Corns, S., and Dagli, C. (2016). Application
of an Artificial Neural Network to Predict Graduation
Success at the United States Military Academy. Pro-
cedia Computer Science, 95:375–382. https://doi.org/
10.1016/j.procs.2016.09.348.
Liu, C., Feng, Y., and Yuling, W. (2022). An innova-
tive evaluation method for undergraduate education:
an approach based on bp neural network and stress
testing. Studies in Higher Education, 47(1):212–228.
https://doi.org/10.1080/03075079.2020.1739013.
Mahapatra, S. S. and Khan, M. S. (2007). A neural net-
work approach for assessing quality in technical edu-
cation: an empirical study. International Journal of
Productivity and Quality Management, 2(3):287–306.
https://doi.org/10.1504/IJPQM.2007.012451.
Markova, O. M., Semerikov, S., and Popel, M. (2018).
Cocalc as a learning tool for neural network simula-
tion in the special course ”foundations of mathematic
informatics”. In Ermolayev, V., Su
´
arez-Figueroa,
M. C., Yakovyna, V., Kharchenko, V. S., Kobets,
V., Kravtsov, H., Peschanenko, V. S., Prytula, Y.,
Nikitchenko, M. S., and Spivakovsky, A., editors, Pro-
ceedings of the 14th International Conference on ICT
in Education, Research and Industrial Applications.
Integration, Harmonization and Knowledge Transfer.
Volume II: Workshops, Kyiv, Ukraine, May 14-17,
2018, volume 2104 of CEUR Workshop Proceedings,
pages 388–403. CEUR-WS.org. https://ceur-ws.org/
Vol-2104/paper 204.pdf.
M
¨
uller, B., Reinhardt, J., and Strickland, M. T. (1995). Neu-
ral Networks: An Introduction. Physics of Neural Net-
works. Springer-Verlag Berlin Heidelberg, 2 edition.
https://doi.org/10.1007/978-3-642-57760-4.
Okubo, F., Yamashita, T., Shimada, A., and Konomi, S.
(2017a). Students’ performance prediction using data
of multiple courses by recurrent neural network. In
Mohd Ayub, A. F., Mitrovic, A., Yang, J.-C., Wong,
S. L., and Chen, W., editors, Proceedings of the 25th
International Conference on Computers in Education,
ICCE 2017 - Main Conference Proceedings, page 439
– 444. Asia-Pacific Society for Computers in Educa-
tion. https://www.apsce.net/icce/icce2017/140.115.
135.84/icce/icce2017/sites/default/files/proceedings/
main/C3/Students%20Performance%20Prediction%
20Using%20Data%20of%20Multiple%20Courses%
20by%20Recurrent%20Neural%20Network.pdf.
Okubo, F., Yamashita, T., Shimada, A., and Ogata, H.
(2017b). A neural network approach for students’
performance prediction. In Proceedings of the Sev-
enth International Learning Analytics & Knowledge
Conference, LAK ’17, page 598–599, New York, NY,
USA. Association for Computing Machinery. https:
//doi.org/10.1145/3027385.3029479.
Osadchyi, V., Kruglyk, V., and Bukreyev, D. (2018). De-
velopment of a software product for forecasting the
entrance of applicants to higher educational institu-
tions. Ukrainian Journal of Educational Studies and
Information Technology, 6(3):55–69. https://doi.org/
10.32919/uesit.2018.03.06.
Parvu, I. and Ipate, D. M. (2007). Mathematical model of
measuring the quality of services of the higher ed-
ucation institutions. Journal of Applied Economic
Sciences, 2(1(2)
Fall2007). https://EconPapers.repec.
org/RePEc:ush:jaessh:v:2:y:2007:i:1(2) fall2007:5.
Pererva, V. V., Lavrentieva, O. O., Lakomova, O. I., Zaval-
niuk, O. S., and Tolmachev, S. T. (2020). The tech-
nique of the use of virtual learning environment in the
process of organizing the future teachers’ terminolog-
ical work by specialty. CTE Workshop Proceedings,
7:321–346. https://doi.org/10.55056/cte.363.
Porokhnya, V. and Ostapenko, O. (2019). Neural network
and index forecasting of the strategies of development
of the armed forces of ukraine depending on their own
economic opportunities and encroachments of the ag-
gressor states. In Kiv, A., Semerikov, S., Soloviev,
V. N., Kibalnyk, L., Danylchuk, H., and Matviy-
chuk, A., editors, Proceedings of the Selected Pa-
pers of the 8th International Conference on Monitor-
ing, Modeling & Management of Emergent Economy,
M3E2-EEMLPEED 2019, Odessa, Ukraine, May 22-
24, 2019, volume 2422 of CEUR Workshop Proceed-
ings, pages 111–120. CEUR-WS.org. https://ceur-ws.
org/Vol-2422/paper09.pdf.
Rivas, A., Gonz
´
alez-Briones, A., Hern
´
andez, G., Prieto,
Methodology for Assessing the Quality of an Educational Program and Educational Activities of a Higher Education Institution Using a
Neural Network
197

J., and Chamoso, P. (2021). Artificial neural net-
work analysis of the academic performance of stu-
dents in virtual learning environments. Neurocomput-
ing, 423:713–720. https://doi.org/10.1016/j.neucom.
2020.02.125.
Semerikov, S., Teplytskyi, I., Yechkalo, Y., Markova, O.,
Soloviev, V., and Kiv, A. (2022). Using spread-
sheets as learning tools for neural network simulation.
Ukrainian Journal of Educational Studies and Infor-
mation Technology, 10(3):42–68. https://doi.org/10.
32919/uesit.2022.03.04.
Shtovba, S. and Pankevych, O. (2018). Fuzzy technology-
based cause detection of structural cracks of stone
buildings. In Ermolayev, V., Su
´
arez-Figueroa, M. C.,
Lawrynowicz, A., Palma, R., Yakovyna, V., Mayr,
H. C., Nikitchenko, M. S., and Spivakovsky, A., edi-
tors, Proceedings of the 14th International Conference
on ICT in Education, Research and Industrial Appli-
cations. Integration, Harmonization and Knowledge
Transfer. Volume I: Main Conference, Kyiv, Ukraine,
May 14-17, 2018, volume 2105 of CEUR Workshop
Proceedings, pages 209–218. CEUR-WS.org. https:
//ceur-ws.org/Vol-2105/10000209.pdf.
Shtovba, S. D. (2007). Proektirovanie nechetkikh
sistem sredstvami MatLab [Fuzzy systems de-
sign of by means of MatLab]. Goryachaya
Liniya–Telekom, Moscow. http://pistunovi.inf.ua/
shtovba proek nechet sistem matlab.pdf.
Sivanandam, S. N., Sumathi, S., and Deepa, S. N. (2006).
Introduction to neural networks using Matlab 6.0.
Tata McGraw-Hill Education, New Delhi.
Tarasenko, A. O., Yakimov, Y. V., and Soloviev, V. N.
(2019). Convolutional neural networks for image clas-
sification. CEUR Workshop Proceedings, 2546:101–
114. https://ceur-ws.org/Vol-2546/paper06.pdf.
Taylan, O. and Karag
¨
ozo
˘
glu, B. (2009). An adaptive
neuro-fuzzy model for prediction of student’s aca-
demic performance. Computers & Industrial Engi-
neering, 57(3):732–741. https://doi.org/10.1016/j.cie.
2009.01.019.
Tryhub, I. (2016). Professional training of experts in the
field of education in Slavic Eastern European coun-
tries. Pedagogical process: theory and practice, 4:78–
78. https://tinyurl.com/4vb4ysub.
Valko, N. and Osadchyi, V. (2020). Education individual-
ization by means of artificial neural networks. E3S
Web of Conferences, 166:10021. https://doi.org/110.
1051/e3sconf/202016610021.
Verkhovna Rada of Ukraine (2019). Regulations on the
accreditation of educational programs, which provide
training for higher education. https://zakon.rada.gov.
ua/laws/show/z0880-19\#Text.
Waheed, H., Hassan, S.-U., Aljohani, N. R., Hardman, J.,
Alelyani, S., and Nawaz, R. (2020). Predicting aca-
demic performance of students from VLE big data
using deep learning models. Computers in Human
Behavior, 104:106189. https://doi.org/10.1016/j.chb.
2019.106189.
W
¨
achter, B., Kelo, M., Lam, Q., Effertz, P., Jost, C., and
Kottowski, S. (2015). University quality indicators: a
critical assessment. Technical report, Directorate Gen-
eral for Internal Policies, Policy Department B: Struc-
tural and Cohesion Policies. https://doi.org/10.2861/
426164.
AET 2021 - Myroslav I. Zhaldak Symposium on Advances in Educational Technology
198
