
Feasibility Study of using an Electric Vehicle in the Actual
Infrastructure of a Small City in Spain
Andrés Montero Romero
1
, Michela Longo
2,*
, Federica Foiadelli
2
and Wahiba Yaici
3
1
Universidad Carlos III de Madrid, Spain
2
Politecnico di Milano, Italy
3
CanmetENERGY Research Centre, Canada
wahiba.yaici@nrcan-rncan.gc.ca
Keywords: Electric vehicles, Charging station, Sustainable mobility, Transportation.
Abstract: This study simulates certain conditions in Cuenca, a small city located in the centre of Spain, between Madrid
and Valencia, which uses electric mobility. The objective is to conduct an appraisal of the use of electric
mobility in order to ascertain possible improvements or developments that will be required in a green,
ecological and smart city in the future. In order to facilitate this experiment, an electric vehicle will be driven
from Cuenca to Madrid. Battery charging will take place at designated charging stations along the way, if
required. Four commercial vehicles with different characteristics have been chosen for the simulations. In
case there are any vehicles which cannot reach the destination, likely causes will be reviewed, and solutions
will be suggested.
1 INTRODUCTION
Until recently, the electric vehicle was an unknown
and unfamiliar phenomenon. However, there was a
disposition to replace private vehicles propelled by
Internal Combustion Engines (ICE) with vehicles that
are propelled by electric motors and powered by
batteries (
Kiyakli and Solmaz, 2019; Besselink et al.,
2010). According to experts, the key motivation for
this change is the technological revolution that the
electric vehicle represents. Changes in automotive
policies and a commitment to environmental
protection are additional strong reasons, with the
environment being the most pressing and pervasive
concern (
Evtimov et al., 2017). Considering how
burning of fossil fuels contributes to climate change,
replacing the millions of cars propelled by ICE with
electrical vehicles should significantly alleviate this
problem for the Earth (I.N. Laboratory). Spain has
made good progress in deploying electric vehicles
compared to other European countries (
Hedge et al.,
2016). Registered electric vehicles represent 0.32%
of the market share compared with 1.7 % which is the
average in other European countries (
Valsera-Naranjo
et al., 2009; Yan et al
., 2014). Yearly improvements are
visible, both in perception and thinking of the Spanish
people, as well as in sales and governmental policies
regarding electric vehicles. A limitation to the use of
electric vehicles in Spain is the relatively small
number of charging stations. In spite of widespread
availability of charging equipment, in 2017 Spain was
only fifth place in Europe with 5000 points (4.26% of
European charging stations), while the United
Kingdom (UK) was fourth place with 12.2%,
signifying a huge gap between them. The situation is
more deplorable when reviewing fast charging
stations. Only 12% of charging stations are
configured for fast charge. The geographical
distribution of charging stations is irregular (
He and
Hou, 2017; Mehmet Cem Catalbas et al., 2017)
. They are
principally located only in the biggest cities such as
Madrid, Barcelona, Valencia, Bilbao and Seville.
They are also installed along major roads and
highways and close to the coast for tourism. This
study is focused in checking if people can move from
Cuenca to Madrid and come back using an electric
vehicle, charging the batteries during the trip if is
required. Battery charging will take place at
designated charging stations along the way, if
required. Four commercial vehicles with different
characteristics have been chosen for the simulations.
In case there are any vehicles which cannot reach the
100
Romero, A., Longo, M., Foiadelli, F. and Yaici, W.
Feasibility Study of using an Electric Vehicle in the Actual Infrastructure of a Small City in Spain.
DOI: 10.5220/0011358800003355
In Proceedings of the 1st International Joint Conference on Energy and Environmental Engineering (CoEEE 2021), pages 100-107
ISBN: 978-989-758-599-9
Copyright
c
2022 by SCITEPRESS – Science and Technology Publications, Lda. All rights reserved

destination, likely causes will be reviewed, and
solutions will be suggested.
The paper is divided into the following sections:
Section 3 describes the model of an EV with a real
driving cycle. In Sections 4 and 5, details of the case
study and simulation results using Matlab-Simulink
are provided, followed by discussions. Finally, the
last section provides the main conclusions of this
study.
2 PERFORMANCE MODEL OF
AN ELECTRIC VEHICLE
DRIVEN IN A REAL PATH
In order to understand the dynamics of a vehicle,
electric or fuel powered car, train or trucks, it is
necessary first to evaluate the forces involved in their
movement (Di Giorgio et al. 2017;
Zhongjing et al.
2013)
. Those principal forces are determined using the
physic laws that are used to model and simulate the
motion of the electric vehicle (
Hosseini et al, 2020; Tan
and Osama, 2013)
. The typical problem is to identify
the forces of a vehicle in a ramp as represented in
figure 1.
Figure 1: Forces of a vehicle located in a ramp.
During driving, the resistance forces which act on
the vehicles are determined with the following
governing equations:
• Aerodynamic resistance:
𝐹
=
1
2
𝜌𝐶
𝐴
𝑣
(1)
where ρ is the air density, whose typical value is 1.225
kg/m
3
; C
d
is the aerodynamic coefficient; A
f
is the
frontal area of the vehicle (m
2
) and v is the speed of
the vehicle (m/s).
• Tire rolling resistance:
𝐹
=𝑚𝑔𝐶
𝑐𝑜𝑠(𝜃)
(2)
where m is the vehicle mass (kg); g is the gravity
acceleration. Its value is 9.81 m/s
2
; 𝜃 is the slope of
the ramp and 𝐶
is the tire rolling resistance
coefficient and it varies according to the road surface
(0.013 for concrete or asphalt).
• Gradient resistance:
𝐹
=𝑚𝑔𝑠𝑖𝑛(𝜃)
(3)
where m is the vehicle mass (kg); g is the gravity
acceleration. Its value is 9.81 m/s
2
and 𝜃 is the slope
of the ramp.
• Inertia resistance:
𝐹
=𝑚𝑎 (4)
where m is the vehicle mass (kg) and a is the
acceleration or deceleration of the vehicle (m/s
2
).
Finally, the total resistance force is the sum of all
them:
𝐹
=𝐹
+𝐹
+𝐹
+𝐹
(5)
Manufacturers do not give the data of each of the
component of the vehicle. For this reason, it will be
not accurate to model a whole vehicle by taking into
account the energy flows from the battery to the
wheels including the electronic converter, electric
motor and the transmission system. However, the EV
battery capacity is known. Normally, the EV tries
recharging the battery before spending the 80% of its
capacity. That is known like battery utilisation factor.
Moreover, the efficiency of the power train is also
around 80%. That is known as the 80% rule of thumb
for BEV power train efficiency and battery
utilisation. Therefore, knowing the battery capacity
and the parameters of the vehicle per Eqs. (1–5),
which allow to calculate the resistant forces, the
required energy for moving the vehicle can then be
computed.
The required power which has to be delivered by
the battery is:
𝑃
=
1
𝜂
·𝐹
·𝑣+𝑃
(6)
where 𝜂
is a constant overall efficiency of the power
train and 𝑃
is the power usage for auxiliary
systems. In the following, a procedure is provided for
modelling the behaviour of an electric vehicle driven
in a path according to the parameters given in the
manufactures’ specifications and the known position
and characteristics of the actual charging stations.
2.1 Inputs Definition
It is important to know all needed parameters for
characterizing both the vehicles and routes. For
vehicles, the principal parameters are the mass of
vehicle, dimensions, the capacity of the battery of the
vehicle and its aerodynamic coefficient. For more
precision, knowing their maximum acceleration and
speed could be an advantage. Those data are detailed
in technical data of vehicles given by manufacturers.
Referring to the parameters of the routes, these are
principally the total distance, slope in different
intervals, the referent speed in each part of the path
and the location of the charging station where it is
possible to charge the vehicle. Google Earth is a free
Feasibility Study of using an Electric Vehicle in the Actual Infrastructure of a Small City in Spain
101

software which allows getting those parameters by
means of obtaining the altitude, longitude and latitude
of several points which draw the route. After that,
data could be extracted in an Excel file.
2.2 Speed, Acceleration and Slope
Profiles in Simulink
In order to get a better precision, Simulink computes
the speed, acceleration and slope profiles. Input data
in Simulink are the maximum speed of the ways,
which will be the reference speed of the vehicle, and
the slope which have been imported from Excel.
Those data are introduced in “Lookup tables” whose
input is the distance from the starting point. A PID
(Proportional–Integral–Derivative) controller allows
to reach the reference speed of the vehicle when slope
and/or the speed of the way change. The design of the
PID have been done using Ziegler-Nichols method
for each vehicle knowing its acceleration.
2.3 Energy and SOC Calculation
Once acceleration, speed and slope in each stretch of
the paths are known, required power can be calculated
using Equation 6.
It is worth noting that, due to the fact inertial force
is only required in transients, it has not been taken
into account. For calculating the required energy and
the State of Charge (SOC) in each point of the path,
the algorithm has been computed calculating the
consumed energy from the starting until a certain
point as the sum of the consumed energy in little
intervals of 50-100 metres of length.
Taking from Simulink the input data from
calculating the required power and the time between
two intervals of discretization of the path, energy
consumption in that interval is calculated. Finally, the
SOC is calculated.
2.4 Checking if Charging is Required
The last part of the algorithm is to check if charging
the battery of the vehicle is required in order to not
reach a SOC lower than 20% which could damage the
battery. It will also say where the vehicle should be
charged. If there are points which SOC becomes
lower than 20% and there is not any charging station
before, a charging station will be necessary.
Multiplying that power delivered by the battery times
the spending time of the journey, the energy supplied
by the battery can be known.
Finally, the SOC of the battery, that is, the level
of charge of a battery relative to its capacity, is
calculated:
SOC
=
𝐵𝑎𝑡𝑡𝑒𝑟𝑦 𝑐𝑎𝑝𝑎𝑐𝑖𝑡𝑦 − 𝐸𝑛𝑒𝑟𝑔𝑦 𝑐𝑜𝑛𝑠𝑢𝑚𝑒
𝐵𝑎𝑡𝑡𝑒𝑟
𝑦
𝑐𝑎
𝑝
𝑎𝑐𝑖𝑡
𝑦
(7)
3 CASE STUDY
Cuenca is a city in central Spain, and is the capital of
the Cuenca province, in the region of Castile – La
Mancha. Cuenca city is located 168 km from Madrid,
199 km from Valencia and 179 km from Toledo;
these are the surrounding principal Spanish cities. In
2019, the Spanish Statistical Office (Instituto
Nacional de Estadística - INE), recorded the total
population of Cuenca city as 54,690 people while the
province of Cuenca has 196,323 people. This means
that 27.28% of the province’s population live in the
capital city. Cuenca province is one of the most
affected by depopulation in Spain. Depopulation
happened for many reasons: Cuenca is an area with a
large proportion of aged people; there are few big
industries and the economy is principally reliant on
farming, agriculture and forestry activities; and there
is minimal investment in new industries or in
infrastructure. For these reasons, young people seek
employment in the capital city or other city outside
the province, principally in Madrid or Valencia due to
their proximity. In respect of Electric Vehicles,
Castile – La Mancha represents only 3% of the
vehicles registered in Spain, what shows that its
deployment there is insignificant.
Moreover, in the city of Cuenca, amidst the 11
charging stations, only one is public, and is managed
by Iberdrola. The others are either private or are
located in hostels, supermarkets or in car dealerships,
or are out of service. The objective is to determine
whether an electric vehicle can get to Madrid, which
is the city closest to Cuenca. Achieving this feat could
be a motivation for Cuenca residents to purchase
electric vehicles. This is because that route is popular
since many of them currently work or study in the two
cities. It is also commonly traversed for tourism and
leisure.
Four different commercial vehicles have been
selected according to parameters including battery
capacity, and price, and number of sales in past years.
The vehicles are: Citröen C-Zero, Nissan Leaf, BMW
i3 and Tesla model S. The required parameters for the
model can be easily obtained in their specifications.
The assumption will be that the vehicle is driven with
daily lighting and heating or air conditioning turned
CoEEE 2021 - International Joint Conference on Energy and Environmental Engineering
102

on during the trip. So, the term P
aux
of Equation 6 is
equal to 540 W. Regarding the travel route, it is
important to know its parameters such as total length,
the slopes at different intervals of the route, the
reference speed of the vehicle at each point of the
route, location of the actual charging stations and
their number, and the types and capacity (power) of
the connectors. The chosen travel route is the fastest
and most commonly used route to Madrid. Reference
speed will be the maximum allowed by the Spanish
traffic law, which is: 50 km/h inside the urban and
industrial areas, 90 km/h on conventional roads and
120 km/h on highways.
Figure 2 presents the altitude profile of both
routes. It allows the taking of data for calculating the
slope profile. Red points indicate the location of the
actual charging station that can be found during the
trip.
Figure 2: Altitude profile from Cuenca to Madrid.
Table 1 presents the features of those charging
stations.
Table 1: Actual charging stations in the route Cuenca-Madrid.
No Location Type Use Connector Type
Power
(kW)
1 Car dealer Charging allowed
Schuko (EU Plug) 2.3
CEE 3P+N+E 11.0
2 Street charging
Public
(managed by
Iberdrola)
TYPE 2 43.0
TYPE 2 43.0
CCS2 (x2) 50.0
CHAdeMO (x2) 50.0
3 Hotel - restaurant Charging allowed
CHAdeMO 50.0
CCS2 50.0
TYPE 2 43.0
Tesla Dest. Charger 7.5
4 Private Tesla Dest. Charger 16.0
5 Supermarket Only for clients TYPE 2 (x2) 7.0
6 Hotel Only for clients
Tesla Dest. Charger (x2) 11.0
TYPE 2 11.0
7 Hotel - restaurant Only for clients Schuko (EU Plug) 22.0
8 Street charging Public TYPE 2 22.0
9 Street charging Public TYPE 2 22.0
10 Street charging Public
Schuko (EU Plug) 3.7
TYPE 2 22.0
11 Street charging Public TYPE 2 (x2) 22.0
12 Street charging
Public
(managed by
Iberdrola)
TYPE 2 43.0
CCS2 50.0
CHAdeMO 50.0
13 Car dealer Charging allowed CHAdeMO 50.0
14 Supermarket Only for clients TYPE 2 (x2) 7.0
Feasibility Study of using an Electric Vehicle in the Actual Infrastructure of a Small City in Spain
103
4 RESULTS AND DISCUSSION
The procedure adopts for this work is reported in
figure 3. The result of the simulation is indicated in a
graph in which remaining battery life is represented
as the SOC of the battery for each kilometre from the
starting point. It can show the desired results in this
way:
• If there is at least one point of the graph with SOC
lower than 20%, then theoretically this means that
the vehicle cannot reach the destination.
• The graph indicates the points where the last
charging station that is compatible with the
vehicle is located for charging before SOC
becomes lower than 20%. Those points are
represented in the graph as a step upwards until
SOC is equal to 100% by which time the battery
is fully charged.
• If SOC drops to 0%, the vehicle will stop. It is
possible that a graph could indicate that, after
SOC equals to 0, there is subsequently a
movement upwards until it reaches 100%. In such
case it represented that way in order to observe the
charging range afterwards at that charging station
if the vehicle’s battery is completely depleted but
is later recharged at the same station.
• If SOC never reaches 20%, it means that the
vehicle can reach the destination without charging
its battery during the trip.
Figure 3: Logical algorithm applied to the case study.
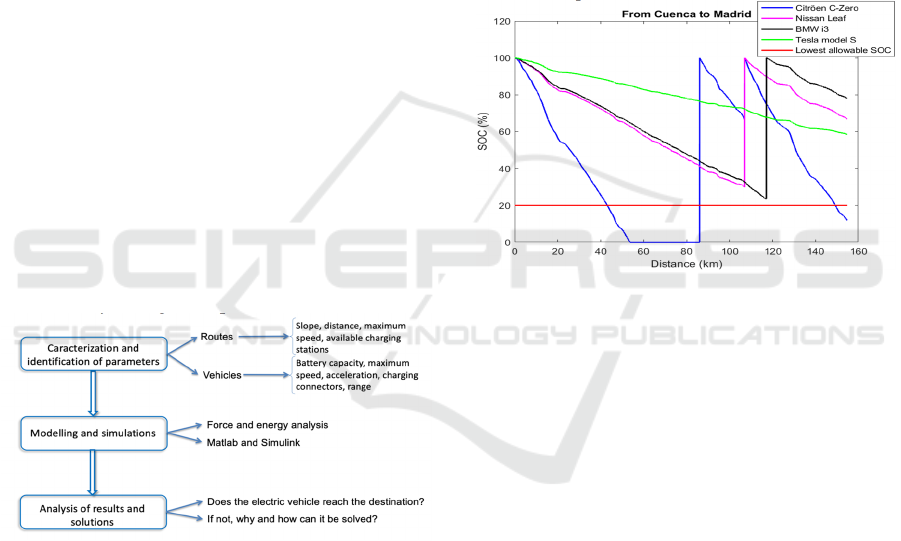
Figure 4 presents the simulation results for the
four vehicles in the trip from Cuenca to Madrid.
It is possible to charge a Citröen C-Zero’ battery
both in Cuenca and in Madrid’s commercial centre
because there are CHAdeMO connectors in both
cities. Thus, for a trip from Cuenca to Madrid and
then back to Cuenca, the battery will start with a full
charge both ways. The same is true for the remaining
vehicles because both locations have charging
stations with connectors TYPE 2. It is worth noting
that the return trip is undertaken on the assumption
that the vehicle came from Cuenca.
Once simulations have been done, the feasibility
study reaches the important part: analysis of results
and taking of decisions. Simulations indicate whether
or not electric vehicles can reach their destinations
and return again to Cuenca. If that is not possible,
some measures will be undertaken to resolve the
problems and assist the city of Cuenca to become
green and sustainable in the foreseeable future. For
the Citröen C-Zero, driving it to Madrid’s
commercial centre is not feasible because there are
points where SOC is lower than 20% and charging
stations are unavailable during the trip to charge the
battery. This presents the risk of battery depletion and
the vehicle would stop where SOC becomes 0%. For
the same reason when the trip initiates from Madrid,
it is also not possible to return to Cuenca.
Figure 4: Altitude profile from Cuenca to Madrid.
Simulation results from Cuenca to Madrid in the actual
driving conditions for different vehicles.
In the case of the Nissan Leaf, it is possible to get
to the commercial centre of Madrid and also return to
Cuenca. However, one stop is required halfway
through the journey to charge the battery. Going to
Madrid, the last compatible charging station before
SOC drops lower than 20% is located in the hotel-
restaurant of Fuentidueña de Tajo (point 3 of table 1).
For the return trip, the stop is recommended to be
located at the public charging station of Tarancón
(Point 2 of table 1).
The BMW i3 can similarly get to the destination
in Madrid but it will have to stop once on the way for
charging. The last compatible charging station is in
the supermarket of villarejo de Sabanés (Point 5 of
table 1). The same applies when returning to Cuenca
and the stop is recommended to be in Tarancón (Point
2 of table 1). Driving a Tesla model S, it is possible
reach the destination without any charging being
necessary. The same is the case when returning to
Cuenca. Table 2 is a summary of features of the trip
to Madrid.
CoEEE 2021 - International Joint Conference on Energy and Environmental Engineering
104

Table 2: Characteristics of the trip to Madrid in electric vehicle in the actual environment case study.
Charging
Station
Arrival
SOC [%]
Energy to
charge [kWh]
Cost
[€]
Connector
type
Power
[kW]
Time
[min]
Nissan
Leaf
Fuentidueña
de Ta
j
o
29.96 25.214 3.409 TYPE 2 7 216.123
Tarancón* 35.99 23.044 3.115 CHAdeMO 50 27.652
Madrid 67.23 11.797 1.595 CHAdeMO 50 14.157
Tarancón 48.10 18.684 2.526 CHAdeMO 50 22.421
Cuenca 39.33 21.841 2.953 CHAdeMO 50 26.209
Total Cost (€) 10,482
BWM i3
Villarejo de
Sabanés
24.47 28.626 3.870 TYPE 2 7 245.365
Tarancón* 40.09 22.706 3.069 CHAdeMO 50 27.247
Madrid 78.18 8.270 1.118 CCS2 50 9.924
Tarancón 51.54 18.366 2.483 TYPE 2 43 25.627
Cuenca 42.63 21.743 2.939 CCS2 50 26.092
Total Cost (€) 10.410
Tesla
model S
Madrid 58.55 39.3775 5.323 TYPE 2 43 54.945
Cuenca 53.56 44.118 5.964 TYPE 2 43 61.560
Total Cost (€) 11.287
*Alternative stop in Tarancón in order to spend less
time charging the battery.
The problem that occurred during the simulation
with Citröen C-Zero happened because it could not
reach Madrid. SOC of battery of Citröen C-Zero
drops to 20% after 42 km from Cuenca. Assuming
that it could get to the following charging stations at
Tarancón and Fuentidueña del Tajo, the Citröen C-
Zero would still not have reached Madrid without
another stop. It can thus be concluded that it is
impossible to travel from Cuenca to Madrid driving a
Citröen C-Zero. This limitation arises because there
are inadequate charging stations along the travel
route.
Two options are available to resolve it: add new
connectors to charging stations that are already
installed and functioning; or build new charging
stations. This is on the assumption that all the new
charging stations will be equipped with CHAdeMO
connectors with power 50 kW which is typical of
Iberdrola charging infrastructure. New charging
stations should be constructed at strategic points for
many reasons. Good locations would have service
centres such as restaurants, cafes, canteens and hotels
where drivers and other travellers can wait, refresh
themselves, eat or rest comfortably while the vehicle
is charging in a safe environment without the
discomfort of standing up throughout. Other possible
good locations will ideally be close to villages or
industrial areas where cheaper electrical equipment
and spares can easily be sourced since electrical
outlets are already installed, and also for staffing. To
avoid the vehicle’s SOC dropping lower than 20%, a
charging point is required before 42 km from Cuenca.
A village known as Naharros is located 35 km from
Cuenca, with a fuel station and a bar at its entrance.
This could be a good location for the first charging
station.
It will be impossible to reach Tarancón where two
additional charging stations can be found, without
charging once again. Carrascosa del Campo located
57 km from Cuenca, can be an ideal spot for this,
especially since it also has restaurants, hotels, a
medical centre and a service station.
The charging stations of Tarancón and
Fuentidueña del Tajo can be used. It is necessary to
add one more charging station before getting to
Madrid. If the charging station at the supermarket in
Villarejo de Sabanés has the capacity to charge with
Type 1 or CHAdeMO connectors, the problem will be
solved, and it would be possible to get to Madrid
driving a Citröen C-Zero (table 3).
Feasibility Study of using an Electric Vehicle in the Actual Infrastructure of a Small City in Spain
105

Table 3: Characteristics of the trip to Madrid for driving a Citröen C-Zero with new charging stations.
Charging Station
Arrival SOC
[%]
Energy to charge [kWh]
Cost
[€]
Time
[min]
Naharros 34.52 9.494 1.28 11.393
Carracosa del Campo 59.81 5.827 0.787 6.992
Tarancón 47.39 7.628 1.031 9.154
Villarejo de Sabanés 41.34 8.505 1.149 10.206
Madrid 37.05 9.127 1.233 10.952
Villarejo de Sabanés 24.19 10.992 1.486 13.190
Tarancón 39.30 8.801 1.189 10.561
Carrascosa del Campo 43.14 8.244 1.114 9.893
Naharros 56.06 6.371 0.861 7.645
Cuenca 38.22 8.958 1.210 10.750
Total Cost (€) 11.348
5 CONCLUSIONS
The scope of this work was to simulate certain
conditions in Cuenca, between Madrid and Valencia,
which uses electric mobility. The objective is to
conduct an appraisal of the use of electric mobility in
order to ascertain possible improvements or
developments that will be required in a green,
ecological and smart city in the future. In order to
facilitate this experiment, an electric vehicle was
driven from Cuenca to Madrid. Four commercial
vehicles with different characteristics have been
chosen for the simulations. The following
considerations can be drawn from the present study:
• It is not possible to travel to Madrid, the big city
closest to Cuenca, if the electric vehicle is similar
to the Citröen C-Zero, because of its weak battery
capacity. Sadly, this vehicle is economically
affordable by most people.
• It is possible to make a direct trip to Madrid with
powerful and expensive vehicles like Tesla model
S. Smaller, less powerful vehicles like Nissan
Leaf or BWM i3 can also make the trip if they stop
just once for charging. The problem however is
that most people cannot afford those vehicles.
• Province of Cuenca does not have many charging
stations. Most of the proposed new charging
stations which will enable driving the Citröen C-
Zero to destination are located in this area, where,
in spite of poor industry and depopulation, this
kind of infrastructure will be necessary in the
future.
• In the city of Cuenca there are different types of
connectors in charging stations, and these can
charge all types of vehicles. The problem is that
only one charging station is public whereas there
is an increasing number of electric vehicles being
sold.
• The use of electric vehicle and its infrastructure is
increasing in the larger cities in Spain such as
Madrid, Barcelona, Valencia and Bilbao, but not
in poorer and less populated areas. Government at
all levels should give incentives to electric vehicle
manufacturing companies to increase the number
of charging stations in areas similar to Cuenca
before encouraging people to buy electric
vehicles.
• Costs of driving an electric vehicle are much
lower than a conventional car that is powered by
fossil fuels.
REFERENCES
Kiyakli A. O., Solmaz, H. (2020). Modeling of an Electric
Vehicle with MATLAB/SIMULINK, International
Journal of Automotive Science and Technology, 2020,
vol.2, Issue 4, pp. 9-15.
Besselink I., Nijmeijer, N., Meinders, E., Nijmeijer, H.
(2010). Desing of an efficient, low weight battery
electric vehicle based on a VW Lupo 3L, the 25th
World Battery, Hybrid and Fuel Cell Electric Vehicle
Symposium & Exhibition. (EVS-25), Shenzhen, China,
Nov. 5-9, 2010.
Evtimov, I., Ivanov, R. (2017). Sapundjiev, M., Energy
consumption of auxiliary systems of electric cars,
BulTrans-2017 – 9th International Scientific
Conference on Aeronautics, Automotive and Railway
Engineering and Technologies.
I. N. Laboratory, EV Auxiliary Systems Impacts. Available
to: https://avt.inl.gov/publication/ev-auxiliary-systems-
impacts
CoEEE 2021 - International Joint Conference on Energy and Environmental Engineering
106

Hedge, V., Aswaathu, T., Sidhartf, R. (2016). Student
residential distance calculation using Haversine
formulation and visualization through Google Maps for
admission analysis, 2016 IEEE International
Conference on Computational Intelligence and
Computing Research (ICCIC), Chennai, India, 15-17
Dec. 2016.
Valsera-Naranjo, E., Sumper, A., Lloret-Gallego, P.,
Villafáfila-Robles, R., Sudria-Andreu, A. (2009).
Electrical Vehicles: State of Art and Issues for their
Connection to the Network, 2009 10th International
Conference on Electrical Power Quality and Utilisation,
Lodz, Poland, 15-17 Sept. 2009.
Yan, X., Duan, C., Chen X., Duan, Z. (2014). Planning of
Electric Vehicle Charging Station Based on Hierarchic
Genetic Algoritm, 2014 IEEE Conference and Expo
Transportation Electrification Asia-Pacific (ITEC Asia-
Pacific), Beijing, China, 31 Aug.-3 Sept. 2014.
He, B., Hou, Y. (2017). Research on Estimation Method of
the Balance Density of Electric Vehicles Charging
Points, 2017 IEEE International Conference on Energy
Internet (ICEI), Beijing, China, 17-21 April 2017.
Mehmet Cem Catalbas, M. Y., Gulten, A., Kurum, H.
(2017). Estimation of Optimal Location for Electric
Vehicle Charging Stations, 2017 IEEE International
Conference on Environment and Electrical Engineering
and 2017 IEEE Industrial and Commercial Power
Systems Europe (EEEIC / I&CPS Europe), Milan,
Italy, 6-9 June 2017.
Di Giorgio, A., Liberati, F., Canale, S. (2014). Electric
vehicles charging control in a smart grid: A model
predictive control approach, Control Engineering
Practice, Control Engineering Practice, vol. 22, 2014,
pp. 147-162.
Zhongjing, Ma, Duncan, S.C. (2013). Hiskens, I.A.,
Decentralized Charging Control of Large Populations
of Plug-in Electric Vehicles, IEEE Transactions on
Control Systems Technology, Vol. 21, Issue: 1, 2013,
pp. 67-78.
Hosseini, S.M., Carli, R., Cavone, G., Dotoli, M. (2020).
Distributed control of electric vehicle fleets considering
grid congestion and battery degradation, Internet
technology letters, Vol. 3, Issue: 3, 2020.
Tan, Ma, Osama, M. (2013). Real-time plug-in electric
vehicles charging control for V2G frequency
regulation, IECON 2013 - 39th Annual Conference of
the IEEE Industrial Electronics Society, Vienna
(Austria), 10-13 November 2013.
Feasibility Study of using an Electric Vehicle in the Actual Infrastructure of a Small City in Spain
107
