
Density based Anomaly Detection for Wind Turbine Condition
Monitoring
Johannes Bernhard
1,4,*
, Jonas Schmidt
2,4
and Mark Schutera
3,4
1
Karlsruhe Institute of Technology, Institute for Information Processing Technologies, Germany
2
University of Osnabrück, Institute of Cognitive Science, Germany
3
Karlsruhe Institute of Technology, Institute for Automation and Applied Informatics, Germany
4
ZF Friedrichshafen AG, Research and Development, Germany
Keywords: Condition monitoring, Machine learning, Environmental engineering, Anomaly detection.
Abstract: Unsupervised and explainable approaches are critical in anomaly detection for mechanical systems. This work
proposes a density-based k-nearest neighbor method to combine an unsupervised learning setup with the
added value of explainability. The algorithm is applied to detect anomalies in vibration data from acceleration
sensors or microphones. In a training phase, we transform healthy vibration data into mel-spectrograms and
extract feature patches representing healthy turbines' vibration energy distribution. We determine anomaly
scores by calculating a k-nearest neighbor similarity between operational feature patches and healthy feature
patches. Hence, we use basic statistical methods with interpretable results, which contrasts with deep learning
techniques. The evaluation paradigm is data from damaged and healthy wind turbines and a secondary
machine audio data set. This work introduces and explores a novel sensor-level anomaly score. The model
identified all damaged sequences as anomalies on the wind turbine sequences. Furthermore, the method
achieved competitive results on the more complex DCASE sound anomaly dataset. Concluding, our anomaly
score lays the foundations for an interpretable condition monitoring system.
1 INTRODUCTION
Renewable energy sources drive the energy
transformation and are central for supply reliability.
Applied machine learning and data mining methods
carry the developments of the transitions in the
energy sector (Arnoldt, 2010). The utilization of
unsupervised methods has been a research area for
wind turbines (Sheng, 2014) and multiple
other application domains (Masino, 2017) (Bernhard,
2021/1) (Hofmockel, 2018). Anomaly detection with
structure-born sound data describes detecting
suspicious noises in a sound sequence that differs
from the sound source's common character.
Especially in machine condition monitoring, there is
great economic potential because the standstill of
complex production plants or wind turbines causes
serious economic damage. Data acquisition is a near-
impossible task, as the anomalous samples are sparse
and usually highly diversified. As such, it is difficult
to collect sufficient data samples from the anomaly
class to comprehensively represent the intra-class
variability and the unbalanced domains (Schutera,
2019). The notorious limitations of data acquisition
and sparse target domains in machine learning
(Bernhard, 2021/2) can be coped by unsupervised
learning and encoding approaches (Schutera, 2020).
In the field of acoustic anomaly detection, Gaussian
mixture models (Dufaux, 2000), hidden Markov
models (Chan, 2010), and support vector machines
(Aurino, 2014) are common approaches. In recent
years, neural networks have obtained superior results
by modeling the regular, normal data samples with an
encoder-decoder architecture (Koizumi, 2018)
(Kawaguchi, 2017), using the reconstruction loss as a
cue an anomaly measure. We show that with an
algorithmic simple, density-based k-nearest neighbor
method, we achieve high performance on two data
sets, including different machine types and wind
turbine data. Condition monitoring on wind turbine
gearbox data has been of interest due to the significant
downtime gearbox damages caused (Sheng, 2011/1).
There are different data modalities for condition
monitoring on wind turbine gearboxes, such as
lubricant pressure (Wang, 2016), temperature
monitoring (Feng, 2013), or performance monitoring
Bernhard, J., Schmidt, J. and Schutera, M.
Density based Anomaly Detection for Wind Turbine Condition Monitoring.
DOI: 10.5220/0011358600003355
In Proceedings of the 1st International Joint Conference on Energy and Environmental Engineering (CoEEE 2021), pages 87-93
ISBN: 978-989-758-599-9
Copyright
c
2022 by SCITEPRESS – Science and Technology Publications, Lda. All rights reserved
87

(Sharma, 2013). However, particular interest has been
put into analyzing vibration signals (Zappala, 2014),
which allow for direct sampling of structure-borne
sound from gearbox components. For vibration data
condition monitoring, amplitude analysis on specific
frequency ranges can be used for automatic fault
detection (Antoniadou, 2015). For online fault
detection algorithms, in current work impulse
analysis in the frequency spectrum has been proposed
(Gong, 2014).
In detail, this work examines:
• A density-based k-nearest neighbor anomaly
detection method for wind turbines and
machine vibration data.
• The design and introduction of a sensor-level,
frequency-based explainable anomaly score.
Especially in condition monitoring and predictive
maintenance, the interpretability and explainability of
anomaly scores are important and add value. By
allowing insights into the nature and type of the
detected anomaly, the explainability of the approach
simplifies and supports the maintenance or other
interventions to the monitored machines.
2 DATA
In real-world machine deployment, anomalous
vibration signals are the exception and are of various
kinds; this impedes data acquisition of anomalous
samples. Therefore, the data sets for unsupervised
detection of anomalous vibration signals are
composed of a training set consisting of normal
vibration samples only, a validation and test set
consisting of normal and anomalous samples. In the
following, we outline two data sets with these
required characteristics.
2.1 NREL Wind Turbine
The wind turbine gearbox condition monitoring
vibration analysis benchmarking data sets (Sheng,
2014) consists of data from a stall-controlled, three-
bladed, upwind turbine with a rated power of 750kW
(Sheng, 2011/2). The vibration data of the wind
turbine is collected by three IMI 626B02 and five IMI
626B01 accelerometers, in
. Mounted on the
outside of the gearbox. The sample rate is 40 kHz per
sensor channel. The whole data set comprises ten
healthy H (normal) vibration sequences of one minute
each and ten damaged D (anomalous) vibration
sequences of one minute each. Training is based on
the sequences H1-H4. Validation is based on the
sequences H5-H6 and D1-D2. For testing, the
sequences H7-H10 and D3-D10 are deployed and
evaluated.
2.2 DCASE2020 Anomaly Challenge
Data Set
The unsupervised detection of anomalous sounds
for machine condition monitoring data set (Koizumi,
2019) (Purohit, 2019) consists of data from six
machine types (toy car, toy conveyor, valve, pump,
fan, and Slider) with three to four machine instances.
The whole data set comprises a training set of around
2000 (normal) sequences, a validation set of two
times 100-200 (normal and anomalous) sequences,
and a test set of around 400 (unlabeled) sequences for
each machine instance. Each sequence represents an
audio recording of around ten seconds.
3 ANOMALY DETECTION
ARCHITECTURE
Anomaly detection is a data science discipline that
focuses on finding outlier data points that indicate a
significant deviation towards an underlying
distribution. Hence, the model should learn features
that describe patterns in the training data. The
presence or absence of these patterns in the test data
points helps estimating whether the point is part of the
estimated distribution during training.
This paper uses a density-based anomaly
detection method that incorporates a k-nearest
neighbor search of frequency patterns. First, the data
must be transposed into a fitting feature
representation to create a metric space that is useful
to the model. Transforming the sensor signals into a
mel-spectrogram that comprises the vibration
behavior on different frequency ranges serves this
purpose. Afterward, forming a histogram with fixed
bins for each frequency range converts the
spectrogram data. The following subsections describe
the model's workflow to set up a training library,
depicted in figure 1.
CoEEE 2021 - International Joint Conference on Energy and Environmental Engineering
88
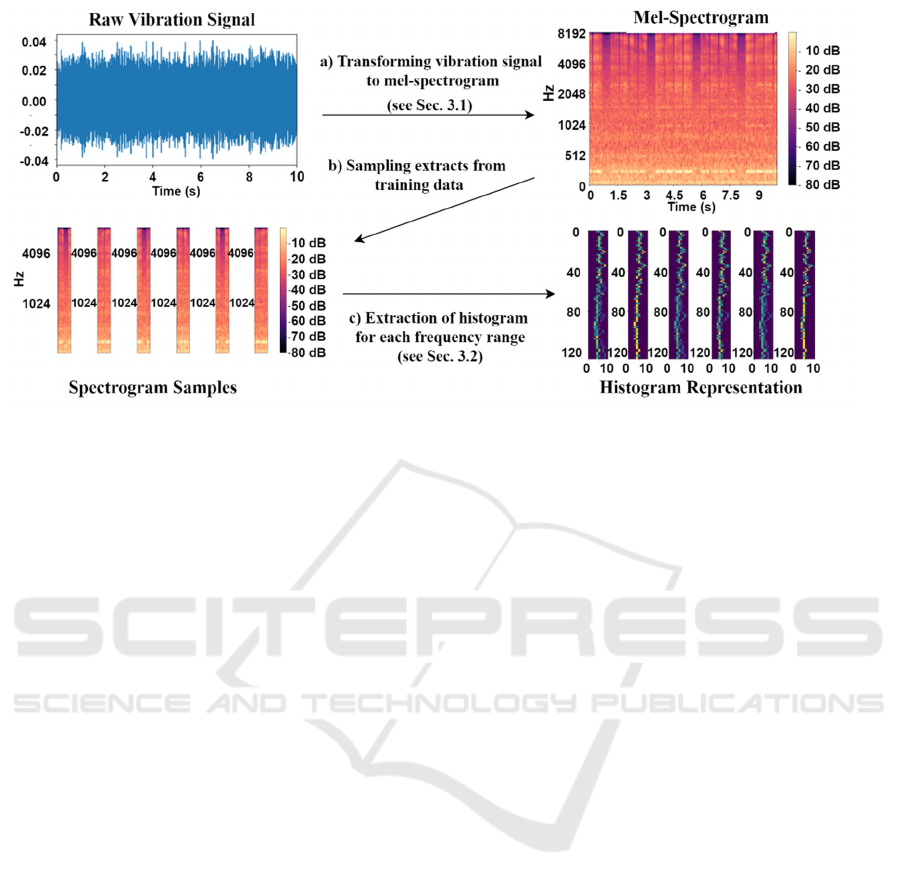
Figure 1. The feature extraction process for the training library. a) Vibration data files are transformed into spectrograms
(mel-spectrogram processing) to provide a detailed representation of the frequency spectrum. b) A library (spectrogram
sampling) that describes normal behavior, consisting of sampled short frames, is set up. c) Each frame translates into the
feature representation by generating a histogram for each frequency bin (frequency band histogram feature extraction).
3.1 Data Preparation
The general audio classification approach extracts
features from the temporal vibration signal specific to
each class. Current state-of-the-art algorithms often
use mel-spectrograms to transform the vibration
signal from time to frequency domain. This time-
frequency representation allows a good extraction of
the frequency patterns and, at the same time, a
dimensional reduction compared to a regular
spectrogram. Log-mel-energies were by far the most
popular feature in DCASE Task 4 (Serizel, 2019). For
a mel-spectrogram, a Discrete Fourier Transform of
the input signal is determined, and the power
spectrum is converted to log-scale. A vibration signal
of a previously defined window length is the input to
calculate the DFT. This window then runs over the
entire file to display the power spectrum change over
time. Based on a person's relative perceived pitch, the
frequencies are then converted into mel-scale,
creating a mel-spectrogram (see figure 1a and
figure 2). Since the frequency resolution is higher in
the lower range and decreases for higher frequencies,
this time-frequency representation is particularly
suitable for machine condition monitoring. Most of
the observed signal's energy is in the lower range.
Finally, the spectrograms for each type of machine
are normalized.
3.2 Feature Extraction
The underlying assumption for the anomaly detection
method in this paper is that the vibration data of
damaged wind turbines will have intensities in
different frequency ranges than the vibration data of
healthy wind turbines. Hence, if over a given time
frame, for normal and anomalous data, a histogram
for a given frequency range displays different value
distributions. Therefore, calculating the distance
between their histograms for each frequency range
yields the spectrograms' similarity. The model
focuses on small extracts with length 𝑙 along the
entire spectrogram's time axis, subsequently denoted
frames (see figure 1b). Hence, with frame length 𝑙, a
spectrogram 𝑺 of size 𝑓𝑛, where 𝑓 denotes the
number of frequency bins, and 𝑛 denotes the total
number of time steps, can be cut into a maximum
of 𝑛𝑙1 frames 𝑬 of size 𝑓𝑙. To create a
feature representation of the value distribution for a
given frame and frequency range 𝑖∈1,…,𝑓, a
histogram 𝒉
,
of row 𝑖 with 𝑏 bins is generated (see
figure 1c). The maximum and minimum intensity
observed on the frequency range of 𝑖 in the training
data equal each histogram's maximum and minimum
values. Therefore, a frame 𝑬 of size 𝑓𝑙 is used to
generate a histogram matrix 𝑯𝒉
,
,…,𝒉
,
of
size 𝑓𝑏.
Density based Anomaly Detection for Wind Turbine Condition Monitoring
89
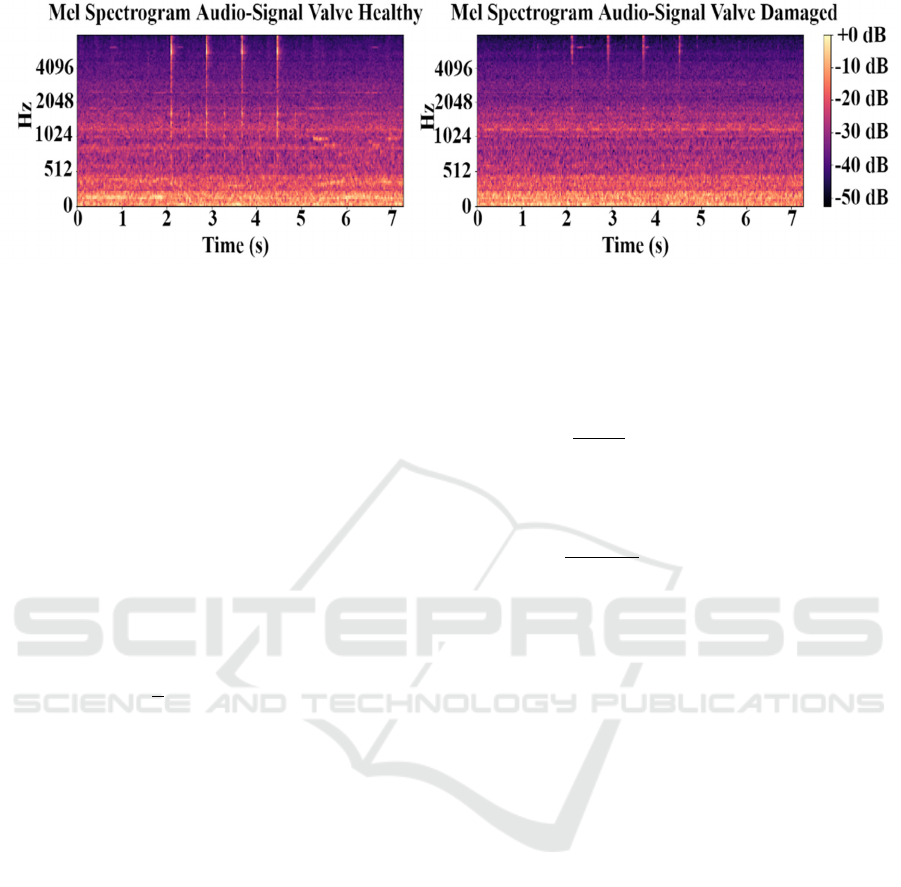
Figure 2. Mel-spectrogram of audio data depicted as frequency (Hz) over time (s). A comparison of healthy and damaged
valve audio data shows the signal’s energy distribution difference.
3.3 Anomaly Score Calculation
To apply a k-nearest neighbor search (see equation
(1)) for anomalies, a set of training features must be
generated describing normal vibration behavior. This
is done by uniformly sampling 𝑣 data points from the
set of all training data frames and converting the
sampled frames to histogram matrices that are added
to the training library ℒ 𝑯
∈,…,
. To get the
anomaly value of a test frame, the frame is
transformed into the histogram matrix 𝑯
. The
anomaly score is then calculated as the average
distance to the k-nearest neighbors:
𝐴
1
𝑘
𝑂𝒅
1
with 𝑑
||𝑯
𝑯
||
being the distance vector from
𝑯
to ℒ and 𝑂𝒅 being a function that arranges the
distance vector 𝒅 in ascending order. For calculating
the anomaly score of a whole test-spectrogram, the
anomaly scores of each frame are evaluated and
averaged.
The whole process of calculating the anomaly score
for a test sequence 𝒙 of arbitrary length is expressed
by the function 𝑀
𝒙
.
3.4 Anomaly Detection Metrics
Metrics for benchmarking anomaly detection systems
are Area Under Curve (𝐴𝑈𝐶, see equation (2)) and
partial Area Under Curve (𝑝𝐴𝑈𝐶, see equation (3)),
which are independent of decision rules and thus
provide a reliable measure for anomaly detection. We
divide the set of test data in 𝒩
(normal) and
𝒩
(anomalous) test data. Let 𝒙
and
𝒙
be the normal and anomalous test sequences
in descending order of their average anomaly score.
By using the flooring function
⌊
∙
⌋
and the step
function 𝐺∙, which is 1 when the input is above 0,
and 0 otherwise, the metrics are defined as:
𝐴𝑈𝐶
1
𝒩
𝒩
𝐺
𝑀𝑥
𝑀
𝑥
𝒩
𝒩
(2)
𝑝𝐴𝑈𝐶
1
⌊
𝑝𝒩
⌋
𝒩
𝐺
𝑀
𝒙
𝑀
𝒙
𝒩
⌊
𝒩
⌋
(3)
We choose 𝑝0.1 and thus estimate how high
the probability is that our model, with a false positive
rate of a maximum of 10%, predicts for a random
normal test sample a lower anomaly score than for a
random anomalous test sample.
4 EXPERIMENTS
The NREL wind turbine data set is split into training
and validation data, as detailed in section 2. Each of
the nine sensor channels initiates the training of a
sensor channel-specific model. Hence, for each time
frame, there are nine individual anomaly scores.
Averaging the anomaly scores provides the
evaluation of the wind turbine's cumulative behavior.
4.1 Training Parameters
The model's performance relies on a set of
hyperparameters that can be adjusted: Number of mels
𝑓 specifies the number of mel-bins, indicating the
frequency resolution on the mel-scale. We use an fft-
length of 1024 with hop size 512 and a Hanning
window (Gautam, 1996). Extract length 𝑙 specifies the
number of time steps that are included in one frame.
CoEEE 2021 - International Joint Conference on Energy and Environmental Engineering
90

Figure 3. Anomaly scores across the sensors with different mounting positions [2] for damaged and healthy wind turbine data.
The sensors’ emerging anomaly pattern potentially supports during troubleshooting and hints at specific failure cases.
During extraction of the frames, we used a stride
parameter of 15 that defines the number of time steps
the window is shifted for the next frame. While a high
𝑙 allows to reduce noise and focus on periodic
patterns, it also bears the risk of significant
anomalous spikes being vanished by normal behavior
before and after. Number of histogram bins 𝑏
specifies the resolution of the intensity distribution.
Choosing 𝑏 allows adjusting the model's sensitivity
towards noise. Number of nearest neighbors 𝑘
specifies the number of training data points for the
anomaly score evaluation. The hardware setup for
training, inference, and evaluation consisted of an
NVIDIA Tesla P100 GPU (16GB GPU memory).
5 RESULTS
5.1 Anomaly Detection Performance
Deployed on the NREL wind turbine data, the model
distinguishes between healthy and damaged samples.
Figure 3 depicts the anomaly scores for damaged and
healthy wind turbine data across all sensor types.
Table 1 shows the averaged anomaly scores for each
sequence with the respective standard deviation. The
model achieves a clear delineation between the
anomalous (anomaly scores approx. 310, see table 1)
and healthy samples (anomaly score approx. 78, see
table 1) of the wind turbine.
Furthermore, the model achieves AUC scores
above 70% and pAUC scores above 65% across all
machine types and IDs on the DCASE2020 data set
(see table 2). Especially machine toy car experiences
robust results, while the machine valve poses a
challenge to the proposed model. The model
outperforms the deep-learning baseline model on
every machine other than slider.
5.2 Model Interpretability
Our model's implementation on the wind turbine data
allows evaluating the vibration behavior on sensor-
level (see figure 3). High anomaly scores on specific
sensors indicate damage location. Our model supports
interpretable anomaly scores in contrast to deep
learning-driven anomaly detection approaches, such
as auto-encoders. High scores can be tracked down to
and explained by the distribution of intensity values
on specific frequency ranges and individual sensors.
Tracking allows the analysis of anomalous patterns
and the comparison with previous occurrences.
Hence, the model detects general anomalies and lays
the foundation for anomaly classification and
prediction.
Table 1. Anomaly score estimation for wind turbine data. Scores are averaged across sensor types and time steps. There is a
clear delineation between the anomaly scores for healthy wind turbine recordings and the anomaly scores for damaged wind
turbine recordings. Training parameters: l = 128, f = 40, b = 8, k = 4.
H7 H8 H9 H10 D3 D4 D5 D6 D7 D8 D9 D10
mean 77.0 77.3 78.0 79.4 309.1 313.4 308.7 305.8 311.7 310.9 313.9 311.9
Std. ±1.01 ±0.96 ±1.26 ±0.88 ±1.03 ±1.01 ±0.92 ±1.05 ±1.05 ±1.10 ±1.05 ±0.92
Density based Anomaly Detection for Wind Turbine Condition Monitoring
91

Table 2. Performance comparison between the proposed model and the DCASE2020 Challenge 2 baseline model (Koizumi,
2020). They implemented a classical deep-learning auto-encoder approach to find anomalous behavior in the sound files. As
a result, the model manages to achieve a significant anomaly detection performance on each machine. Furthermore, the model
outperforms the baseline model on every machine type except slider.
Proposed Model
(ours)
Baseline Proposed Model
(ours)
Baseline
AUC
(%)
pAUC
(%)
AUC
(%)
pAUC
(%)
AUC
(%)
pAUC
(%)
AUC
(%)
pAU
C
(
%
)
Toy Car f = 128 l = 75 b = 10 k = 2 Toy
Conve
y
or
f = 128 l = 70 b = 5 k = 2
ID 1 95.6 80.6 81.4 68.4 ID 1 87.1 71.0 78.1 64.3
ID 2 98.9 94.5 86.0 77.7 ID 2 67.2 52.4 64.2 56.0
ID 3 92.5 78.1 63.3 55.2 ID 3 79.2 66.7 75.3 61.0
ID 4 98.9 96.6 84.5 69.0 Avera
g
e 77.8 63.4 72.5 60.4
Average 96.4 87.5 78.8 67.6
Fan
f
= 128 l= 75 b =
7
k
=4 Pum
p
f
= 128 l= 7
0
b =
7
k
=4
ID 1 60.5 51.9 54.4 49.4 ID 1 76.2 55.4 67.2 56.7
ID 2 89.5 65.9 73.4 54.8 ID 2 83.6 75.8 61.5 58.1
ID 3 78.3 58.9 61.6 53.3 ID 3 94.1 77.1 88.3 67.1
ID 4 81.1 57.0 73.9 52.4 ID 4 78.7 57.5 74.6 58.0
Average 77.3 58.4 65.8 52.5 Average 83.2 66.4 72.9 56.0
lider
f
= 128 l= 75 b = 5
k
=5 Valve
f
= 128 l= 35 b = 1
0
k
=1
ID 1 98.5 93.7 97.0 81.4 ID 1 74.1 55.3 68.8 51.7
ID 2 81.6 65.5 79.0 63.7 ID 2 68.7 51.8 68.2 51.8
ID 3 83.0 55.0 94.3 72.0 ID 3 75.2 51.4 74.3 52.0
ID 4 60.9 51.2 69.6 49.0 ID 4 62.8 48.6 53.9 48.4
Avera
g
e 81.0 66.3 84.8 66.5 Avera
g
e 70.2 51.8 66.3 51.0
6 DISCUSSION
We introduce a method for effective fault detection on
vibration data with this work. The proposed method
uses spectrogram transformations of the input signal
to automatically extract healthy signals'
characteristics over the whole frequency spectrum by
building histogram representations. The analysis
pipeline can identify the core frequency windows and
characteristics without prior knowledge of the
underlying mechanical system.
Using the k-nearest neighbor anomaly detection
method, the systems deployment signals are examined
for damages or malfunctions. This method was tested
on sound signals and vibration signals to prove its
viability.
There is a range of potential future work to
improve the presented approach: Starting with
deploying the approach to related areas, such as
premature fault prediction or supervised fault
classification by comparing the extracted features of
1
An interactive implementation of the model can
be found in: https://github.com/VanLock9988/
Vibration_Data_Anomaly_Detection
deployment data to previously observed features.
Another extension introduces the ability to recognize
long-term dependencies by estimating conditional
distributions. Not only recognizing anomalous
frequency patterns but also anomalous sequences of
frequency patterns.
We are confident that this work supports
practitioners when deploying condition monitoring or
predictive maintenance algorithms
1
. Further, we hope
to stimulate research on overcoming the restrictions
imposed by unbalanced domains in acoustic anomaly
data sets while ensuring interpretability.
REFERENCES
Antoniadou, I., Manson, G., Staszewski, W. J., Barszcz, T.,
& Worden, K. (2015). A time-frequency analysis
approach for condition monitoring of a wind turbine
gearbox under varying load conditions. (Elsevier, Ed.)
Mechanical Systems and Signal Processing, 64, 188-
216.
CoEEE 2021 - International Joint Conference on Energy and Environmental Engineering
92

Arnoldt, A., König, S., Mikut, R., & Bretschneider, P.
(2010). Application of Data Mining Methods for Power
Forecast of Wind Power Plants. Proc., 9th International
Workshop on Large-scale Integration of Wind Power
and Transmission Networks for Offshore Wind Farms,
Quebec.
Aurino, F., Folla, M., Gargiulo, F., Moscato, V., Picariello,
A., & Sansone, C. (2014). One-class SVM based
approach for detecting anomalous audio events.
International Conference on Intelligent Networking and
Collaborative Systems, (pp. 145-151). IEEE.
Bernhard, J., Schulik, T., Schutera, M., & Sax, E. (2021/2).
Adaptive test case selection for DNN-based perception
functions. IEEE International Symposium on Systems
Engineering (ISSE), (pp. 1-7). IEEE.
Bernhard, J., Schutera, M., & Sax, E. (2021/1). Optimizing
test-set diversity: Trajectory clustering for scenario-
based testing of automated driving systems. IEEE
International Intelligent Transportation Systems
Conference (ITSC), (pp. 1371-1378). IEEE.
Chan, C. F., & Eric, W. M. (2010). An abnormal sound
detection and classification system for surveillance
applications. 18th European Signal Processing
Conference, (pp. 1851-1855). IEEE,
Chang, F. K., Markmiller, J. F., Yang, J., & Kim, Y. (2011).
Structural health monitoring. System health
management: with aerospace applications. John Wiley
& Sons.
Dufaux, A., Besacier, L., Ansorge, M., & Pellandini, F.
(2000). Automatic sound detection and recognition for
noisy environment. 10th European Signal Processing
Conference. IEEE.
Feng, Y., Qiu, Y., Crabtree, C. J., Long, H., & Tavner, P. J.
(2013). Monitoring wind turbine gearboxes. (W. O.
Library, Ed.) Wind Energy, 16(5), 728-740.
Gautam, J. K., Kumar, A., & Saxena, R. (1996). On the
modified Bartlett-Hanning window (family). IEEE
Transactions on Signal Processing, 44(8), 2098-2102.
Gong, X., & Qiao, W. (2014). Current-based mechanical
fault detection for direct-drive wind turbines via
synchronous sampling and impulse detection. (IEEE,
Ed.) IEEE Transactions on Industrial Electronics, 62(3),
1693-1702.
Hofmockel, J., & Sax, E. (2018). Isolation Forest for
Anomaly Detection in Raw Vehicle Sensor Data.
International Conference on Vehicle Technology and
Intelligent Transport Systems (VEHITS).
Kawaguchi, Y., & Endo, T. (2017). How can we detect
anomalies from subsampled audio signals? 27th IEEE
International Workshop on Machine Learning for
Signal Processing (MLSP), (pp. 1-6). IEEE.
Koizumi, Y. a. (2018). Unsupervised detection of
anomalous sound based on deep learning and the
neyman- pearson lemma. IEEE/ACM Trans-actions on
Audio, Speech, and Language Processing. 27(1), 212-
224.
Koizumi, Y., Saito, S., Uematsu, H., Harada, N., & Imoto,
K. (2019). ToyADMOS: A dataset of miniature-
machine operating sounds for anomalous sound
detection. IEEE Workshop on Applications of Signal
Processing to Audio and Acoustics (WASPAA), (pp.
313-317). IEEE.
Koizumi, Y., Kawaguchi, Y., Imoto, K., Nakamura, T.,
Nikaido, Y., Tanabe, R., ... & Harada, N. (2020).
Description and discussion on DCASE2020 challenge
task2: Unsupervised anomalous sound detection for
machine condition monitoring. arXiv preprint
arXiv:2006.05822.
Masino, J., Pinay, J., Reischl, M., & Gauterin, F. (2017).
Road surface prediction from acoustical measurements
in the tire cavity using support vector machine. Applied
Acoustics, 125 41-48.
Purohit, H., Tanabe, R., Ichige, K., Endo, T., Nikaido, Y.,
Suefusa, K., & Kawaguchi, Y. (2019). MIMII Dataset:
Sound Dataset for Malfunctioning Industrial Machine
Investigation and Inspection. Proceedings of the
Detection and Classification of Acoustic Scenes and
Events 2019 Workshop (DCASE2019), (pp. 209-213).
Schutera, M., Hafner, F. M., Vogt, H., Abhau, J., & Reischl,
M. (2019). Domain is of the Essence: Data Deployment
for City-Scale Multi-Camera Vehicle Re-Identification.
16th IEEE Inter-national Conference on Advanced
Video and Signal Based Surveillance (AVSS). (pp 1-6).
IEEE.
Schutera, M., Hussein, M., Abhau, J., Mikut, R., & Reischl,
M. (2020). Night-to-Day: Online Image-to-Image
Translation for Object Detection Within Autonomous
Driving by Night. IEEE Trans-actions on Intelligent
Vehicles.
Serizel, R., & Turpault, N. (2019). Sound event detection
from partially annotated data: Trends and challenges.
IcETRAN conference.
Sharma, S., & Mahto, D. G. (2013). Condition monitoring
of wind turbines: a review. Global Journal of
Researches in Engineering, Mechanical and Mechanics
Engineering, 13(6).
Sheng, S. (2011/2). Investigation of various condition
monitoring techniques based on a damaged wind turbine
gearbox (No. NREL/CP-5000-51753). National
Renewable Energy Lab.(NREL), Golden, CO (United
States).
Sheng, S. (2014). Wind turbine gearbox condition moni-
toring vibration analysis benchmarking datasets.
National Renewable Energy Laboratory, Golden.
Sheng, S., Link, H., LaCava, W., van Dam, J., McNiff, B.,
Veers, P., ... & Oyague, F. (2011/1). Wind turbine
drivetrain condition monitoring during GRC phase 1
and phase 2 testing (No. NREL/TP-5000-52748).
National Renewable Energy Lab.(NREL), Golden, CO
(United States).
Wang, L., Zhang, Z., Long, H., Xu, J., & Liu, R. (2016).
Wind turbine gearbox failure identification with deep
neural networks. IEEE Transactions on Industrial
Informatics, 13(3), 1360-1368.
Zappalá, D., Tavner, P. J., Crabtree, C. J., & Sheng, S.
(2014). Side-band algorithm for automatic wind turbine
gearbox fault detection and diagnosis. (W. O. Library,
Ed.) IET Renewable Power Generation, 8(4), 380-389.
Density based Anomaly Detection for Wind Turbine Condition Monitoring
93
