
Energy Optimized Routing for E-Vehicles
David Suske
*
, Alexander Sohr and Eric Neidhardt
DLR Institute of Transport Systems, German Aerospace Center, Germany
Keywords: Navigation systems, Electric vehicles, Engine-efficiency.
Abstract: The demand for routing tailored to electric vehicles will increase in the future due to the increasing number
of users of electric vehicles. A growing number of people will face the same problem. What is the fastest
energy-optimized route for my electric car to my destination? This paper describes the factors that influence
the energy-optimized routing of electric vehicles. In particular, it shows how the influencing factors are used
in routing and how they can be mathematically combines to obtain a general description. The influencing
factors: topology of charging stations, energy consumption, topology of infrastructure, seasonal dependency
and individual driving behavior are described. Furthermore, this paper shows the interactions between the
factors. A new method for determining necessary edge weights is then presented mathematically in general.
This weighting function was developed in the DLR project "Vehicle Intelligence and Smart Gearing" using
empirical data analysis. The resulting equation can be applied iteratively to existing routing graphs to
determine qualified edge weights. Existing current methods for routing are using the manufacturer
information for the power consumption per 100 kilometers to generate a weight for their edges on the routing
graph. Since consumption is only measured by the distance travelled, the shortest distance is always the one
with the lowest energy consumption. Furthermore, in existing systems, the consumption is always constant
for the same distance. This does not correspond to reality, since the range or consumption can increase or
decrease with temperature differences. In addition, manufacturers of electric vehicles produce standardized
consumption values that are generated under laboratory conditions and cannot be reproduced in reality. This
paper shows how a single function can look like that mathematically combines different influencing factors.
This result can be applied to existing routing systems to generate new, more qualified edge weights for energy-
optimized routing.
1 INTRODUCTION
Rising sales of electric vehicles result in an increasing
number of routing requests. In addition to
conventional questions like the shortest and fastest
route, the focus here is also on the most energy-
efficient route (Rubel, 2018).
Figure 1 shows the half-year report on the
development of electric mobility presented by the
Center of Automotive Management (CAM) at the
Bergisch Gladbach University of Applied Sciences.
The experts around Prof. Dr. Stefan Bratzel analyse
and assess the sales trends in important global
automotive markets in the first half of 2018 and 2017.
Despite the increasing sales figures shown above and
the continuous improvement of the charging
infrastructure, the challenge of e-routing will remain
in the coming years. The characteristics of this route
and the associated challenges of electro-mobility are
far more complex than those of conventional
vehicles. Both the range of the vehicles and the
availability of possible charging stations are the
central questions of route selection (Rubel, 2018). But
there are other dependencies that influence the choice
of route. This report defines and describes factors
influencing the choice of route. Furthermore, it is
shown how these are to be considered in a routing.
Regional and seasonal differences as well as
individual driving behavior are taken into account in
order to create an energy-optimized route.
62
Suske, D., Sohr, A. and Neidhardt, E.
Energy Optimized Routing for E-Vehicles.
DOI: 10.5220/0011358000003355
In Proceedings of the 1st International Joint Conference on Energy and Environmental Engineering (CoEEE 2021), pages 62-67
ISBN: 978-989-758-599-9
Copyright
c
2022 by SCITEPRESS – Science and Technology Publications, Lda. All rights reserved
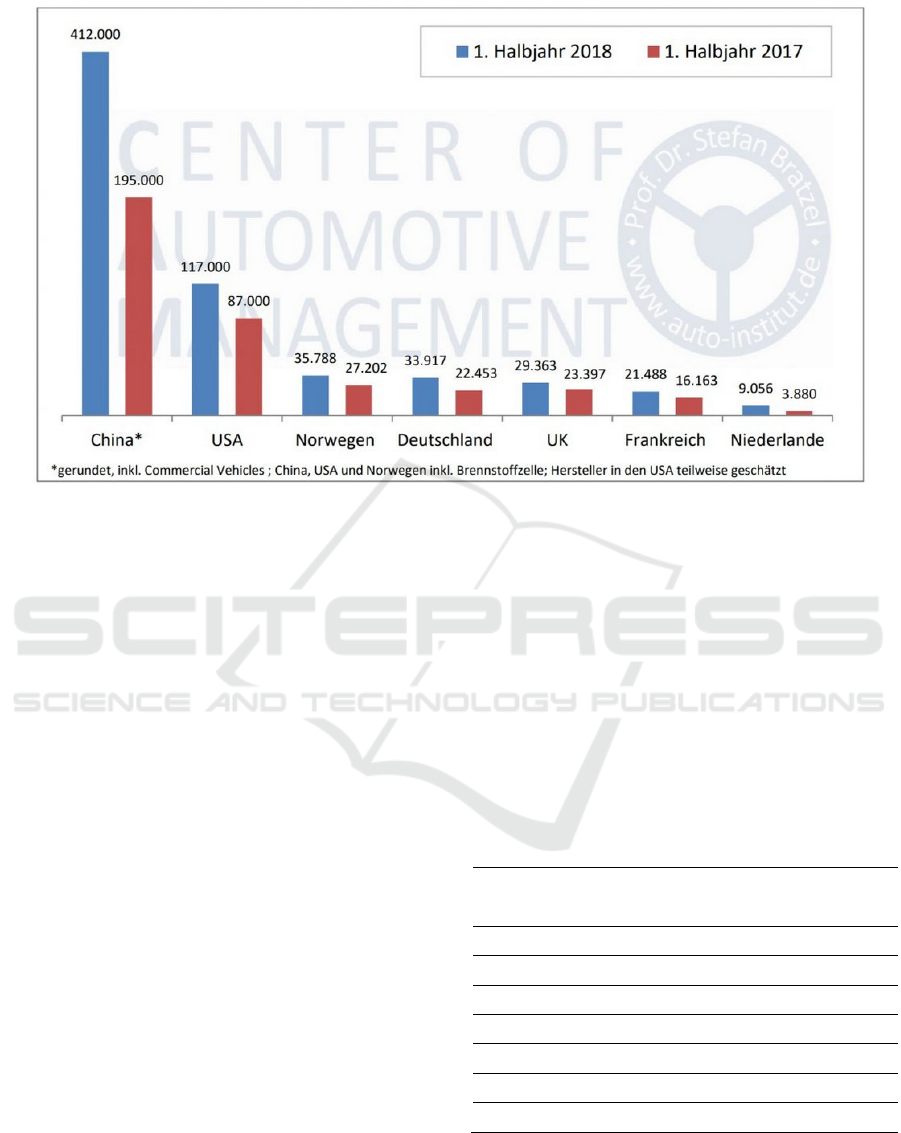
Figure 1. Sales trends for electric cars in key markets 2018/18 Hbj.1 (Bratzel, 2018)
2 INFLUENCING FACTORS
This chapter describes influencing factors when
selecting a route for electric vehicles. Each of the
following paragraphs describes a criterion for the
range of electric vehicles.
2.1 Topology of Charging Stations
The range of an electric vehicle is arbitrarily large.
Insofar as the vehicle is ready for operation and a
charging station is within range. For longer journeys,
the distribution of the charging stations is therefore
very important for the choice of route. It is essential
to consider any side effects of the route selection. The
lack of charging infrastructure can be fatal, especially
for less experienced users. For example, a route to a
less serviced area can often be found at charging
stations and the routing request would then be
completed. However, the remaining state of charge of
the vehicle may no longer be sufficient to reach the
next charging station. In this case, the suggested route
should draw attention to the problem that no charging
station can be reached from the destination.
2.2 Energy Consumption
The consumption of electric vehicles is expressed in
standard values and is not uniquely defined for
manufacturer or type (Hiller, 2018). For reasons of
increased sales, it is conceivable that strongly
optimized boundary conditions will be used as the
basis for the calculations. For the small car Nissan
Leaf, for example, this is 15 kWh per 100 kilometers,
for the electric Golf VW gives 12.7 kWh (Hiller,
2018). These standard values often do not correspond
to the real consumption of these vehicles. The
following is an overview of the standard values for
the vehicles with the highest sales volume according
to the CAM study (Bratzel, 2018).
Table 1. Consumption of electric vehicles (Bratzel, 2018).
Vehicle
Manufacturer
Consumption / 100 km
Tesla Model S P90D 22 kWh
Ranault Zoe 14,6 kWh
Nissan Leaf 15 kWh
Mitsubishi-MiEV (FL) 13,5 kWh
BMW i3 12,9 kWh
E-Golf 12,7 kWh
Mercedes B-Class ED 16,6 kWh
Table 1 shows the values according to the
manufacturer's own specifications. In addition to
these figures, independent methods according to
WLTP and NEDC promise more precise figures for
actual consumption. Worldwidmonized Light(-Duty)
Energy Optimized Routing for E-Vehicles
63

Vehicles Test Procedure, WLTP for short, is the new
standard test procedure that is intended to provide
realistic data on the fuel consumption of electric
vehicles and other passenger cars. The NEDC (New
European Driving Cycle), which has been in force
since 1992 and is not very accurate, will be gradually
replaced by September 1, 2018. Germany is regarded
as a global pione Hareer in the changeover. The
source (Kammerer, 2018) shows the differences
between the test cycles and how the new WLTP value
will affect the future. The fact is that these
measurements and efforts will not be able to
withstand a real measured value and experience, as
further criteria influence consumption and the
associated range (Kammerer, 2018).
2.3 Topology of Infrastructure
The construction of the roads and their gradients also
result in considerable differences in the choice of
route. As can be seen from the publication
"Topographic maps for greater range of the ECar"
(Spanik, 2018). In the BMW i3, for example, the fuel
consumption values per 100 km are almost twice as
high when driving uphill (Spanik, 2018). It also
depends on the vehicle how much energy can be
recovered when driving downhill. The exact creation
of a database for the construction of the road network
is therefore essential for choosing the right route.
Especially with an energy-optimized routing, height
differences have to be considered.
2.4 Seasonal Dependency
The seasonal dependency of the route choice refers to
the different consumption of energy in the seasons.
The electrical consumption for comfort components
in the vehicle, such as air-conditioning systems, is
usually higher in seasons such as winter and summer.
Tesla models, such as the Model S, heat not only the
interior, but also the battery if necessary. If the battery
is cold, kilometers are lost that are more than the lost
heat output (Becker, 2018).
The ADAC tested the loss in winter on a
Mitsubishi i-MiEV as an example and came to the
following verdict (Butz, 2018):
At speeds around 100 km/h, the relative losses in
range are still comparatively low:
• At 20 degrees, the electric car can travel 91
kilometers.
• At 0 degrees, it can cover 82 kilometers.
• At minus 20 degrees it's still 70 kilometers.
A much higher loss of range, on the other hand,
can be seen at speeds of 30 km/h:
• At 20 degrees, the electric car covers 188
kilometers.
• At 0 degrees it achieves 93 kilometers.
• At minus 20 degrees it's still 68 kilometres.
Inner cities at 50 km/h are therefore likely to
suffer greater losses in range due to seasonal
influences than on the motorway. This in turn
influences the choice of route.
2.5 Individual Driving Behavior
The individual driving behavior of individuals also
affects the fuel consumption or range and the
associated route selection of an electric vehicle.
Features such as time and driving style play a role
here. If, for example, a restrained driver drives to
work with a prudent driving style, it will consume less
electricity than a notorious speedster that accelerates
a lot. Furthermore, a prudent driver can also become
a high consumer if he is under time stress and wants
to reach his destination quickly. Similar rules apply
here as with conventional combustion engines in
order to increase the range: (Greenfinder, 2018)
• Quiet and prudent driving
• Drive in anticipation
• Avoid strong accelerations
• The lower the speed, the lower the energy
consumption
This behavior is still encouraged by some
manufacturers. With different driving modes, such as
Comfort, EcoPro and EcoPro+, as is possible with the
BMW i3, for example. In electric cars, the so-called
recuperation effect takes effect. This means that some
of the energy generated by the braking effect of the
engine is fed back into the battery. The energy
recovered in this way extends the range of the electric
car. If, on the other hand, you step too hard on the
brake, energy is also generated, but in this case, as
with combustion engines, it is released more in the
form of warmth and can no longer be used as well
(Greenfinder, 2018).
3 ENERGY-OPTIMIZED ROUTES
In this chapter, the previously described
dependencies for energy-optimized routing for e-
vehicles are put into context. It also describes how
influencing factors can influence each other.
Furthermore, the procedure for implementing an
energy-optimized routing is described.
3.1 Interactions
CoEEE 2021 - International Joint Conference on Energy and Environmental Engineering
64

In order to find the best possible energy-optimized
route, it is not sufficient to optimize the criteria for
route enquiries in terms of range mentioned in
Chapter 2. The topology of the charging stations does
not initially play a role in energy-optimized routing,
as this does not influence energy consumption.
However, if this criterion is not met in sufficient
numbers within the start/finish relationship, no
routing is possible. Therefore, the existence of a
charging infrastructure is absolutely necessary for the
consideration of an energy-optimized route.
The data on energy consumption could also not be
used for energy-optimized routing. As Section 2.2
shows, the data on the standard values of the
individual vehicles are not very accurate. If these
values were used to determine a low-consumption
route, the shortest route would always be found.
Sections 2.3 to 2.5 show that the shortest route does
not have to be the most energy efficient.
Nor can it be generalized that, as shown in section
2.3, a flat straight route is more energy efficient than
a winding route. On a very twisty route that has no
vertical meters, section 2.5 may be more effective
than section 2.3. The topology of the network
therefore requires the driver to be slower, more
prudent and more forward-looking. Furthermore,
section 2.4 shows that the weather can also influence
the most energy efficient route.
3.2 Procedure
The theoretical implementation of an energy-
optimized routing for electric vehicles is only
possible with a sensible weighting of the influencing
factors. The following influencing factors can be
derived from the literature: (Bratzel, 2018)
(Kammerer, 2018) (Spanik, 2018) (Becker, 2018)
(Butz, 2018) (Greenfinder, 2018)
• Existence of charging infrastructure
• Travel speed
• Structure of the road network (angle of
vertical meters, angle between edges)
• Outside temperatures
• Driving behavior
• Energy consumption of comfort
components
The weighting of the influencing factors is based
on a percentage distribution of the empirical values
described in the literature and is not supported by
empirical data. Table 2 below shows the weighting
ratio for the influencing factors.
Table 2. Weighted influencing factors.
Influencing factor Influence in percent (%)
Existence of charging
infrastructure
-
Travel speed 30
Construction of the road
network
30
Outdoor temperatures 20
Driving behavior 15
Comfort components 5
A routable graph is created according to this
model. The graph evaluates a node and edge topology
according to the following algorithm. This applies to
all edges (n) in a routable graph. The individual
weight of the influencing factors is determined with
points from 0 to 100. The points are then weighted in
percent based on their influence. The lower the score
of the individual influencing factors, the lower the
resulting edge weight for routing. Thus the value 0 is
to be understood as optimal and 100 as worst value
for the individual evaluation.
1. The velocity on the edge (n) is linearly assigned
to the point values from 0 to 100, where applies:
𝑓
(
𝑥
)
=
x if 0≤𝑥≤100
100 𝑥>100
{ x ∈ N ∪ {0}}
(1)
2. Slope of the edge (n) in f(x)=
()
()
∗
100 %
(2)
Linear equation for the determination of points:
y = m*x +n
m=
(3)
n = 50
(4)
x =
(
)
(
)
∗ 100
(5)
f
(
x
)
=
0 x<−100
∗
(
)
(
)
∗ 100
+ 50 if −100≤x≤100
100 x>100
(6)
The result of this equation is that at a gradient of
45 degrees or 100 percent, the maximum worst
value is assumed to be 100, while at a gradient of
45 degrees, the maximum best value is assumed
to be 0.
Energy Optimized Routing for E-Vehicles
65

3. The outside temperature is assumed to be optimal
at 20 degrees. Values left and right of x = 20
worsen the scoring again. With less than minus
20 degrees and more than +60 degrees the
maximum worst value of 100 is reached (Butz,
2018).
f
(
x
)
=
100 x< −20
0,05 ∗ (x − 20)² if −20≤x≤60
100 x>60
(7)
The function corresponds to the illustration of a
parabola shifted by 20 on the X axis and
compressed by 0.05.
4. The driving behavior is classified into 5 levels,
which are shown in table 3:
Table 3. Driving behavior point table.
Behavior Points
Looking foresighted 0
Less foresighted 25
Average 50
Less aggressive 75
Aggressive 100
The driving behavior must be defined by the user
himself before routing. In the case of larger
amounts of data, a mechanical evaluation using
"Deep Learnin" is conceivable. For this purpose,
the individual driving behavior is classified by a
neural network.
5. The use of comfort components is listed in table
4 and the totals of the points are then added.
Table 4. Points for comfort components.
Comfort components Points
Air conditioning 50
Seat heating 30
Light 15
Radio 5
The comfort components used must be specified
during routing. The selection is implemented via
a check box, the sum of which is the weight for
this influencing factor.
6. The last influencing factor is the presence of a
charging infrastructure during and after the
journey. For this purpose, the energy
consumption described in Chapter 2.2 according
to WLTP, if not available according to NEDC or
as a last possibility the manufacturer's data, is
taken to 100 km. Due to the inaccuracy, the value
is increased by 20 percent. The algorithm
determines the consumption after each edge and
searches for a charging station if the vehicle has
only 20 percent of its load left. In addition, at
least 10 percent of the load must still be present
at the destination so that the driver can safely
leave the destination again. If these criteria
cannot be met. Then the lack of the charging
infrastructure is to be regarded as a KO criterion
and no route to the destination can be found.
On the basis of the points to be determined for
each influence criterion, the weight for the edge is to
be determined by means of the following weighting
function. For a = speed, b = structure of the road
network, c = outside temperatures, d = driving
behavior and e = comfort components.
f
(
x
)
=
(
a∗0,3
)
+
(
b∗0,3
)
+
(
c∗0,2
)
+
(
d∗
0,15
)
+
(
e ∗ 0,05
)
(8)
Each influencing factor can only take values
between 0 best and 100 worst. Thus, the weight of the
edge is defined in the closed interval from 0 to 100.
The new weight of the edge is taken into
consideration during routing and results in the most
energy-optimal route.
4 CONCLUSION
The demand for energy-optimized routes for e-
vehicles increases with the number of vehicles sold.
Conventional questions about the fastest or shortest
route are more sufficient for the user. Especially
because of the often still short range of electric
vehicles, the question of the lowest possible
consumption is at the forefront of the considerations.
Optimizing fuel consumption means increasing the
range.
Chapter 2 describes dependency factors for this
question. Each criterion is decisive for the choice of
route. The necessity of the inclusion is explained in
the respective sections. This shows that it is not only
the infrastructure that can influence the most energy-
efficient route. Environmental influences and
individual factors also play a role.
Chapter 3 compares the dependencies between the
influencing factors. For example, bad weather
influences one's own driving behavior towards a
quieter driving style. This in turn has a positive effect
on the choice of route. It also shows that not all
influencing variables may be weighted equally. For
example, the difference in altitude of a route from
start to finish has a greater influence on the most
energy-efficient route than driving with or without air
conditioning.
Section 3.2 describes the weighting for the
influencing factors as well as the functions for
determining the point values for each criterion. The
CoEEE 2021 - International Joint Conference on Energy and Environmental Engineering
66

algorithm described in this chapter can be applied to
a routable graph to demonstrate energy optimized
routing for an electric vehicle.
REFERENCES
Rubel B Elektroautos: zweistellige wachstumsraten, 25
millionen neufahrzeuge ab 2025 [Internet]. (2018).
cited 2020, Available from:
https://www.mobilegeeks.de/artikel/elektroautos-
marktanalyse-halbjahr-2018/
Hiller S E-Autos: Verbrauch, Kosten und Umweltbilanz im
Überblick [Internet]. (2018). cited 2020, Available
from: https://www.polarstern-
energie.de/magazin/artikel/elektroautos-zukunft-
automobile/
Bratzel S Center of Automotive Management
Electromobility Report [Internet]. (2018). cited 2020,
Available from: https://auto-institut.de/e-mobility/
Kammerer S Elektroauto reichweite zyklen epa, nefz, wltp
& rde im vergleich [Internet]. (2018). cited 2020,
Available from:
https://www.homeandsmart.de/elektroauto-reichweite-
wltp-nefz-epa-rde-vergleich-uebersicht
Spanik C Elektromobilität [Internet]. (2018). cited 2020,
Available from: https://intelligente-
welt.de/elektromobilitaet/#more-12935/
Becker L 2018 E-autos-im-winter, cited 2020, Available
from: https://www.zdf.de/nachrichten/heute/e-autos-
im-winter-100.html
Butz L Elektroautos im winter: praktische tipps zur
reichweite [Internet]. (2018). cited 2020, Available
from: https://aiomag.de/so-machen-sie-das-e-auto-fit-
fuer-den-winter-2819
Greenfinder Möglichkeiten die reichweite von elektroautos
zu erhöhen [Internet]. 2018, cited 2020, Available
from: https://www.greenfinder.de/e-autos/e-auto-
ratgeber/tanken-laden/reichweitenvergroesserung
Energy Optimized Routing for E-Vehicles
67
