
Research on the Effect of Psammotherapy on the Pulsating Flow of
Conical Curved Femoral Artery
Rongchang Fu
a
and Xiaoke Han
b
School of Mechanical Engineering, Xinjiang University, Huarui Street777, Urumqi, China
Keywords: Fluid-Solid Coupling, Wall Shear Stress, Tapered Blood Vessel, Psammotherapy, Von-Mises Equivalent
Stress.
Abstract: Objective This paper is to study the effect of psammotherapy on the hemodynamicsof the conical curved tube
of the femoral artery in humans, and further reveal the mechanism of psammotherapy from the perspective of
hemodynamics. Methods Based on CT images of the human aorta, a three-dimensional finite element model
of the conical curved tube of the femoral artery was established, and the heart rate, the peak velocity and the
inner diameter of the femoral artery measured in the experiment were used as initial conditions and boundary
conditions for finite element numerical simulation, then the blood flow velocity, wall shear stress and Von
Mises stress of curved blood vessels before and after psammotherapy were obtained and compared. Results
The blood flow velocities of the conical curved femoral artery increased by 18%, 29%, 19% and 45% at
t=0.15 min, 0.30 min, 0.45 min and 0.60 min after psammotherapy compared with before psammotherapy;
the flow velocity of secondary reflux was significantly weakened, and the wall shear stress increased by 18%,
5%, 13%, and 14%, respectively; Von-Mises stress increased by 189%, 115%, 84%, and 338%, respectively.
Conclusion Research shows that psammotherapy can improve the fluidity of the femoral artery blood and
increase the wall shear stress, which has a corresponding improvement effect on the prevention of the
deposition of substances in the arteries; the phenomenon of secondary reflux velocity after psammotherapy is
significantly reduced to avoid the deposition of substances in the blood, and it has a certain clinically positive
effect on preventing the formation of atherosclerosis, but after psammotherapy , the Von-Mises equivalent
stress increases and the increase is also relatively large, indicating that psammotherapy has a potential risk of
vascular rupture.
1 INTRODUCTION
With the acceleration of the pace of modern life,
people's pressure is increasing rapidly, and the body
and mind are exhausted. Therefore, physical therapy
has attracted more and more attention.
Psammotherapy derived from the unique warm
temperate arid desert climate in Turpan, Xinjiang,
China is a kind of physical therapy. As it has no side
effects, and can improve blood circulation, promote
metabolism, and strengthen the body, loses weight,
beauty, and health care, it is loved by lots of people.
According to statistics, there are about 50,000 people
who have psammotherapy in the psammotherapy
center of Turpan Uyghur Hospital every year.
Psammotherapy is a method of curing diseases by
a
https://orcid.org/0000-0002-7045-7597
b
https://orcid.org/0000-0001-6587-0574
burying sand. Its principle is to use the naturally
formed magnetic sand to comprehensively act on the
human body through heat transfer, magnetic field
action, and sand action force, so as to get rid of illness
and keep fit (Kurban 2011). The influencing factors
of psammotherapy are complex and involve many
disciplines, so it is difficult to explore the mechanism
of its curative effect. Scholars at home and abroad
have carried out research on the curative effect
mechanism of psammotherapy from the aspects of
heat transfer, bone mechanics, clinical medicine, etc.
Nyazi Aishan (Niaz
2002)
research has shown that
psammotherapy is effective for various types of
Osteoarthrltis (OA) and other types of rheumatic
diseases. In addition, changes in hemorheology
indicators are correlated with the occurrence,
Fu, R. and Han, X.
Research on the Effect of Psammotherapy on the Pulsating Flow of Conical Curved Femoral Artery.
DOI: 10.5220/0011316200003444
In Proceedings of the 2nd Conference on Artificial Intelligence and Healthcare (CAIH 2021), pages 261-268
ISBN: 978-989-758-594-4
Copyright
c
2022 by SCITEPRESS – Science and Technology Publications, Lda. All rights reserved
261
development, treatment and prevention of OA
(Chang, Chang, Xu
2009),
therefore, relevant
scholars are engaged in research to reveal the
therapeutic mechanism of psammotherapy from
hemorheology and hemodynamics. Wei Rong et al.
(Wei, Mahemuti, Yang
2009)
studied the
hemorheology and hemodynamics of rabbit knee
osteoarthritis through experiments in New Zealand
rabbit, their research has pointed out that
psammotherapy can improve the whole blood
viscosity index of model animals; in addition, it can
speed up the blood flow in the femoral artery of the
lower limbs at the sand-buried site and reduce
vascular resistance. Bureby Yiming et al. (Yiming, Fu
2016)
studied the effect of psammotherapy on the
hemodynamics of the human femoral artery
bifurcation under the condition of fluid-solid
coupling. However, in the current study to reveal the
mechanism of psammotherapy curative effect from
the perspective of hemodynamics, the three-
dimensional finite element model of blood vessels has
not been taken into account the taper of blood vessels,
and the blood was supposed as Newtonian fluid.
Moreover, arterial diseases mostly occur at the places
where the geometric shape of arteries changes,
namely, the stenosis, bifurcation and curvature of
vessels (Xu, Guo, Wang
2017)
. Therefore, exploring
the influence of psammotherapy on the
hemodynamics of conical curved tubes based on non-
Newtonian fluids is one of the focuses of this paper.
Based on the experimental research, this paper studies
the distribution of blood flow field, wall shear stress
and Von-Mises equivalent stress in the conical vessel
of the femoral artery before and after psammotherapy
based on non-Newtonian fluids, so as to provide a
theoretical basis for revealing the therapeutic
mechanism of psammotherapy on vascular diseases.
2 MATERIALS AND METHODS
2.1 Geometric Model
CT was used to collect real human lower limb images,
apply medical image processing software to extract
femoral artery blood vessels, and then reverse
engineering method (Schulze-Bauer, Morth,
Holzapfel 2003
)
was applied to segment and smooth
the femoral artery conical tube, and the three-
dimensional reconstruction model of the fluid domain
(blood flow) of the blood vessel was constructed
under the condition of maintaining the original
physiological and anatomical characteristics. The
reverse engineering method reference (Zhang, Zhang,
Gao 2002) was used to study the femoral artery. a
blood vessel wall with a thickness of 1 mm was
constructed, and a three-dimensional geometric
model of the blood vessel wall was obtained, as
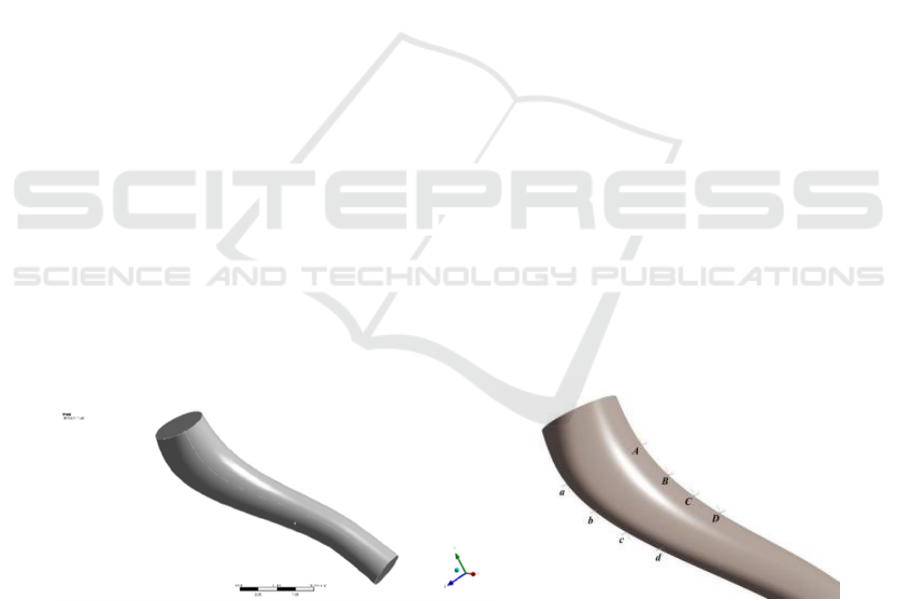
shown in Figure 1. The place where the geometric
shape of the conical curved femoral artery changes is
prone to more complicated flow conditions (Yang,
Yu, Liu, Hong 2014), and many vascular and blood
diseases often occur in such places, so the inner and
outer sides of the conical curved femoral artery were
selected as monitoring points. The inner monitoring
points are A, B, C, D and the outer monitoring points
are a, b, c, d, and they are distributed along the taper,
mainly to monitor the time-varying fluid velocity of
these points.
Figure 1: Three-dimensional geometric model of blood vessel.
2.2 Finite Element Calculation
The finite element analysis software ICEM meshing
was used for meshing, and ANSYS 18.0 was used for
bidirectional fluid-solid coupling analysis. The fluid-
solid coupling calculation mainly used the fluid
solver and the solid structure solver to calculate the
fluid-solid interaction problem at the same time. The
fluid solver mainly calculated physical quantities
such as pressure, velocity, temperature, and
composition of the flow field, while the solid
structure solver calculated physical quantities such as
displacement, stress, and strain. Among these
solution variables, the physical quantities that exist in
CAIH 2021 - Conference on Artificial Intelligence and Healthcare
262

both fluid and solid solutions were pressure and
displacement. In the fluid solver, the pressure was the
direct solution, while in the solid solver, the pressure
can be used as a load. In the solid solver, the
displacement was the direct solution quantity, while
in the fluid solver, the displacement can be used as a
load, which is expressed as a calculation domain
motion or deformation.
2.3 Initial Conditions, Boundary
Conditions and Material Properties
The blood flow is a pulsating flow, which was
achieved by setting the initial speed of the pulsation
in this paper. According to the experimental results of
the research group, the subjects were selected from a
healthy group of 22~27 years old, a total of 59 people.
Among them, 26 males were 172~176 cm tall and
weighed 67~75 kg; 33 females were tall and weighed
46~60 kg. After signing the informed consent form
with the subject, the psammotherapy test was carried
out. Each psammotherapy time was 30 minutes, once
a day, and 15 days was a course of treatment. SPSS
software was used to process the peak blood flow
velocity, inner diameter and heart rate before and
after femoral artery psammotherapy (as shown in
Table 1). As
60
T
heart rate
=
,
=
2
T
π
ω
,the angular
velocity was determined. Since the pulsation velocity
can be considered to change according to a sine
function within a pulsation cycle, the initial condition
of the femoral artery was set as the pulsating blood
flow velocity (Yiming, Fu
2017)
, that is,
=
in
v 0.93 sin 7.99t()
,
out
v 1.23 sin 9.70t= ()
; the
outlet pressure was set to p=0. The boundary
conditions of the femoral artery wall were set to have
no penetration and no slip boundary.
The blood vessel wall was set an incompressible
isotropic material (Liu,Wu,Dhanjoo
2015)
, and
its density
3
soild
1150 kg m
ρ
=
, Elastic modulus,
E
5Mpa=
and Poisson's ratio
0.45
ν
=
The density
of blood
33
blood
1.05 10 kg m .
ρ
=×
Table 1: Femoral artery hemodynamic indexes before and after psammotherapy (n = 59).
parameter
Before psammotherapy After psammotherapy
speed /(cm·s-1) 92. 51 ± 8. 87 122. 51 ± 16. 98
Inner diameter /cm 0. 76 ± 0. 11 0. 78 ± 0. 11
Heart rate 76. 32 ± 11. 40 92. 69 ± 16. 09
Cardiac cycle /s 0. 789 0 0. 651 6
2.4 Governing Equation
A large number of studies have shown that animal
blood has the characteristics of non-Newtonian fluid,
and the shear force and shear strain rate of blood are
nonlinear. Here we set the blood as an incompressible
non-Newtonian fluid, select the non-Newtonian flow
model, and the flow control equation (Matos ,
Oliveira
2013)
is:
0u∇⋅ =
(1)
()
u u
u
p
t
ρρ
τ
+ ∇
∂
=−∇ +∇
∂
(2)
In the formula, the stress tensor τ̄ and the strain
rate tensor γ̄ are nonlinear relations:
()
τμ
γ
γ
=
(3)
This paper selects the model of Carreau-Yasuda
(Morales, Larrabide, Geers, Aguilar, Frangi
2013)
:
()
()
()
1/
z
0
1
nz
μμ λ
μμ γ
−
∞
∞
+− +
=
(4)
According to the literature, parameters are
respectively set as 𝜆 = 0.110𝑠 , 𝑛 = 0.392 ,
3
0
22 10 pa s
μ
−
×=⋅
,
3
2.2 10 pa s
μ
∞
−
=× ⋅
,
z 0.644=
, dynamic viscosity
μ
In addition, the control equation of the blood
vessel wall model (Chatziprodromou, Tricoli,
Poulikakos, Ventikos 2007) is expressed as follows:
ij s s
a
ρ
σ
=∇⋅
(5)
Here 𝜎
represents the stress tensor of the blood
vessel wall; 𝑎
represents the acceleration of the
blood vessel wall; 𝜌
represents the density of the
blood vessel wall.
When the coupling between the fluid and the solid
occurs, the contact surface between the fluid and the
solid needs to establish a corresponding relationship
to meet this condition. Fluid and solid will transmit
displacement and speed through the contact surface
Research on the Effect of Psammotherapy on the Pulsating Flow of Conical Curved Femoral Artery
263
between them. The following conditions should be
met on the contact surface between fluid and solid:
s
ij s
s
dd
nTn
UU
σ
=
⋅=⋅
=
(6)
In these equations, the subscript s represents the
physical quantity of the blood vessel wall; n
represents the boundary normal; d represents the
displacement.
3 RESULT
3.1 Distribution of Blood Flow Field
before and after Psammotherapy
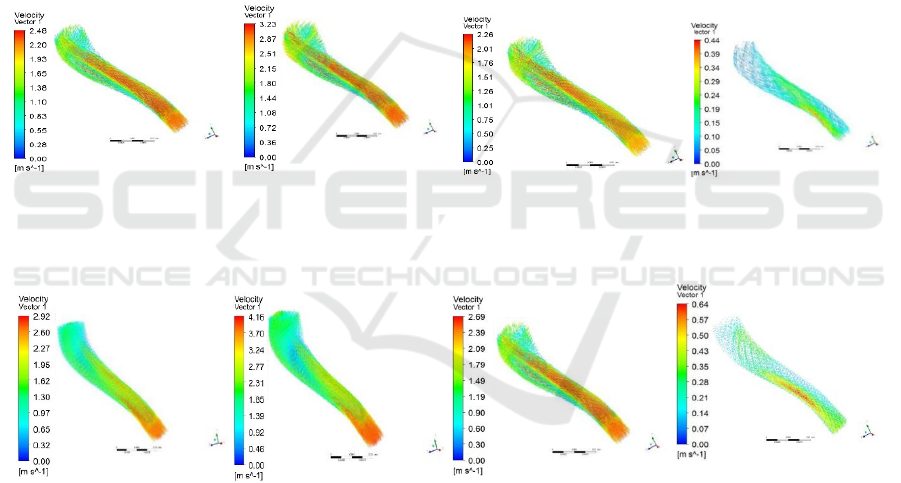
Figure 2 shows the velocity distribution cloud map of
the tapered femoral artery during a cardiac cycle.
Figure 2A is the cloud map of different instantaneous
velocity distributions before psammotherapy, and
Figure 2B is the cloud map of different instantaneous
velocity distributions after psammotherapy. Figure 2
shows that, before psammotherapy, the central area of
the front blood flow velocity moves to the inside to a
certain extent, resulting in a low velocity area on the
outside of the blood vessel, so vortexes are generated
in this area. Compared with before psammotherapy,
the gradient of blood flow velocity in the radial
direction of the conical femoral artery curve is less
drastic after sand therapy, and the possibility of
bidirectional eddy is reduced; the blood flow field is
more evenly distributed after psammotherapy than
before psammotherapy, and the resulting low-
velocity area is decreasin.
(1).t=0.15s (2).t=0.30s (3).t=0.45s (4).t=0.60s
A. Before psammotherapy
(1).t=0.15s (2).t=0.30s (3).t=0.45s (4).t=0.60s
B. After psammotherapy
Figure 2: Velocity distribution cloud diagram in the conical curved femoral artery.
Table 2 is a comparison table of the maximum
speed before and after psammotherapy. The relative
change of the maximum speed is the absolute change
of the same instantaneous maximum speed before and
after psammotherapy divided by the percentage of the
maximum speed before psammotherapy. Table 2
shows that the maximum speed after psammotherapy
is higher than that before psammotherapy. The
maximum speeds of before and after psammotherapy
are reached at 0.30s, and the absolute change of the
maximum speed is also the largest. The relative
change of the maximum speed is the largest at 0.60s.
Figure 3 shows the speed change with time curve
of the conical curved femoral artery of the inner
monitoring point A~D and the outer monitoring point
a~d. It is found that the speed of the inner side of the
bend changes significantly with time before
psammotherapy, while the inner speed change after
CAIH 2021 - Conference on Artificial Intelligence and Healthcare
264
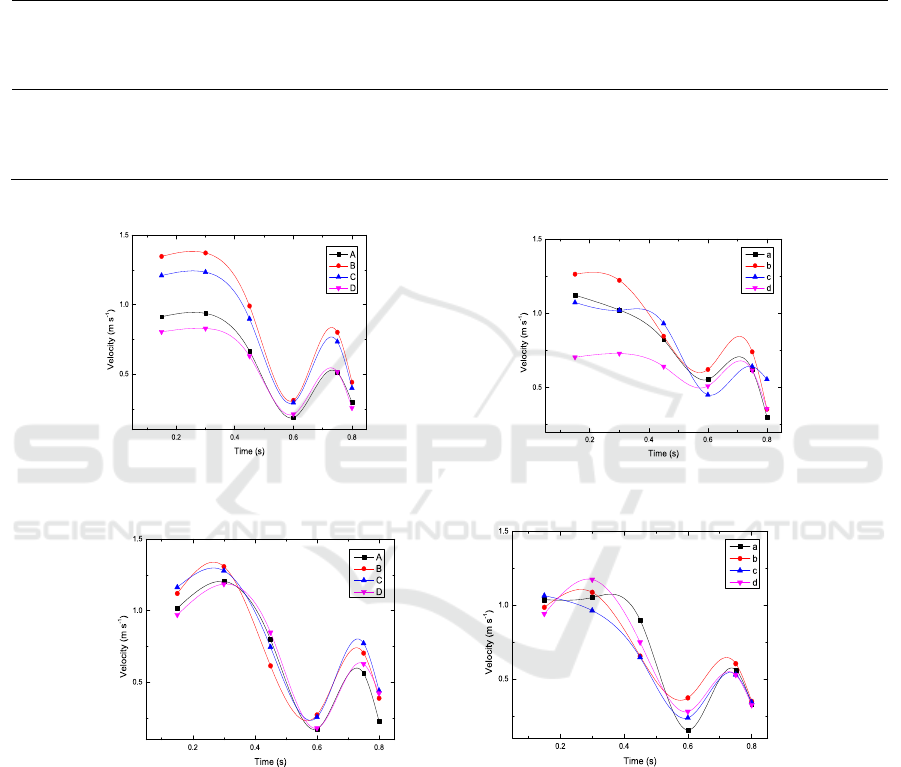
psammotherapy is relatively gentle, the difference
between these points is not obvious, and the average
maximum value is also reduced; the blood flow
velocity at some points before the curved lateral
psammotherapy is lower, and the blood flow speed
increases after the psammotherapy, but the variation
range of blood flow velocity after sand therapy is
relatively small compared with that before
psammotherapy, and the flow is relatively smooth.
Table 2: Comparison of maximum speed before and after psammotherapy.
Time
(s)
Maximum
speed before
psammotherapy
(m/s)
Maximum speed
after psammotherapy
(m/s)
Absolute change
of maximum speed
(m/s)
Relative change of
maximum speed (%)
0.15 2.48 2.92 0.44 18
0.30 3.23 4.16 0.93 29
0.45 2.26 2.69 0.43 19
0.60 0.44 0.64 0.2 45
A. Before psammotherapy
B.
After psammotherapy
Figure 3.
3.2 Wall Shear Stress Distribution
before and after Psammotherapy
Figure 4A is the distribution diagram of wall shear
stress with time before psammotherapy, and Figure
4B is the distribution cloud diagram of wall shear
stress with time after psammotherapy. Figure 4 shows
that, at the curve of conical vessels, the blood first
decompresses and speed increases, then its speed
decelerates and pressurizes, and finally the boundary
layer falls off, so that the velocity changes greatly,
and the shear stress of the blood vessel wall is also
more obvious. As the taper of the blood vessel
increases, the wall shear stress caused by the
acceleration of the flow speed also gradually
increases. Compared with before psammotherapy ,
the blood vessel wall shear stress distribution after
psammotherapy is more uniform overall.
Research on the Effect of Psammotherapy on the Pulsating Flow of Conical Curved Femoral Artery
265
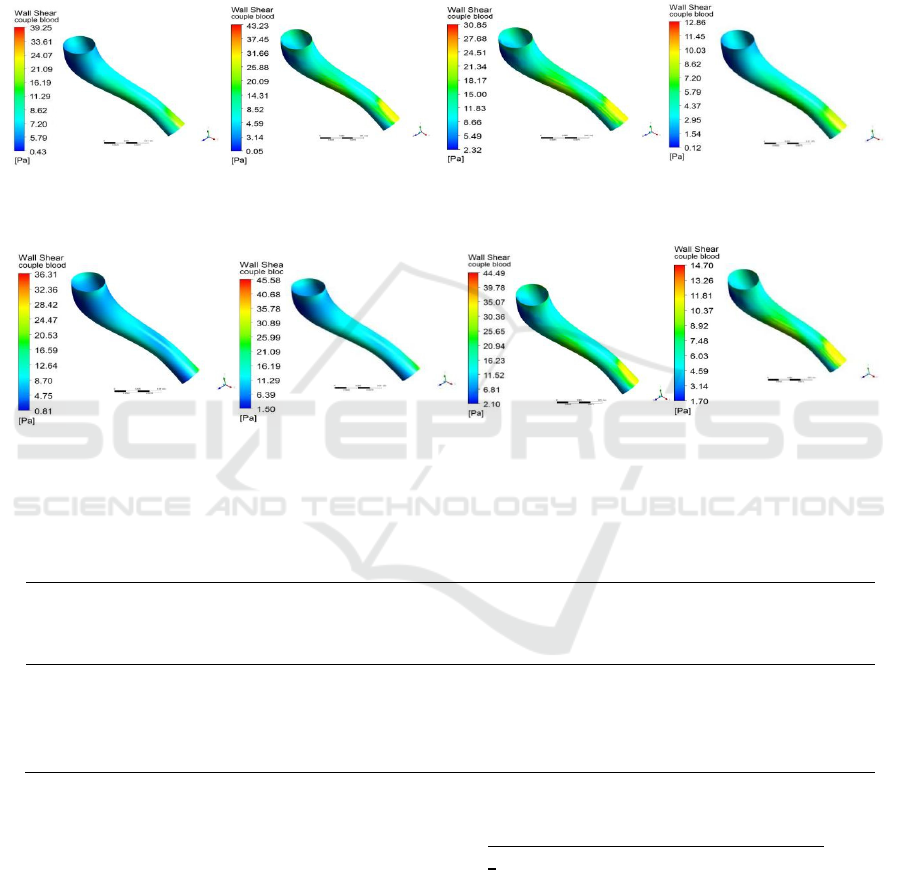
Table 3 is a comparison table of the maximum
wall shear stress before and after psammotherapy.
The relative change of the maximum wall shear stress
is the absolute change of the maximum wall shear
stress at the same instant before and after
psammotherapy divided by the percentage of the
maximum wall shear stress before psammotherapy.
Table 3 shows the maximum wall shear stress
after psammotherapy is higher than the maximum
wall shear stress before psammotherapy. When 0.30s,
the maximum wall shear stress before and after
psammotherapy is the largest, but the maximum
absolute change of the maximum wall shear stress
occurs at 0.15s, and the relative change of the
maximum wall shear stress is the largest at 0.15s.
(1).t=0.15s (2).t=0.30s (3).t=0.45s (4).t=0.60s
A. Before psammotherapy
(1).t=0.15s (2).t=0.30s (3).t=0.45s (4).t=0.60s
B. After psammotherapy
Figure 4: Cone-curved artery wall shear stress distribution cloud map.
Table 3: Comparison of maximum wall shear stress before and after psammotherapy.
Time (s)
Maximum wall
shear stress before
psammotherapy (Pa)
Maximum wall
shear stress after
psammotherapy (Pa)
Absolute change of
maximum wall shear
stress (Pa)
Relative change
of maximum wall
shear stress (%)
0.15 30.85 36.31 5.46 18
0.30 43.23 45.58 2.35 5
0.45 39.25 44.49 5.24 13
0.60 12.86 14.70 1.84 14
3.3 Vascular Von-Mises Equivalent
Stress Distribution before and after
Psammotherapy
The blood vessel is an elastic body. Under the
coupling action of the blood vessel and the blood, the
blood vessel will produce a certain deformation. The
Von-Mises equivalent stress distribution of blood
vessels before and after psammotherapy is shown in
Figure 5. The Von-Mises equivalent stress
is the stress for judging whether the material has
yielded, and its expression is 𝜎
=
[(𝜎
−𝜎
)
+(𝜎
−𝜎
)
+(𝜎
−𝜎
)
] , where
σ
, σ
,σ
are the three principal stresses of the
dangerous point.
When the Von-Mises stress is less than the yield
stress, the material is in elastic state, otherwise it is
plastic state. Figure 5 shows that the Von-Mises stress
on both sides of the vessel with the largest curvature
CAIH 2021 - Conference on Artificial Intelligence and Healthcare
266
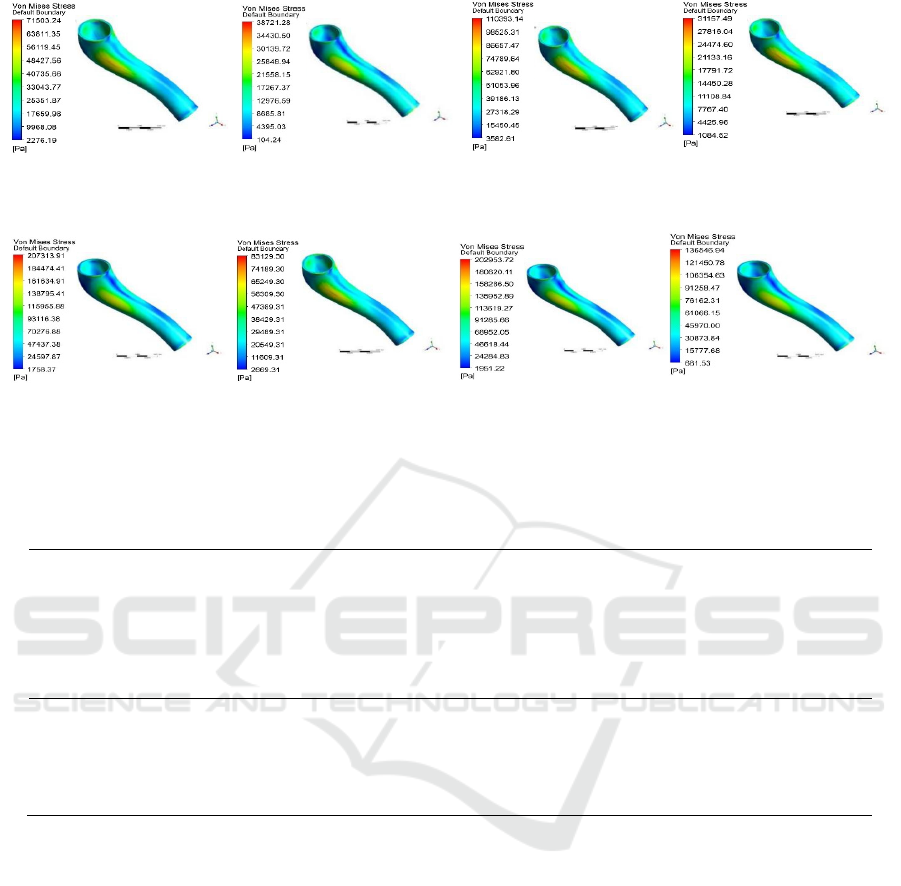
(1).t=0.15s (2).t=0.30s (3).t=0.45s (4).t=0.60s
A. Before psammotherapy
(1).t=0.15s (2).t=0.30s (3).t=0.45s (4).t=0.60s
B. After psammotherapy
Figure 5: Von-Mises equivalent stress distribution cloud diagram of conical curved artery.
Table 4: Comparison of maximum Von-Mises equivalent stress before and after psammotherapy.
Time (s)
Maximum Von-
Mises equivalent stress
before psammotherapy
(kPa)
Maximum Von-
Mises equivalent stress
after psammotherapy
(kPa)
Maximum
absolute change of
Von-Mises
equivalent stress
(kPa)
Maximum
relative change of
Von-Mises
equivalent stress (%)
0.15 71.50 207.31 135.81 189
0.30 38.72 83.13 44.41 115
0.45 110.39 202.95 92.56 84
0.60 31.16 136.55 105.39 338
is the largest, and the distribution law before and after
psammotherapy is basically the same.
Table 4 is the comparison table of the maximum
Von-Mises equivalent stress before and after
psammotherapy. The maximum relative change of
Von-Mises equivalent stress is the absolute change of
the same instantaneous maximum Von-Mises
equivalent stress before and after psammotherapy
divided by the percentage of Von-Mises equivalent
stress of the maximum before psammotherapy.
Table 4 shows that the maximum Von-Mises
equivalent stress after psammotherapy is higher than
the maximum Von-Mises equivalent stress before
psammotherapy. The maximum Von-Mises
equivalent stress is at 0.45s before psammotherapy.
The effect force reaches the peak value of 110.39kPa,
the maximum Von-Mises equivalent stress reaches
the peak value of 207.31kPa at 0.15s after
psammotherapy, and the maximum absolute change
of the maximum Von-Mises equivalent stress occurs
at 0.15s, and its value is 135.81kPa. The maximum
relative change of the maximum Von-Mises
equivalent stress occurs at 0.6s, and its value is 338%.
4 CONCLUSIONS
After psammotherapy, the blood flow field changes,
the blood flow velocity increases, and the blood flow
field is improved. Compared with before
psammotherapy, the speed gradient of blood flow is
relatively weakened at the conical bend, and the blood
flow field distribution is relatively even compared
with before psammotherapy. After psammotherapy,
the blood flow velocity changes relatively smoothly
Research on the Effect of Psammotherapy on the Pulsating Flow of Conical Curved Femoral Artery
267

and the blood flow velocity increases in the conical
curve, which can effectively prevent the deposition of
large substances in the blood, so that the large
substances can be transported with the blood, and the
shear stress of blood vessel wall increases effectively
to prevent the thickening of blood vessel wall after
psammotherapy. Studies on blood flow velocity and
wall shear stress show that psammotherapy has a
positive effect on preventing the formation of
atherosclerosis. However, after psammotherapy, the
von-Mises equivalent stress increased, and this
increase is relatively large and has a potential risk of
vascular rupture.
This paper considers the non-Newtonian
characteristics of blood, and the reverse CT scan of
the human blood vessel model can effectively
approach the physiological conditions of the human
body. However, there are still shortcomings in the
calculation. As we all know, blood is not just plasma,
but also includes blood cells and other substances,
which makes it become a multiphase flow problem.
To be more similar to the real human body, these
problems will be all considered in future research.
ACKNOWLEDGEMENTS
This paper is supported by the National Natural
Science Foundation of China (31460245) and Natural
Science Foundation of Xinjiang Uygur Autonomous
Region of China (2014211A005).
REFERENCES
Abdul Saramu·Sidura·Usman·Yasheng Shatar·Kurban,
(2011) The characteristics and mechanism of sand
burial therapy, Chinese Journal of Ethnic Medicine, No.
9, P54-56
Bureby Yiming, Fu Rongchang. (2016) Hemodynamic
effects from sand therapy of Uyghur medicine on the
branch of femoral artery[J]. Journal of Medical
Biomechanics, 31(05): 431-436.
Bureby Yiming, Fu Rongchang. (2017) Numerical
simulation of two-way fluid-solid coupling
hemodynamics of femoral artery under Uyghur
medicine psammotherapy [J]. Chinese Journal of
Biomedical Engineering, 36(04): 507-511.
Chang Yongchao, Chang Yanqing, Xu Deying, (2009)
Changes of hemorheological indexes in patients with
osteoarthritis, Orthopedics of Traditional Chinese
Medicine, Volume 21, Issue 9, P35-36
Chatziprodromou I, Tricoli A, Poulikakos D, Ventikos Y.
(2007) Haemodynamics and wall remodelling of a
growing cerebral aneurysm: a computational model[J].
Journal of Biomechanics 40 (2): 412-426.
Liu Guiying, Wu Jianhuang, Dhanjoo N G, et al. (2015)
Hemodynamic characterization of transient blood flow
in right coronary arteries with varying curvature and
side - branch bifurcation angles [J]. Computers in
Biology and Medicine, 64: 117-126.
Matos H M, Oliveira P J. (2013) Steady and unsteady non-
Newtonian inelastic flows in a planar T-junction[J].
International Journal of Heat and Fluid Flow, 39: 102-
126.
Morales H G, Larrabide I, Geers A J, Aguilar M L, Frangi
A F. (2013) Newtonian and non Newtonian blood flow
in coiled cerebral aneurysms [J]. Journal of
Biomechanics, 46 (13): 2158-2164.
Niaz Aishan, (2002) Research on the treatment of
rheumatism with psammotherapy in Turpan, Xinjiang,
Chinese Journal of Ethnic Medicine, Issue 1, P21-22
Schulze-Bauer CA, Morth C, Holzapfel GA. (2003) Passive
biaxial me-chanical response of aged human iliac
arteries[J]. J Biomech En-g, 125(3): 395-406.
Wei Rong, Dilinal Mahemuti, Yang Shaoling, (2009)
Uyghur psammotherapy on blood rheology and
hemodynamics of rabbit knee osteoarthritis[J]. Science
& Technology Review, 27(3): P84-86.
Xu Xiangyu, Guo Pan, Wang Xiaofeng, et al. (2017) Using
dynamic grid technology to simulate the development
of atherosclerosis[J]. Journal of Medical
Biomechanics,4(36):336-341.
Yang Jinyou, Yu Hang, Liu Jing, Hong Yang. (2014) A
hierarchical model of abdominal aortic aneurysm based
on fluid-structure coupling analysis[J]. Biomedical
Engineering and Clinics, 4(18):310-314.
Zhang Mei, Zhang Yun, Gao Yuehua. (2002) Comparative
study on the normal value of carotid artery and femoral
artery intima-media layer thickness[J]. Chinese
Medical Imaging Technology, 18(1): 32-33.
CAIH 2021 - Conference on Artificial Intelligence and Healthcare
268
