
The Influence of Company Size, Financial Leverage, and Public
Accounting Firm Size on Audit Report Lag: Empirical Study of the
Mining Company
Meiryani, Hendry Citra Wijaya, Jajat Sudrajat and Dedeh Maryani
Bina Nusantara University, Jakarta, Indonesia
Keywords: Company Size, Financial Leverage, Public Accounting Firm Size, Audit Report Lag.
Abstract: The purpose of this research is to ascertain clearly about the effect of company size, financial leverage and
public accounting firm size to audit report lag. This research used secondary data from mining companies that
listed on Indonesia Stock Exchange year 2016-2018. Sample were collected by purposive sampling method.
Based on the criteria predefined, a total of 33 samples used in this research were further analyzed by using
Multiple Linear Regression Analysis. The research concluded that company size has a significant and negative
effect on audit report lag, financial leverage has a significant and positive on audit report lag, while the public
accounting firm size has no significant but has negative effect to audit report lag. This research also verify
that company size, financial leverage and public accounting firm size simultaneously have a significant effect
on audit report lag.
1 INTRODUCTION
Financial reports are very important about a company
that is useful for parties who use these financial
statements as a basis for consideration in making
economic decisions (Suwanda, 2015). Financial
reports are used by many users with different
purposes including shareholders, management,
investors, creditors, laborers, auditors and customers.
According to Suwanda (2015) as important
information, financial statements must meet several
characteristics so that financial reports can be used,
namely relevant, understandable, reliable, and
comparable. Relevant, which means that financial
statements must be relevant or related to the intention
of the user having 4 elements, namely having
feedback value, having predictive value, being timely
and complete.
In 2016, the Indonesian Financial Services
Authority issued the Financial Services Authority
Regulation No. 29 / POJK.04 / 2016 concerning the
Annual Report of Issuers or Public Companies states
that companies listed on the Indonesia Stock
Exchange are required to submit an audited annual
Financial Report. According to Eksandy (2017) audit
is a systematic process to obtain and seek evidence in
an objective way relating to statements about
economic actions and events to determine the
suitability of these statements with predetermined
criteria and submit the results to interested parties.
The audit must be carried out by someone who is
competent and independent called an auditor
Timeliness which is an element of relevance is
important for users of financial statements, because if
the financial statements are not on time, users of
financial statements cannot make decisions well,
therefore financial reports that are not timely can be
said that the financial statements are irrelevant
(Afriyeni and Marlius, 2019). Therefore, in the
Financial Services Authority Regulation No. 29 /
POJK.04 / 2016 concerning the Annual Report of
Issuers or Public Companies also states that Public
Companies are required to submit an audited Annual
Financial Report to the Financial Services Authority
no later than the end of the fourth month after the
financial year ends. If there are parties who violate
these provisions, Bapepam and LK can impose
administrative sanctions on each party who violates
them and each party who causes the violation.
Because the submission of the Annual Financial
Report must be accompanied by an audit report with
a fair opinion, auditors need accuracy and
thoroughness in the audit process of the company’s
Financial Statements, if there is a decrease in the
206
Meiryani, ., Citra Wijaya, H., Sudrajat, J. and Maryani, D.
The Influence of Company Size, Financial Leverage, and Public Accounting Firm Size on Audit Report Lag: Empirical Study of the Mining Company.
DOI: 10.5220/0011243500003376
In Proceedings of the 2nd International Conference on Recent Innovations (ICRI 2021), pages 206-214
ISBN: 978-989-758-602-6
Copyright
c
2022 by SCITEPRESS – Science and Technology Publications, Lda. All rights reserved
Company’s performance then this can be a factor for
audit delays (Writers and Latrini, 2016). According to
Widhiasari and Budiartha (2016) audit report lag is
the time span for completion of the audit from the
closing date of the company’s books to the date stated
in the audit report. The audit report lag will affect the
timeliness of the submission of financial reports to its
users, so that a long audit report lag.
Table 1: List of Listed Companies That Have Not
Submitted the 2018 Audited Financial Statements and Have
Not Paid Fines.
No Code Company name
1 AISA PT Tiga Pilar Sejahtera Food Tbk.
2 APEX PT Apexindo Pratama Duta Tbk.
3 BORN PT Borneo Lumbung Energi &
Metal Tbk.
4 ELTY PT Bakrieland Development Tbk.
5 GOLL PT Golden Plantation Tbk.
6 SUGI PT Sugih Energy Tbk.
7 TMPI PT Sigmagold Inti Perkasa Tbk.
8 CKRA PT Cakra Mineral Tbk.
9 GREN PT Evergreen Invesco Tbk.
10 NIPS PT Nipress Tbk
There are many factors that can cause audit report
lag which has been carried out in several previous
studies, several factors including company size,
financial leverage and size of KAP. Company size is
a measure of the size of a company as measured by
the total assets owned by the company. Large
company sizes will tend to be faster in the audit
completion process compared to smaller companies,
because larger companies certainly have better
internal control, the better the internal control of a
company, the better the company’s operational
system will be. Larger companies are also more
closely monitored by users of financial reports such
as investors, regulators and the government, this can
usually minimize audit report lag (Rahayu, 2017).
This is in line with research conducted by Dura
(2017) which states that company size has a
significant effect on audit report lag.
H1: Company size has a significant effect on the
audit report lag.
Financial leverage is a ratio that describes the
company’s ability to fulfil all of its obligations.
According to Sundjaja (2001), he found that there was
an effect of financial leverage on the audit report lag,
because the greater the ratio of debt to total equity,
the longer the range of audit report lag will be. This
can indicate that the company is experiencing
financial difficulties which is bad news for users of
financial statements, especially investors. This makes
the Company late in submitting financial reports to
the public, because auditors will raise concerns in
auditing companies that have a high level of financial
leverage. This also makes auditors tend to work
prudently and consequently the time span for
completing the audit is getting longer and timeliness
is difficult to achieve.
H2: Financial Leverage has a significant effect on
the audit report lag.
According to Jesslyn and Ardianti (2018) The
size of the Public Accounting Firm is a measure used
to determine whether a public accountant is large or
small, the size or size of the Public Accounting Firm
can be seen from its KAP affiliation, if the KAP is
affiliated with the Big Four, then the KAP can be said
to be large. Based on research conducted by Panjaitan
(2017), because the Big Four has more resources and
has a higher staff, it is therefore possible for KAP to
provide higher quality staff, so of course the KAP size
affects the audit report lag.
H3: KAP size has a significant effect on the audit
report lag.
The difference between the object of this study
from previous studies lies in the study sample and the
study period. This research was conducted on mining
companies listed on the Indonesia Stock Exchange.
Mining companies are a promising sector, mining
companies are one of the sectors that increase
Indonesia’s economic growth. Even though it has a
big influence on the country’s economic growth, this
business sector absorbs capital, debt and risks that are
so high. Then there are 3 out of 10 companies that
were late in submitting financial reports to the public
in 2018, 4 out of 10 companies in 2017, and 5 out of
17 companies in 2016. This has attracted the author’s
interest to examine the influence of Company Size,
Financial Leverage, and KAP size on audit report lag
in the mining company sector.
The Influence of Company Size, Financial Leverage, and Public Accounting Firm Size on Audit Report Lag: Empirical Study of the Mining
Company
207
2 THEORETICAL FRAMEWORK
• Widiastuti and Kartika (2018) conducted a
research on manufacturing companies listed
on the IDX in 2013-2016 with a sample size of
45 companies. This study uses multiple linear
regression. The results of this study indicate
that company size and solvency have a
significant negative effect on audit report lag.
Meanwhile, KAP size has a significant
positive effect on audit report lag.
• Hassan (2016) conducted research on
companies listed on the Palestine Stock
Exchange (PSE) in 2011 with a population of
46 companies. This research uses multiple
linear regression method. This study shows
that company size and KAP size have a
significant positive effect on audit report lag.
• Hsu (2016) conducted research on 2410
companies listed on the Shenzhen Stock
Exchange (SSE) in 2013. This study uses
multiple linear regression methods. The
results showed that financial leverage and size
of KAP had a significant positive effect on
audit report lag.
• Dura (2017) had conducted a research on
manufacturing companies listed on the IDX in
the 2013-2015 period with a sample of 105
companies. This research uses multiple linear
regression method. The results of the study
state that solvency and firm size have a
significant negative effect on audit report lag.
• Artaningrum et al. (2017) conducted a
research on banking companies listed on the
IDX in the 2013- 2015 period with a sample of
28 companies. This research uses multiple
linear regression method. The results of the
study state that company size has a significant
negative effect and solvency has a significant
positive effect on audit report lag.
3 RESEARCH METHODOLOGY
This research uses quantitative methods and uses
secondary data taken from the Indonesia Stock
Exchange website (www.idx.co.id). The sampling
method used a purposive sampling approach with the
following criteria:
• Total population (mining companies listed on
the IDX 2016-2018).
• Mining companies that were not recorded
during the 2016 to 2018 period.
• Mining companies that do not publish
complete audited financial reports from 2016
to 2018. • Data Outliers.
After the sample criteria were applied to all
banking companies listed on the Indonesia Stock
Exchange (IDX), 33 listed mining companies were
selected as samples of this study. Using a research
period of 3 (three) years, namely 2016-2018, the total
sample of this study was 99 samples.
The independent variables in this study are firm
size, financial leverage, and KAP size with the
dependent variable on audit report lag. The following
is an operationalization of the variables used in this
study:
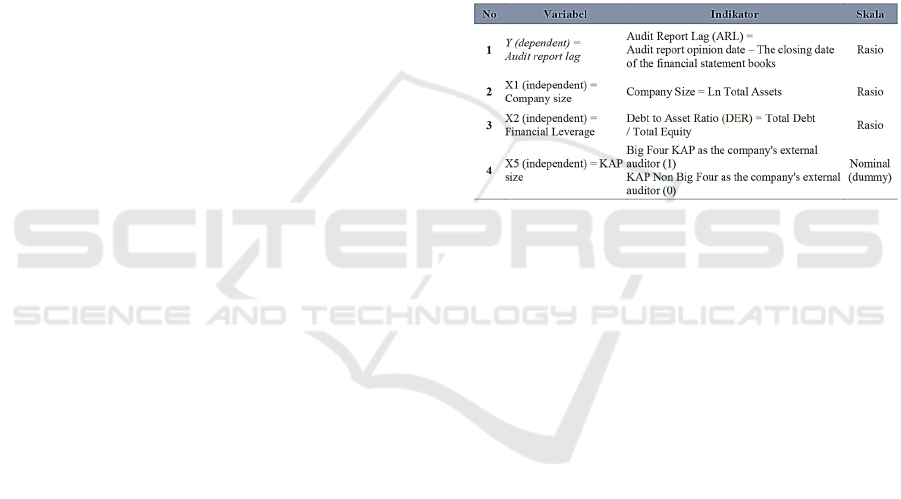
Table 2: Variable Operational Table.
The data that the researchers had collected were
analyzed using the Multiple Linear Regression
method consisting of the T test (partial), F test
(simultaneous) and the coefficient of determination
test. The author also uses descriptive statistical
methods to describe all research variables using the
SPSS (Statistical Product and Service Solution) test
tool. But before that the authors conducted the
Classical Assumption Test first to find out whether
the model used in the regression method actually
shows a significant and representative relationship so
that the results can be accounted for and are not
biased. Classic assumption tests that will be carried
out include normality, multicollinearity,
autocorrelation, and heteroscedasticity tests. In this
study, researchers used multiple linear regression
models, with the following equation:
𝑌 = 𝛽0 + 𝛽1𝑋1 + 𝛽2𝑋2 + 𝛽3𝑋3 + 𝜀
(1)
Information:
Y = Audit Report Lag
X2 = Financial Leverage
0 = Constant
X3 = Size of KAP
𝛽1
–
𝛽3
= Variable Coefficient
𝜀 = Error
X1 = Company Size
ICRI 2021 - International Conference on Recent Innovations
208
4 RESULT AND DISCUSSION
The statistical test in this study was carried out using
IBM SPSS Statistics 25. The following is a table of
descriptive statistical test results that explains the
minimum value, maximum value, average value, and
standard deviation of the variables of this study:
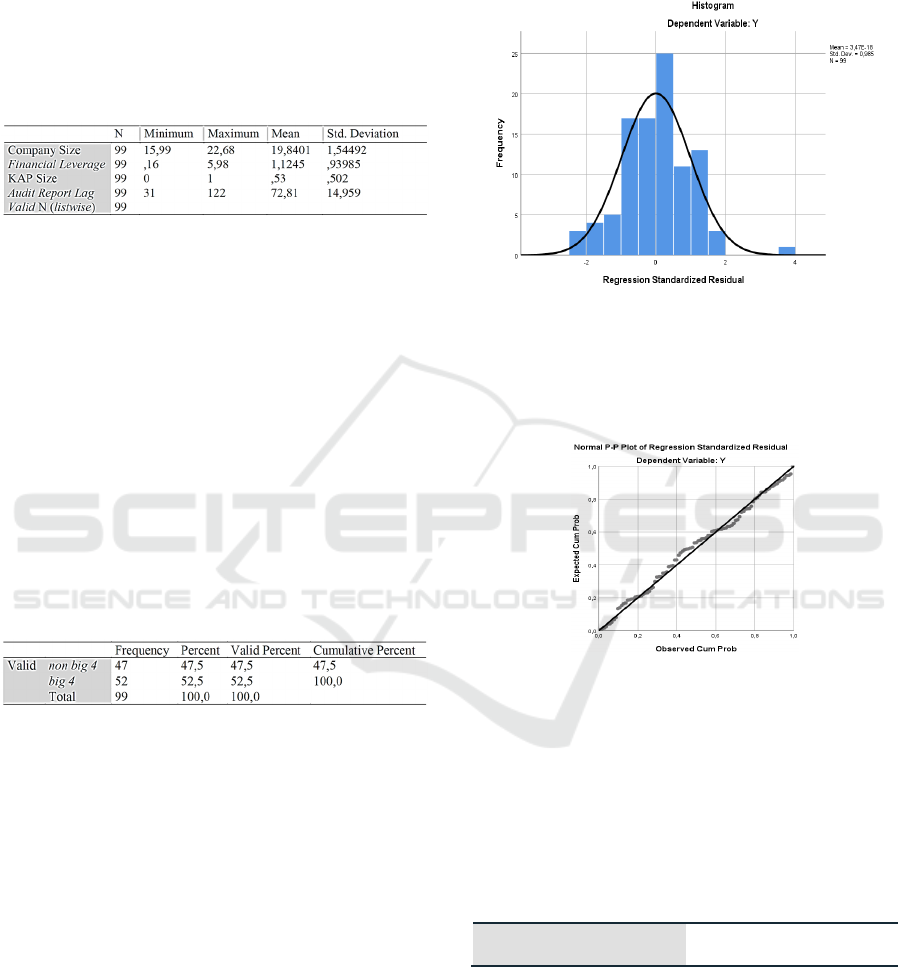
Table 3: Descriptive Statistics Test Results.
Based on the results of the descriptive statistical
test above. Here is the information we can get:
• Company size shows a minimum value of
15.99, a maximum value of 22.68, an average
value of 19.84, and a standard deviation of
1.5D4492.
• Financial Leverage (DER) shows a minimum
value of 0.16, a maximum value of 5.98, an
average value of 1.1245 and a standard
deviation of 0.93985.
• Audit Report Lag shows a minimum value of
31 days, a maximum value of 122 days, an
average value of 72.81 days and a standard
deviation of 14,959.
Table 4: Descriptive Statistical Test Results for Variables
with a Dummy Scale Public Accounting Firm Size.
The size of the Public Accounting Firm is a
dummy variable, which is tested separately using a
frequency table. The size of KAP is seen from 2
categories, namely KAP Big Four and KAP Non Big
Four. Based on the table with a frequency of 99
samples, the data shows that 47 companies or 47.5%
of the companies that use the Big Four KAP services
are companies or 52.5%.
The classic assumption test was carried out by the
authors to ensure that the regression test gave
unbiased results, so that the study could be relied on.
The classical assumption tests carried out are
normality test, autocorrelation test, multicollinearity
test, and heteroscedasticity test.
4.1 Normality Test
The normality test is carried out to ensure that the data
is normally distributed, because a good regression
model must have normally distributed data.
Researchers use 3 methods in the normality test,
namely the histogram, the Normal P-P Plot, and the
Kolmogorov-Smirnov.
Figure 1: Histogram of normality test results.
From the picture above it can be concluded that
the data is normally distributed, where the data
distribution of the residual value (error) shows a
normal distribution and the histogram is a bell.
Figure 2: Normal P-P plot results.
Based on the results of the Normal P-P Plot
above, it can be concluded that the data has been
normally distributed, seen from the points that do not
spread far and follow a straight line.
Table 5: Kolmogorov-Smirnov Test Results One-Sample
Kolmogorov-Smirnov Test.
Unstandardized Residual
As
y
m
p
. Si
g
.
(
2-tailed
)
,200
c,d
Based on the results of the Kolmogorov-Smirnov
test above, explain the results of the normality test by
making the following decisions:
• Asymp Value. Sig. (2-tailed) ¡0.05, which
means that the data is not normally distributed.
• Value of Asymp. Sig. (2-tailed) 0.05, which
means that the data is normally distributed.
The Influence of Company Size, Financial Leverage, and Public Accounting Firm Size on Audit Report Lag: Empirical Study of the Mining
Company
209

The result of the Kolmogorov-Smirnov test is
0.200 which is greater than 0.05, it can be concluded
that the data is normally distributed. So it can be
concluded that the data has met all the measurement
requirements and has been normally distributed.
4.2 Autocorrelation Test
To test for the presence or absence of autocorrelation,
the examiner uses the Run Test test. Run tests are part
of non-parametric statistics, but run tests can be used
to test whether there is a high correlation between
residuals (autocorrelation). If there is no correlation
between residuals, it can be said that the residuals are
random (no autocorrelation occurs). How to
determine the autocorrelation test is as follows:
• If the probability value is significant ¡than
0.05, then autocorrelation occurs.
• If the probability value is significant 0.05, then
there is no autocorrelation.
Table 6: Autocorrelation Test Results Runs Test.
Unstandardized Residual
As
y
m
p
. Si
g
.
(
2-tailed
)
,266
The results of the Run Test from table 6 show a
significant probability value of 0.266. Then the
probability value is greater than 0.05 (0.226
> 0.05),
so it can be concluded that the data does not occur
autocorrelation.
4.3 Multicollinearity Test
The multicollinearity test aims to determine whether
or not there are deviations from the multicollinearity
assumption, namely the linear relationship between
the independent variables in the regression model. a
good regression model is that there is no strong
relationship between the independent variables. To
test the presence or absence of multicollinearity
between independent variables, it can be seen in the
coefficient table and observing the tolerance value
and Variance Inflation Factor (VIF) with the
following criteria:
• If the VIF value
> 10 and the tolerance value
<0.1, then there is a correlation between the
independent variables.
• If the VIF value
<10 and the tolerance value >
0.1, then the data is free from
multicollinearity.
Table 7: Multicollinearity Test Results.
Model Collinearit
y
Statistics
Tolerance VIF
1
(
Constant
)
Company Size ,714 1,401
Financial Leverage ,931 1,074
KAP Size ,712 1,405
a. Dependent Variable: Audit Report Lag
Table 7 shows that the independent variable has a
Variance Inflation Factor (VIF) value of: Company
Size 1.401; Financial Leverage 1,074; KAP size
1,405. And the tolerance value is: Company Size
0.714; Financial Leverage 0.931; and KAP size of
0.712. From these results, we can conclude that the
VIF value of the independent variable is less than 10
and the tolerance value of the independent variable is
greater than 0.1, so there is no correlation between
independent variables, which means that the research
regression model is free from multicollinearity.
4.4 Heteroscedasticity Test
The heteroscedasticity test aims to test whether in the
regression model there is an inequality of variants
from the residuals of one observation to another
which is called heteroscedasticity. To test the
heteroscedasticity, the writer used 2 methods,
namely:
4.4.1 Glejser Test
Table 8: Glejser Test Results.
Model t Sig.
1
(
Constant
)
-,966 ,337
Company Size 1,713 ,090
Financial Leverage ,227 ,821
In the Glejser test, regression is carried out between
the independent variables and their residual absolute
values. If the independent variable is statistically
significant in influencing the dependent, then there is
an indication that heteroscedasticity occurs. If the
significant value of each independent variable is
>
ICRI 2021 - International Conference on Recent Innovations
210
than 0.05, heteroscedasticity does not occur, on the
contrary, if the significant value of each independent
variable is
<0.05, heteroscedasticity occurs.
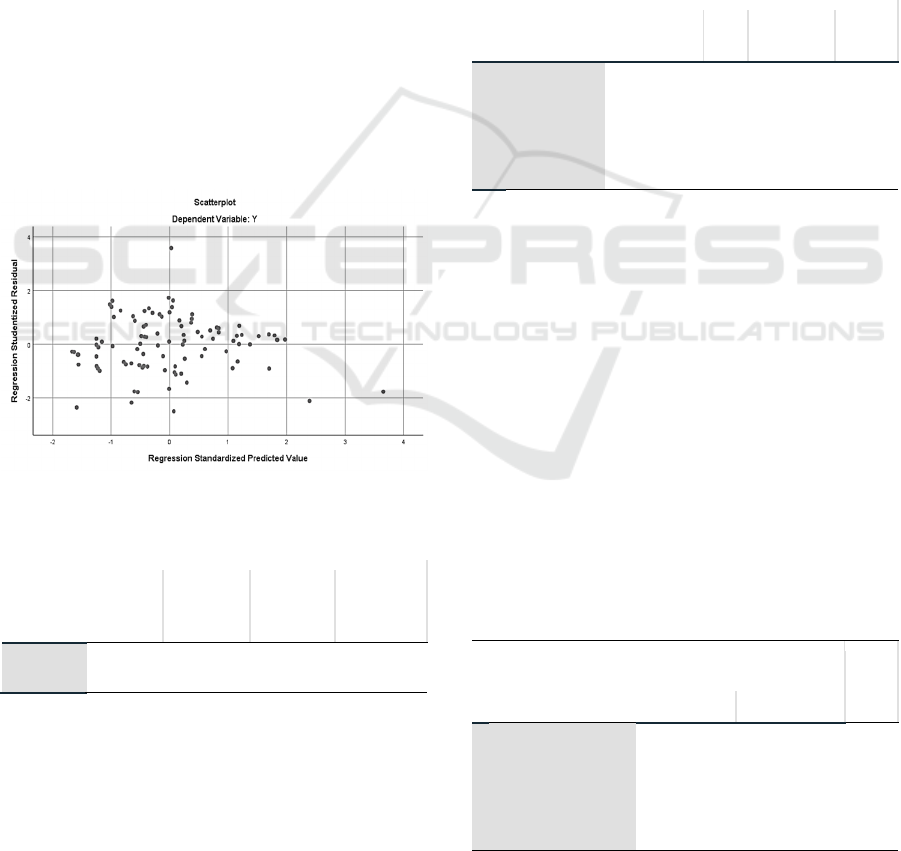
4.4.2 Scatterplot Diagram
The scatterplot diagram uses the predictive value of
the dependent variable with its residuals, with the
premise that if there is a certain pattern, such as the
existing points forming a certain regular pattern
(wavy, widening then narrowing), it indicates
heteroscedasticity. Conversely, if there is no clear
pattern, and the dots spread above and below the 0
and Y-axis, then there is no heteroscedasticity.
After passing the classical assumption test. The
author continues the statistical hypothesis test. In this
study the authors used a multiple linear analysis
model to analyze the data and test the hypotheses that
were made.
The first is the coefficient of determination test
which aims to determine the overall ability of the
independent variables contained in the regression
model in explaining the variance in the value of the
dependent variable.
Figure 3: Scatterplot results.
Table 9: Determination Coefficient Test Results Summary.
Model R R Square Adjusted
R Square
Std. Error
of the
Estimate
1 ,403
a
,163 ,136 13,903
This study uses an adjusted R2 value because
there are more than two independent variables. This
is done to avoid bias in the R2 value due to the large
number of independent variables in the regression
equation. Based on Table 9, adjusted R2 shows a
value of 0.136, which means that 13.6% of the audit
report lag can be explained by variables of company
size, financial leverage, and KAP size, while the
remaining 86.4% is influenced by other factors
outside of the study. The second is the F test or also
known as the simultaneous test which is used to
determine whether the independent variables jointly
or simultaneously affect the dependent variable. The
level of significance is 0.05. So based on the
comparison of significant values, there are 2 criteria
for accepting or rejecting Ho, namely:
• If the significant value >𝛼= 0.05 then Ho is
accepted and Ha is rejected.
• If the significant value <𝛼 = 0.05 then Ho is
rejected and Ha is accepted.
Table 10: F-Statistical Test Results ANOVA.
Model
Sum of
Squares
df
Mean
S
q
uare
F
1 Re
g
ression 3566,361 3 1188,787 6,150
Residual 18362,993 95 193,295
Total 21929,354 98
Table 10 shows the calculated F value of 6.150
with a significance of 0.001. The significance valuis
less than 0.05, which means that Company Size,
Financial Leverage, and KAP Size simultaneously
affect the Audit Report Lag.
The third is the T test or also known as the partial
test which aims to determine the effect of each
independent variable on the dependent variable. The
steps taken in the T test are the same as the F test.The
level of significance is 0.05, so based on the
comparison of significant values there are 2 criteria
for accepting or rejecting Ho, namely:
• If the significant value > 𝛼 = 0.05 then Ho is
accepted and Ha is rejected.
• If the significant value
<𝛼= 0.05 then Ho is
rejected and Ha is accepted.
Table 11: T-Statistical Test Results Coefficients.
Model Unstandardized Coefficient
s
t
B Std. Erro
r
1 (Constant) 113,512 20,232 5,610
Com
p
an
y
Size -2,222 1,076 -2,065
Financial Levera
g
e 4,535 1,549 2,928
The Influence of Company Size, Financial Leverage, and Public Accounting Firm Size on Audit Report Lag: Empirical Study of the Mining
Company
211

Before discussing the T test, there is a regression
equation that can be seen from table 11, by looking at
the value in column B, the first row (Constant) is a
constant (a) and the next row shows the independent
variable. Then the regression model equation used is
as follows:
𝑌 = 113,512 + (−2,222)𝑋1 + 4,535𝑋2
+ (−3,256)𝑋3
(2)
Information:
Y = Audit Report Lag
X1 = Company Size
X2 = Financial Leverage
X3 = KAP size
Based on the regression model equation above, it
can be explained as follows:
• A constant value of 113.512 states that if there
is no company size, financial leverage, and
KAP size, the audit report lag will be 113.512
days.
• The coefficient of variable X1 is -2,222, which
means that company size has a negative effect
on the audit report lag, if the company size
increases by 1 unit, the audit report lag will
decrease by 2.222 days.
• The coefficient of variable X2 is 4.535, which
means that financial leverage has a positive
effect on the audit report lag, if financial
leverage increases by 1 unit, the audit report
lag will increase by 4.535 days.
• The coefficient of variable X3 is -3,256, which
means that the size of KAP has a negative
effect on the audit report lag. If the size of the
KAP increases by 1 unit, then the audit report
lag will decrease by 3.256 days.
Based on the results of the t test and the Beta value
presented, the significant value is 0.042 and the Beta
value is -2.222, where the significance value is less
than 0.05 and the Beta value shows negative results.
This shows that company size has a significant
negative effect on audit report lag. So it can be
concluded that the first hypothesis is accepted.
Companies that are larger in size tend to have a higher
public demand for that company information. This is
a sign that the company has won the trust of the
public, so that large companies will certainly
maintain this trust by providing information quickly
and accurately. In addition, a larger company
certainly has better internal control, the better the
internal control of a company, the better the
company’s operational system. The results of this
study are in line with research conducted by previous
studies (Artaningrum et al., 2017; Dura, 2017;
Hassam, 2016; Widiastuti and Kartika, 2018) which
states that company size has a significant negative
effect on audit report lag. However, the results of this
study are not in line with research conducted by
Arifuddin and Usman (2017) which states that
company size has a positive effect on audit report lag.
Financial leverage has a significance value of
0.04 and a Beta value of 4.535, which means that the
significant value is less than 0.05 and the Beta value
shows a positive value. This shows that financial
leverage has a significant positive effect on audit
report lag, so it can be concluded that the second
hypothesis is accepted. High financial leverage
indicates that the company is in financial trouble,
which reflects high financial risk. Companies will try
to reduce the level of financial leverage of their
companies, not wanting to give bad news to users of
financial reports, especially investors. In addition,
auditors will also be more careful in carrying out
audits, so that the fieldwork time in the audit will be
longer, this causes the signal or information conveyed
by the company to users of the information to be late.
The results of this study are in line with research
conducted by previous studies which states that
financial leverage has a significant positive effect on
audit report lag. On the other hand, in contrast to the
results of this study, research conducted by other
studies states that financial leverage has a significant
negative effect on audit report lag.
KAP size has a significant value of 0.329 and a
Beta value of -3.256, where the significant value is
greater than 0.05 and the Beta value shows a negative
value. This shows that the KAP size has a negative
effect but does not significantly influence the audit
report lag, so it can be concluded that the third
hypothesis is rejected. Big Four and Non Big Four
KAPs have the same accounting standards, namely
Financial Accounting Standards (SAK) made by the
Indonesian Accounting Association (IAI) so that Big
Four and Non Big Four KAPs have the same rules and
standards in carrying out audit procedures. So the
auditors from Big Four and Non Big Four KAPs have
the same responsibility to comply with standards in
carrying out their work. Apart from the same
standards, KAP Big Four and Non Big Four are also
regulated by laws made by the government.
Therefore, Big Four and Non Big Four KAPs have the
same performance to perform audit procedures. The
results of this study are in line with research
conducted by previous studies which state that KAP
size does not have a significant effect on audit report
lag. However, the results of this study are not in line
with the research conducted by other studies which
ICRI 2021 - International Conference on Recent Innovations
212

states that KAP size has a significant negative effect
on audit report lag.
5 CONCLUSION AND
SUGGESTION
5.1 Conclusion
Based on the results of the research that has been
done, it can be concluded that:
• The results show that the variables of company
size, financial leverage, and size of KAP
simultaneously affect the audit report lag.
• Company size has a negative and significant
effect on the audit report lag.
• Financial leverage has a positive and
significant effect on the audit report lag. •
• KAP size has a negative but insignificant
effect on the audit report lag.
During making this research, researchers
certainly did not escape the limitations as a human
being. The following are some research limitations
that hinder the achievement of research objectives:
• This study uses data from mining companies
listed on the Indonesia Stock Exchange from
2016-2018 (3 years). This can cause the results
of the study do not reflect the real results, due
to the lack of data studied.
• Collecting company data is done by sampling
method. The observation unit used in this
research is mining companies listed on the
Indonesia Stock Exchange from 2016-2018
with a sample size of 33 companies, so not all
of the population of mining companies on the
Indonesia Stock Exchange are used as
research objects, so there is a risk that the
selected sample cannot describe and represent
the population.
• The value of the coefficient of determination
(adjusted R2) in this study shows that the
independent variables, namely company size,
financial leverage, and KAP size can only
explain the dependent variable, namely the
audit report lag of 13.6% while 83.4% can be
explained by factors. other than this research.
5.2 Suggestion
Suggestions that can be given from the results of this
study are as follows:
• Suggestions for Users of Audited Financial
Statements It is hoped that users of company
information such as investors and creditors
will be more careful in investing or extending
credit. Information users can consider the
results of this study, namely if the size of the
company is getting bigger, then the possibility
of audit report lag will be smaller and
information users must also be careful if the
level of financial leverage is high, because it
can slow down the audit process, causing audit
report lag.
• Advice For Companies Companies listed on
the Indonesia Stock Exchange, especially
mining companies, are expected to be able to
use this research to overcome and minimize
audit report lag so as to avoid delays in
submitting audited financial reports to the
public.
• Suggestions for Auditors Auditors are
expected to be able to use this research to be
more aware of the factors that affect the audit
report lag so that the auditor can evaluate the
actions that can be taken to overcome these
factors so that the submission of audited
financial reports to the public can be done on
time.
• Suggestions for Further Research Future
research is expected to add years of
observation so that the research can better
describe the prediction of audit report lag that
occurs in a company. Further research is also
expected to increase the research sample in
order to represent the population under study.
Further research is also expected to be able to
add other variables to test the audit report lag,
so that the research can provide evidence of a
stronger effect on the audit report lag.
REFERENCES
Afriyeni, & Marlius, D. (2019). Analysis Of Factors
Affecting The Timeliness Of Submission Of Financial
Statements In Company Listing In Indonesia Stock
Exchange.
Apriyana, N., & Rahmawati, D. (2017). The Effect Of
Profitability, Solvability, Company Size, And Kap Size
On The Audit Delay Of Property And Real Estate
Companies Registered In Indonesia Stock Exchange
For 2013-2015. Nominal Journal, 6 (2), 108-124.
Arifuddin, Hanafi, K., & Usman, A. (2017). Company Size,
Profitability, and Auditor Opinion Influence to Audit
Report Lag on Registered Manufacturing Company in
Indonesia Stock Exchange. International Journal of
The Influence of Company Size, Financial Leverage, and Public Accounting Firm Size on Audit Report Lag: Empirical Study of the Mining
Company
213

Applied Business and Economic Research, 15 (19),
353-367.
Artaningrum, R. G., Budiartha, I. K., & Wirakusuma, M. G.
(2017). The Effect Of Profitability, Solvability,
Liquidity, Company Size And Management Change On
Audit Report Lag Of Banking Companies. E-Journal of
Economics and Business, Udayana University 6.3,
1079-1108.
Ashton, R., John, J., & Robert, K. (1987). An Empirical.
Dura, J. (2017). The Effect Of Profitability, Liquidity,
Solvability, And Company Size On The Audit Report
Lag Of Companies Listed In Indonesia Stock Exchange
(Case Study in Manufacturing Sector). Scientific
Journal of Asian Business and Economics, 11 (1), 64-
70.
Eksandy, A. (2017). The Effect Of Company Size,
Solvability, Profitability And Audit Committee On The
Audit Delay (In Property and Real Estate Companies
Listed on the Indonesia Stock Exchange in 2012-2015).
Competitive Journal of Accounting and Finance, 1 (2).
Fiatmoko, A. L., & Anisykurlillah, I. (2015). Factors
Affecting The Audit Delay Of Banking Companies.
Accounting Analysis Journal, 4 (1), 1-10.
Hassan, Y. M. (2016). Determinants of audit report lag:
evidence from Palestine. Journal of Accounting in
Emerging Economies, 6 (1), 13-32.
Hery. (2016). Financial Statement Analysis. Jakarta: PT.
Gramedia Widiasarana Indonesia.
Hsu, H. (2016). An Empirical Analysis on the Determinants
of Audit Report Lag. 3rd International Conference on
Social Science (ICSS 2016), 732-735.
Jesslyn, C., & Ardianti, A. Y. (2018). The Influence of
Company Complexity, Company Size, and Public
Accounting Firm Size on audit fees in manufacturing
companies. MODE, 30 (2), 198-211.
Panjaitan, I. (2017). Effect of KAP Size, Return on Assets
and Loan to Deposit Ratio on Audit Report Lag. Journal
of Management Applications, Economics and Business,
1 (2), 36-50.
Putra, P. G., & Putra, I. M. (2016). Size Of Company As
Moderates Influence Of Auditor Opinion, Profitability,
And Debt To Equity Ratio On Audit Delay. E-Journal
of Accounting at Udayana University, 14 (3), 2278-
2306.
Rahayu, L. R. (2017). Determinants Of Audit Delay In
Indonesia Companies: Empirical Evidence.
INVENTORY: Journal of Accounting, 1 (1), 1-11.
Writers, I. P., & Latrini, M. Y. (2016). Effect Of
Profitability, Solvability, And Company Size On Audit
Report Lag, In Manufacturing Companies. Udayana
University Accounting E-Journal, 17 (1), 311-337.
Senata, M. (2016). The Effect of Dividend Policy on the
Value of Companies Listed in the LQ-45 Index of the
Indonesia Stock Exchange. Journal of Micro-Civil
Economics Entrepreneurs, 6 (1), 73-84.
Sudarno & Triyaningtyas, M. (2019). Factors Influencing
Audit Report Lag Financial Statements (Empirical
Study of Service Companies Listed on the Indonesia
Stock Exchange 2012-2015). Diponegoro Journal Of
Accounting, 1-9.
Sundjaja, R. S., & Barlian, I. (2001). Financial
Management (3rd ed.). Jakarta: Prenhallindo.
Suwanda, D. (2015). Factors Affecting Quality of Local
Government Financial Statements to Get Unqualified
Opinion (WTP) of Audit Board of the Republic of
Indonesia (BPK). Research Journal of Finance and
Accounting (Paper), 6 (4).
Widhiasari, N. M., & Budiartha, I. K. (2016). The Influence
Of Company Age, Company Size, Auditor's
Reputation, And Auditor Changes On Audit Report
Lag. Udayana University Accounting E-Journal, 15 (1),
200-227.
Widiastuti, I. D., & Kartika, A. (2018). Company Size,
Profitability, Company Age, Solvability And Kap Size
Against Audit Report Lag. Dynamics of Accounting,
Finance and Banking, 7 (1), 20-34. www.idx.co.id
ICRI 2021 - International Conference on Recent Innovations
214
