
The Scatter of Retinal Position Affects the Formation of Orientation
Map
Chong Jiao
a
, Ming Li
b
and Dewen Hu
c
College of Intelligence Science and Technology, National University of Defense Technology, Changsha, Hunan, China
Keywords: Visual Cortex, Orientation Map, MDS, Pinwheel, Salt-And-Pepper Map.
Abstract: The neurons in the primary visual cortex of mammals have been found to have significant orientation
selectivity. In the higher mammals, the neurons with similar preferred orientation clustered together to form
a pinwheel-like pattern, which is thought as a strategy to reduce wiring cost. In contrast, the preferred
orientation of neurons in rodents are randomly distributed, which is termed as salt-and-pepper map. Why the
mammals have such two distinct organizational pattern remains to be explored and this will be important for
understanding the principles of the visual information processing in cortex. In this paper, we used a
multidimensional scaling (MDS) model to study the spatial distribution of the preferred orientation and
retinotopic position with the objective of minimizing wiring cost. Our results suggested that the scatter of
retinotopic position in an orientation column was a critical factor on the formation of pinwheel map or salt-
and-pepper map; higher mammals with ordered retinotopic position tend to have continuous map while
rodents with relatively larger scatter of retinotopic position tend to have random map.
1 INTRODUCTION
Even though the deep learning (LeCun et al. 2015)
technology has achieved incredible performance on
many vision tasks, it still suffers from problems such
as overfitting and lack of explanation (Krizhevsky et
al. 2017). The study on the information processing in
the biological visual system will provide an
opportunity to solve these problems and will be an
important step towards general artificial intelligence
(Bashivan et al. 2019, George et al. 2017). This paper
focus on the organization of orientation map in the
primary visual cortex of mammals. Neurons in the
primary visual cortex of mammals have significant
orientation selectivity (Hubel and Wiesel 1962,
Hubel and Wiesel 1959); only the light stimuli at the
preferred orientation could evoke the response of
neurons most effectively. In the higher mammals
including carnivorous and primates, the neurons with
similar orientation will cluster together to form a
highly ordered pinwheel-like pattern (Bonhoeffer and
Grinvald 1991, Ohki et al. 2006). Specifically, the
orientation preference of neurons gradually changes
a
https://orcid.org/0000-0002-3504-9707
b
https://orcid.org/0000-0002-9471-9897
across the cortex to form pinwheel-like patters where
orientation changes from 0 degree to 180 degrees
around the pinwheel center, clockwise or
anticlockwise. In contrast, the neurons in the primary
visual cortex of rodents are randomly distributed
irrespective of the orientation preference (Ohki et al.
2005), which is termed as salt-and-pepper map. The
study on why this distinct orientation map exist in the
mammals will help us understand the principles of
visual information processing in the cortex.
There have been many models developed to study
the origin of pinwheel map, such as the simple spin
model (Cowan and Friedman 1990), dimension
reduction model (Durbin and Mitchison 1990) and
the coordinated map including multi-features(Yu et
al. 2005). These models achieved realistic map like
the experimental findings. However, they did not
explain why the rodents lacks orientation map.
Recently, Weigand proposed a multi-dimensional
(MDS) model to study the difference of orientation
map in rodents and higher mammals (Weigand et al.
2017), and suggested the number of cells could be an
important factor leading to the difference of
orientation map. However, their model did not agree
c
https://orcid.org/0000-0001-7357-0053
146
Jiao, C., Li, M. and Hu, D.
The Scatter of Retinal Position Affects the Formation of Orientation Map.
DOI: 10.5220/0011206800003444
In Proceedings of the 2nd Conference on Artificial Intelligence and Healthcare (CAIH 2021), pages 146-151
ISBN: 978-989-758-594-4
Copyright
c
2022 by SCITEPRESS – Science and Technology Publications, Lda. All rights reserved
with the experimental observation very well
(Ibbotson and Jung 2020) because they overlooked
other features of neurons; for instance, retinotopic
position was also an prominent feature of neurons in
the primary visual cortex..
In this paper, we extend the MDS model to study
the map of retinotopic position and orientation
preference simultaneously. We optimized the spatial
distribution of these two tuning properties by
minimizing the wiring cost, equivalently speaking, by
putting neurons with similar tuning preference
together. Our results suggested that the competition
between retinotopic position and orientation could
explain the emergence of pinwheel map and salt-and-
pepper map. Specifically, the scatter of retinotopic
position in an orientation column was a critical factor
on the formation of pinwheel map or salt-and-pepper
map; higher mammals with ordered retinotopic
position tend to have continuous map of orientation
while rodents with relatively larger scatter of
retinotopic position tend to have random map.
2 METHODS
From the view of dimension reduction framework
(Durbin and Mitchison 1990), the visual map can be
thought as a projection from high dimensional feature
space onto the two dimensional cortex surface.
Similar features should be mapped in close vicinity to
reduce wiring cost (Weigand et al. 2017) and enhance
robust computation (Stringer et al. 2019). This
motivated us to compare the optimal placement of
orientation preference of neurons with the observed
orientation map in the experiments, which will help
us to understand the mechanisms behind the neuronal
map. Specifically, we tried to obtain the optimal
orientation map by placing neurons according to their
tuning similarity and studied which factor leads to the
emergence of pinwheel-like map like in higher
mammals or random map like in rodents. MDS is a
classical method to transform the inputs from the high
dimensional space to subspace while preserving the
distance in the original space (Borg and Groenen
2005), which has been successfully used to study the
spatial distribution of orientation preference
(Weigand et al. 2017). However, they only
considered the spatial distribution according to the
orientation similarity but ignoring the contribution of
other tuning properties to the final spatial
distribution. In fact, the feature maps, especially the
retinotopic position and orientation preferences, are
strongly dependent (Durbin and Mitchison 1990, Yu
et al. 2005).
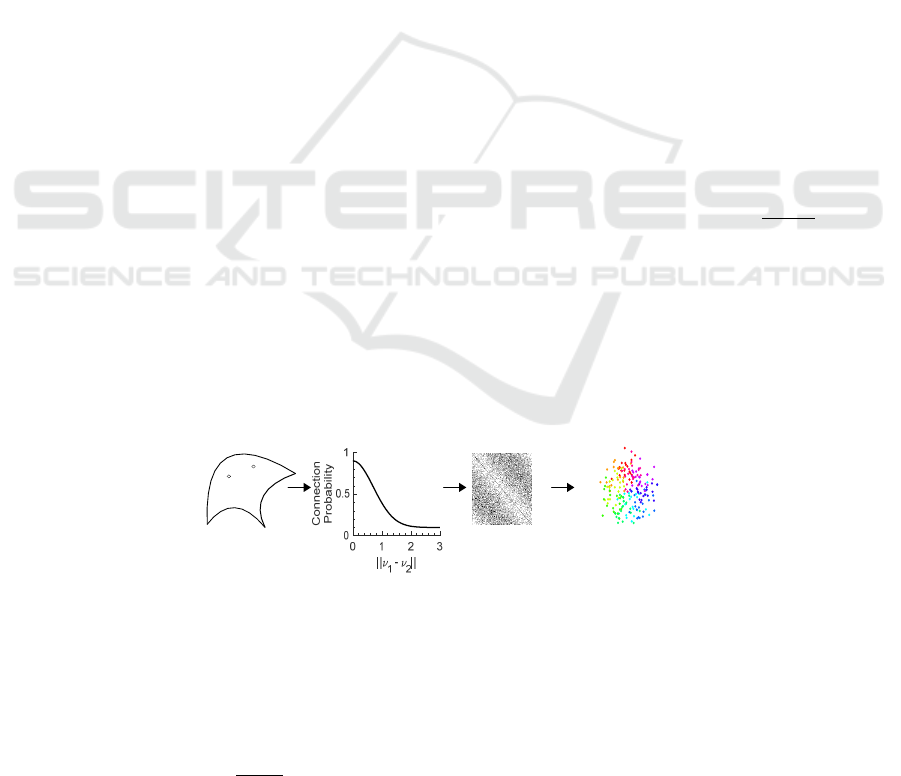
In this paper, we extend the method to study the
spatial distribution of both the orientation preference
and retinotopic position simultaneously. The method
is illustrated in Figure 1. The receptive field
properties (including retinotopic position,
orientation, spatial frequency et al) are represented by
a vector 𝑣
. We defined the connection probability of
two neurons based on their tuning similarity as in
equation (1).
𝜌(𝑖, 𝑗) = 𝑎 + 𝑏 ∗ 𝑒
∥
∥
(1)
Where a is the constant connection probability
between two arbitrary neurons, b is the gain of the
selectivity. The feature selectivity is controlled by the
parameter 𝜎, which is illustrated in figure 2. With a
random process defined with the connection
probability, we could obtain the binary connection
matrix C.
Spatial distribution
of cells
High dimensional
feature space
v
1
v
2
Binary connection
matrix
MDS
Figure 1: Method to obtain the optimal spatial distribution with MDS model.
To get the dissimilarities of each paired neurons,
we used Jaccard distance in equation (2) as the feature
distance, which was the same as in previous study
(Weigand et al. 2017).
JD = 1 −
|𝑪
⋂𝑪
|
|𝑪
⋃𝑪
|
(2)
Where 𝑪
is the set of all other neurons which
has a connection with neuron i. With the
dissimilarities defined for each pair of neurons, we
could use the metric MDS to get the spatial
distribution of these neurons in a two-dimensional
space. the whole process was illustrated in Figure 1.
Our method is an modification to the method in
The Scatter of Retinal Position Affects the Formation of Orientation Map
147
(Weigand et al. 2017) to support the high dimensional
feature space rather than only orientation for the
original method.
In this paper, we studied the retinotopic position
and orientation preference simultaneously. The
feature vector can be defined as a 4-dimensional
vector as (𝑥, 𝑦, 𝑟 ∗ cos(2𝜃), 𝑟 ∗ sin(2𝜃)), where x
and y denote the cartesian coordinates of retinotopic
position, 𝜃 denotes the preferred orientation and r is
the orientation selectivity. The MDS operation was
implemented by the mdscale function in Matlab.
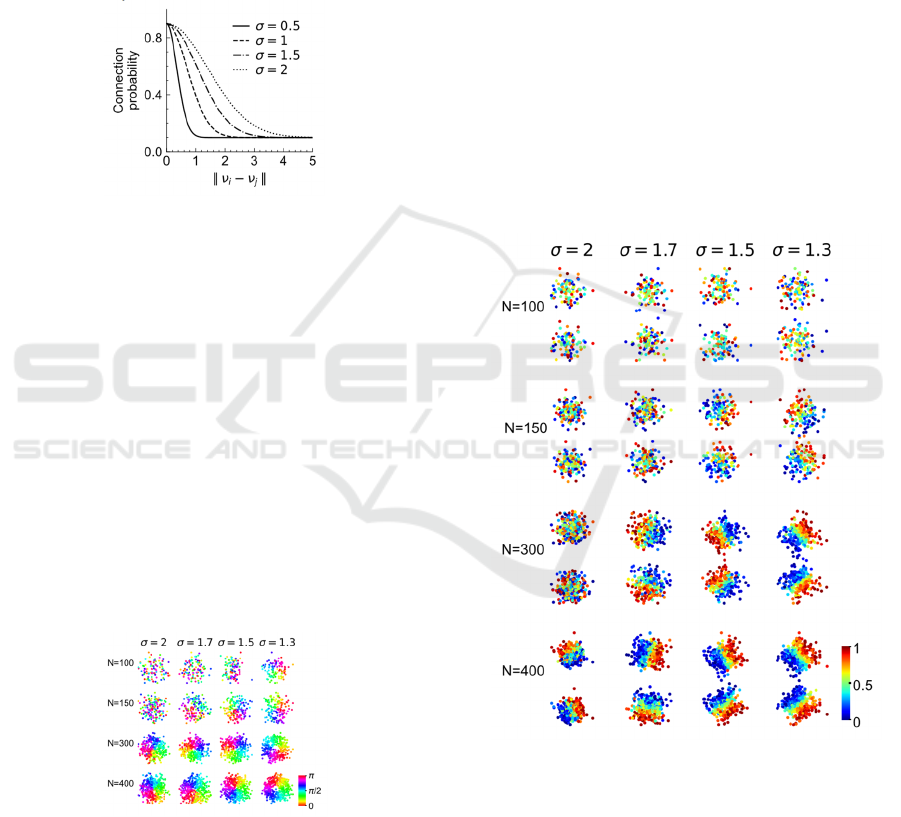
Figure 2: Connection probability function with different
feature selectivity.
3 EXPERIMENTAL RESULTS
3.1 Spatial Distribution of Orientation
Preference
We first studied the spatial distribution when only
considering the orientation preference. With the
method in section 2, we first defined the feature
vector as ( 𝑟 ∗ cos(2𝜃), 𝑟 ∗ sin(2𝜃)) , where 𝜃
denotes the preferred orientation. We studied the
impact of orientation selectivity 𝜎 and the number
of cells N on the final spatial distribution. All the
preferred orientation was uniformly distributed in
(0, 𝜋).
Figure 3: Pinwheel patterns emerges with increasing
number of cells or greater orientation selectivity.
With the MDS transformation (see Methods), the
results are illustrated in Figure 3. The color of each
cell is assigned according to their orientation
preference, which was illustrated in the bottom right
corner. It can be seen in Figure 3 that increasing the
selectivity (decreasing 𝜎, from left to right) will lead
to the emergence of pinwheel map. In addition,
increasing the number of cells (from top to bottom)
will also result in the appearance of pinwheel pattern.
Our results is similar to the report in(Weigand et al.
2017), which proved our adaptation to
multidimension model was valid. However, this
results was not fully consistent with the experimental
observation (Ibbotson and Jung 2020). Part of the
reason was that this modelling methods ignored the
interdependence of cortex maps, which had been
found in the experimental results. For instance, the
orientation, ocular dominance, and spatial frequency
domains has been demonstrated a clear influence of
each other (Yu et al. 2005). This motivated us to
model multi-features simultaneously.
3.2 The Spatial Distribution of
Retinotopic Position
Figure 4: The spatial distribution of retinotopic position
becomes ordered with increasing number of cells or feature
selectivity.
Besides the orientation, one of the most prominent
features is the retinotopic position. Thus, we further
studied the distribution of retinotopic position with
the same method. The feature space is a two-
dimensional vector defined as (x, y), which are the
cartesian coordinates of retinotopic position
respectively. In this model, both of x and y were
CAIH 2021 - Conference on Artificial Intelligence and Healthcare
148
uniformly distributed in the range of (0, 1). The
results are illustrated in figure 4. The colors from blue
to red corresponds to the value of 0 to 1. For each
parameter combination, top panel denotes the
distribution of x and the bottom panel denotes the
distribution of y. It can be seen in Figure 4 that the
ordered map appeared when increasing the number of
cells (from top to bottom) or increasing the feature
selectivity (from left to right), which was similar to
the results on the orientation distribution. An
interesting finding is that the gradient of x and y is
near orthogonal to each other in the ordered map
(bottom right) even though we did not constrain their
relation explicitly, which suggested our model could
capture the dependent relations of different features.
3.3 Mapping the Orientation and
Retinotopic Position
Simultaneously
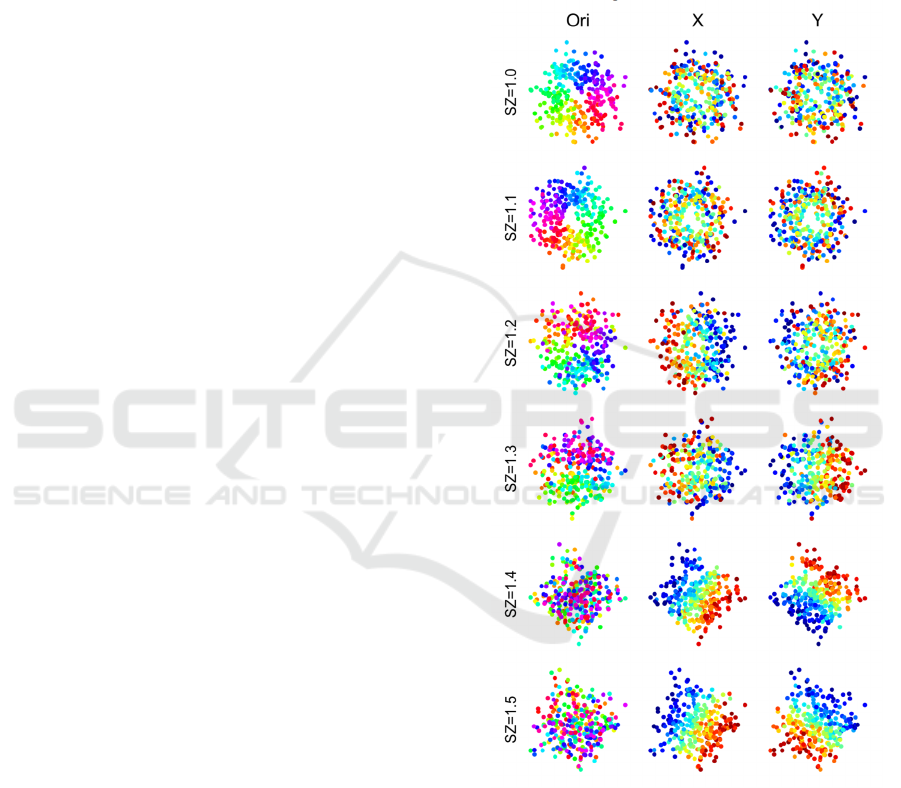
We further studied the spatial distribution of
retinotopic position and preferred orientation
simultaneously to study the interdependence of both
cortex maps. The feature space is defined as
(𝑥,𝑦,𝑟∗𝑐𝑜𝑠(2𝜃),𝑟∗𝑠𝑖𝑛(2𝜃))(see Methods). The
range of the retinotopic position reflect the scatter of
retinotopic position in the orientation column. Thus,
we define the domain of x and y as (0, SZ), where SZ
defined the scatter of retinotopic position in the
orientation column. We set the number of cells
N=300 and feature selectivity 𝜎=1.2. With this
configuration, both distribution of retinotopic
position and orientation should appear as an ordered
map if we consider these features independently (see
Figure 3 and Figure 4). We want to know the impact
of SZ on the optimal spatial distribution. The results
can be seen in Figure 5 that, when increasing the SZ,
the retinotopic position gradually dominates the
spatial distribution of neurons and the pinwheel map
of orientation in the first row became randomly
distributed.
This situation was reminiscent of the
experimental results that rodents tend to have greater
scatter of retinotopic position compared to cat or
Macaque (Marshel et al. 2011, Schuett et al. 2002,
Van den Bergh et al. 2010), which suggested the
scatter of retinotopic position might be an important
factor to the emergence of orientation map.
To quantify the pinwheel pattern, we used the
correlation coefficients between preferred orientation
and azimuth in the spatial distribution. This index was
also used by the previous research (Ohki et al. 2006,
Weigand et al. 2017). To obtain the correlation
coefficients between orientation and azimuth, we
denoted the preferred orientation at the azimuth of 𝜋
as 𝜋/2, and the subtract this orientation to obtain the
preferred orientation relative to this angle. To reduce
the estimation error, we only consider the cells which
lie at the azimuth in the range of (𝜋/4, 7𝜋/4). The
results were shown in Figure 6 and it can be seen that
the linear correlation gradually disappeared when
increasing the SZ, which was in agreement with the
observation in Figure 5.
Figure 5. The spatial distribution of tuning preferences
including orientation (Ori) and retinotopical position (X
and Y) changes with the scatter size in an orientation
column.
The Scatter of Retinal Position Affects the Formation of Orientation Map
149
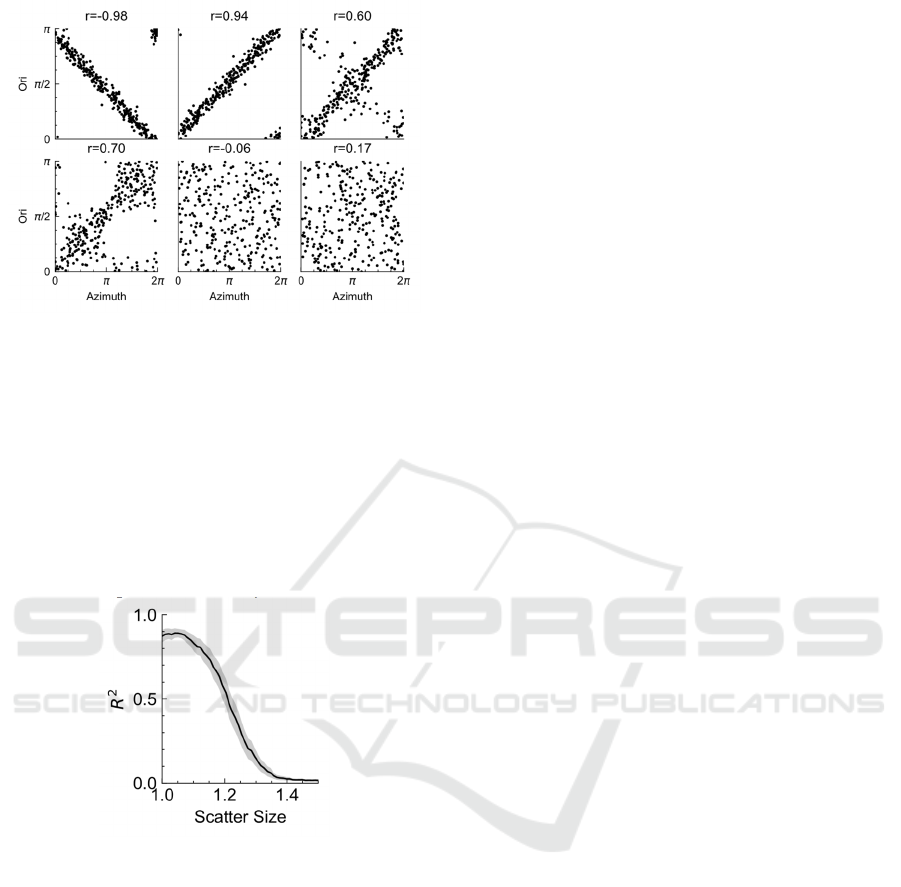
Figure 6. The scatter plot of preferred orientation (Ori)
versus azimuth for different scatter size.
We further explored the change of the squared of
correlation coefficients (𝑅
) with the scatter (SZ). We
computed the corresponding 𝑅
for SZ in the range
of (1.0, 1.5) and repeat 15 times for each parameter
configuration. Figure 7 gave the variation curve of
𝑅
with the change of SZ. It was clear that the 𝑅
had a sharp decrease when the SZ exceed some value,
which suggested a transition of orientation map from
pinwheel-like pattern to a totally random map.
Figure 7. The squared correlation coefficients ( 𝑹
𝟐
)
decreases with scatter size; the shadow area indicates
standard bias; the sharp decrease of 𝑹
𝟐
indicates a
transition from pinwheel-like map to a totally random map.
4 CONCLUSIONS
In this paper, we extend the MDS model (Weigand et
al. 2017) to study the optimal placement of
retinotopic position and orientation simultaneously
with the objective of minimizing wiring cost. Our
first result revealed that the feature selectivity and the
number of cells were both important factors for the
emergence of ordered map, which was consistent
with previous study (Weigand et al. 2017). Moreover,
we further extended this model and found that when
considered the orientation preference and retinotopic
position simultaneously, the scatter of retinotopic
position had great impact on the appearance of
pinwheel map. In particular, when the scatter of
retinotopic position exceed some threshold, the
pinwheel map sharply disappeared and deteriorated
into a random map. In fact, the study on mouse
retinotopic mapping indeed showed a larger scatter
compared with cat (Garrett et al. 2014). Our results
also were in consistent with the report that the central-
to-peripheral ratio (CP ratio) of retinal cell density
can be used to predict the pinwheel map (Ibbotson
and Jung 2020). The central vision tends to have
greater cortical magnification factor and less scatter.
This means that mammals with higher CP ratio will
have less scatter in the central vision thus having a
greater chance to form pinwheel map. Recent study
on mouse also found a cortex region with enhanced
spatial resolution like the fovea of higher mammals
(van Beest et al. 2021), which suggested that the
functional architecture of visual cortex of higher
mammals and rodents might not have huge difference
as previously thought. Our results implied that the
pinwheel map of higher mammals and random map
of rodents might emerge with the scatter of
retinotopic position even though they have no
difference in the organizational principles.
However, a through survey and quantitative
estimate of the degrees of scatter for mammals is
required to obtain a solid conclusion. Besides the
retinotopic position and orientation, the ocular
dominance and spatial frequency are also important
features for neurons in the primary visual cortex.
Experimental studies suggested that these functional
maps had subtle interdependent relations (Nauhaus et
al. 2016, Nauhaus et al. 2012). A comprehensive
model including all of these factors might provide
insights about the organization of cortex map of
mammals.
ACKNOWLEDGEMENTS
This research was funded by the National Natural
Science Foundation of China, grant number
6207022592.
REFERENCES
Bashivan, P., Kar, K., DiCarlo, J.J. (2019). Neural
population control via deep image synthesis. Science.
364, eaav9436.
CAIH 2021 - Conference on Artificial Intelligence and Healthcare
150

van Beest, E.H., Mukherjee, S., Kirchberger, L., Schnabel,
U.H., van der Togt, C., Teeuwen, R.R.M., Barsegyan,
A., Meyer, A.F., Poort, J., Roelfsema, P.R., et al.
(2021). Mouse visual cortex contains a region of
enhanced spatial resolution. Nat Commun. 12, 4029.
Bonhoeffer, T., Grinvald, A. (1991). Iso-orientation
domains in cat visual cortex are arranged in pinwheel-
like patterns. Nature. 353, 429–431.
Borg, I., Groenen, P.J.F. (2005). Modern multidimensional
scaling: theory and applications. 2nd ed. (New York:
Springer),.
Cowan, J.D., Friedman, A.E. (1990). Simple Spin Models
for the Development of Ocular Dominance Columns
and Iso-Orientation Patches. NIPS. In NIPS, .
Durbin, R., Mitchison, G. (1990). A dimension reduction
framework for understanding cortical maps. Nature.
343, 644–647.
Garrett, M.E., Nauhaus, I., Marshel, J.H., Callaway, E.M.
(2014). Topography and Areal Organization of Mouse
Visual Cortex. J Neurosci. 34, 12587–12600.
George, D., Lehrach, W., Kansky, K., Lázaro-Gredilla, M.,
Laan, C., Marthi, B., Lou, X., Meng, Z., Liu, Y., Wang,
H., et al. (2017). A generative vision model that trains
with high data efficiency and breaks text-based
CAPTCHAs. Science. 358, eaag2612.
Hubel, D.H., Wiesel, T.N. (1959). Receptive fields of
single neurones in the cat’s striate cortex. J Physiol.
148, 574–591.
Hubel, D.H., Wiesel, T.N. (1962). Receptive fields,
binocular interaction and functional architecture in the
cat’s visual cortex. J Physiol. 160, 106–154.
Ibbotson, M., Jung, Y.J. (2020). Origins of Functional
Organization in the Visual Cortex. Front Syst Neurosci.
14, 10.
Krizhevsky, A., Sutskever, I., Hinton, G.E. (2017).
ImageNet classification with deep convolutional neural
networks. Commun ACM. 60, 84–90.
LeCun, Y., Bengio, Y., Hinton, G. (2015). Deep learning.
Nature. 521, 436–444.
Marshel, J.H., Garrett, M.E., Nauhaus, I., Callaway, E.M.
(2011). Functional specialization of seven mouse visual
cortical areas. Neuron. 72, 1040–1054.
Nauhaus, I., Nielsen, K.J., Callaway, E.M. (2016). Efficient
Receptive Field Tiling in Primate V1. Neuron. 91, 893–
904.
Nauhaus, I., Nielsen, K.J., Disney, A.A., Callaway, E.M.
(2012). Orthogonal micro-organization of orientation
and spatial frequency in primate primary visual cortex.
Nat Neurosci. 15, 1683–1690.
Ohki, K., Chung, S., Ch’ng, Y.H., Kara, P., Reid, R.C.
(2005). Functional imaging with cellular resolution
reveals precise micro-architecture in visual cortex.
Nature. 433, 597–603.
Ohki, K., Chung, S., Kara, P., Hübener, M., Bonhoeffer, T.,
Reid, R.C. (2006). Highly ordered arrangement of
single neurons in orientation pinwheels. Nature. 442,
925–928.
Schuett, S., Bonhoeffer, T., Hübener, M. (2002). Mapping
retinotopic structure in mouse visual cortex with optical
imaging. J Neurosci Off J Soc Neurosci. 22, 6549–
6559.
Stringer, C., Pachitariu, M., Steinmetz, N., Carandini, M.,
Harris, K.D. (2019). High-dimensional geometry of
population responses in visual cortex. Nature. 571,
361–365.
Van den Bergh, G., Zhang, B., Arckens, L., Chino, Y.M.
(2010). Receptive-field Properties of V1 and V2
Neurons in Mice and Macaque monkeys. J Comp
Neurol. 518, 2051–2070.
Weigand, M., Sartori, F., Cuntz, H. (2017). Universal
transition from unstructured to structured neural maps.
Proc Natl Acad Sci. 114, E4057–E4064.
Yu, H., Farley, B.J., Jin, D.Z., Sur, M. (2005). The
Coordinated Mapping of Visual Space and Response
Features in Visual Cortex. Neuron. 47, 267–280.
The Scatter of Retinal Position Affects the Formation of Orientation Map
151
