
Automatic Breast Density Measurement and Prognostic Methods of
Postoperative Tamoxifen Therapy for Breast Cancer
Hui Li
1a
, Jiao Li
2b
, Haojiang Li
2c
, Shuchao Chen
1d
, Lizhi Liu
2e
and Hongbo Chen
1f
1
Life and Environmental Sciences College, Guilin University of Electronic Technology, Guilin, China
2
Sun Yat-sen University Cancer Center, Guangzhou, China
Keywords: Breast Cancer, Mammographic Density, Deep Learning, Breast Cancer Prognosis.
Abstract: In order to explore a prognostic analysis method of postoperative tamoxifen treatment for breast cancer from
mammography, the squeeze-and-convolutional Neural Network (SE-CNN) method was used to investigate
the model of mammographic density automatic extraction from mammography and the prognostic effect of
mammographic density on tamoxifen treatment for breast cancer. The results show that the mammographic
density change rate of the subjects before and 15 months after surgery was extracted, and the mammographic
density change rate cut value was obtained by density map method, and the subjects were divided into groups.
The progression-free survival was HR: 2.654(95%CI,1.102-6.395), P =0.030. Patients with high
mammographic density change rate had a better prognosis, while those with low mammographic density
change rate had a worse prognosis. It is concluded that mammographic density change rate value can be a
potential prognostic factor of postoperative tamoxifen treatment for breast cancer.
1 INTRODUCTION
Breast cancer is the most common cancer in women
and the leading cause of cancer deaths in women
worldwide (Siegel 2020, Peng 2020, Deng 2020).
Endocrine therapy is an important part of the
comprehensive treatment of breast cancer (Oladeru
2020) and plays an important role in the prevention
of postoperative recurrence and metastasis of breast
cancer (Chlebowski 2021). Tamoxifen is an estrogen
receptor antagonist, which can combine with estrogen
receptors on the cell membrane to form a complex,
thus preventing estrogen from playing a role, and is
an important postoperative treatment for breast
cancer (Rahem 2020). It is of great clinical
significance to study the key prognostic factors of
postoperative tamoxifen treatment for breast cancer.
In recent years, some researchers have been
committed to studying the prognostic factors of
postoperative tamoxifen treatment for breast cancer
from the perspective of bioinformatics. Flap
endonuclease-1(Xu 2021), PDHA2-APRT gene pair
a
https://orcid.org/0000-0002-6110-6920
b
https://orcid.org/0000-0002-8980-2899
c
https://orcid.org/0000-0003-0784-1235
(Lv 2019), MFG-AS1(Feng 2020), etc., have been
considered as important prognostic biomarkers for
breast cancer after tamoxifen treatment. CXCL10 can
be used as a biomarker to predict the prognosis of
breast cancer and as a therapeutic target for tamoxifen
resistance (Wu 2020). The high expression of TRAF4
predicts a poor prognosis in the treatment of breast
cancer with tamoxifen, and promotes tamoxifen
resistance (Zhou 2020). In addition, there are some
studies looking for prognostic markers from medical
images. For example, surface dispersion coefficient in
magnetic resonance imaging has been proved to be a
marker that can be used to evaluate the effectiveness
of tamoxifen in the treatment of breast cancer (Zhai
2013).
Mammography is the most common examination
method for breast cancer patients, and it is of clinical
significance to obtain accurate prognostic markers
from mammography. Mammographic density (MD)
refers to the proportion of breast glandular tissue in the
overall projection of the breast in Mammographic
images (Sherratt 2016). It is a measure of the relative
quantity of glandular tissue in the breast (Bell 2020)
d
https://orcid.org/0000-0002-3579-4812
e
https://orcid.org/0000-0001-7875-9074
f
https://orcid.org/0000-0002-7063-5410
Li, H., Li, J., Li, H., Chen, S., Liu, L. and Chen, H.
Automatic Breast Density Measurement and Prognostic Methods of Postoperative Tamoxifen Therapy for Breast Cancer.
DOI: 10.5220/0011161300003444
In Proceedings of the 2nd Conference on Artificial Intelligence and Healthcare (CAIH 2021), pages 39-46
ISBN: 978-989-758-594-4
Copyright
c
2022 by SCITEPRESS – Science and Technology Publications, Lda. All rights reserved
39

and has been proved to be related to the sensitivity and
specificity of breast cancer screening (Lynge 2019).
MD has been proposed as a biomarker to predict the
risk of breast cancer, the possibility of cancer
recurrence, the response to neoadjuvant chemotherapy
and survival rate (King 2011). Changes in MD reflect
changes in the amount of collagen and epithelial and
non-epithelial cells in mammary gland (Boyd 2011).
MD is not a static characteristic, and unlike most
breast cancer risk factors, MD can be changed (Boyd
2011), and the change of MD is associated with the
increased risk of breast cancer, advanced tumor stage
at diagnosis, local recurrence and the increased risk of
the second primary cancer (Huo 2014). Increased MD
is associated with increased risk of breast cancer, and
reduced MD is accompanied by reduced risk (Román
2019).
In clinical practice, MD is obtained primarily on
the basis of subjective visual assessments that rely on
radiologists, and has been shown to have significant
intra-physician and inter-physician variability.
Cumulus Software, a quantitative imaging analysis
software, has been developed for quantitative
measurement of dense tissue in breast by
molybdenum target (Byng 1998), which is the gold
standard for MD measurement (Nguycn 2018, Boyd
2010, Kerlikowske 2015). This is a semi-automatic
observer aid based on an interactive threshold. The
observer subjectively selects a threshold gray level
that facilitates recognition, separating glandular
tissue from fat. The interactive computer-aided
segmentation program based on the K-means
clustering algorithm measured MD, requiring manual
judgment of whether it was pectoral muscle, and then
segmental glandular tissue based on the K-means
clustering algorithm, and then calculated MD (Glide
2007). However, these semi-automatic MD
measurement methods require training of observers
and the measurement results are subject to subjective
factors of observers. A gland probability map is
generated in the method of MD estimation based on
Deep Convolutional Neural Network (DCNN), and
MD is estimated according to the ratio of the gland
probability map to the breast area (Li 2018).
Segmentation of breast and dense fibroglandular
region based on full convolutional network, this
method uses VGG16 network as the basic network
structure and fine-tuning network to achieve
segmentation of breast and gland dense region
respectively (Lee 2018). However, the MD
distribution of each patient was different, and the
mammary gland in some molybdenum target images
showed scattered distribution, dark gray scale and
fine structure. Deep learning probability maps or
segmentation methods can better segment the dense
areas of glands, but some non-densely aggregated
glandular tissues are often ignored, resulting in
deviations between measured MD and the actual
value.
Aiming at the existing problems in breast density
measurement, we proposed an automatic breast
density measurement method based on deep learning.
Firstly, the deep learning method is used to achieve
the precise segmentation of breast region. Then, the
Squeeze-and-Excitation Convolutional Neural
Network (SE-CNN) for MD is used to realize the
automatic measurement. To obtain accurate MD
value of breast cancer patients. In order to study the
key factors for the evaluation of postoperative
tamoxifen treatment for breast cancer, we analyzed
the prognostic capability of Mammographic density
change ratio (MDCR) before and after treatment to
explore the prognostic analysis method of
postoperative tamoxifen treatment for breast cancer.
This paper attempts to find breast cancer patients with
good postoperative tamoxifen treatment effect from
the perspective of imaging and improve the treatment
effect of breast cancer.
2 MATERIALS AND METHODSM
2.1 Dataset
This study was approved by the Ethics Committee of
Cancer Center of Sun Yat-sen University with the
approval number szR2020-170. The data were all
from the Cancer Prevention and Treatment Center of
Sun Yat-sen University, and there were two
independent data sets, model data and prognostic
data. The model data was used to train the MD
automatic measurement model, and the prognostic
data was used to obtain MDCR, and to analyze the
prognosis of postoperative tamoxifen treatment for
breast cancer.
2.1.1 Model Data
In the training of MD automatic measurement model,
due to the subjectivity and inaccuracy of manual
labeling threshold when setting threshold label in SE-
CNN threshold regression network model, Selenia
Dimensions instrument newly introduced by Cancer
Prevention and Treatment Center of Sun Yat-sen
University can indirectly obtain the gray threshold of
gland area. This label can avoid the error caused by
manual labeling. Therefore, data from the machine
were used to train the MD automatic measurement
CAIH 2021 - Conference on Artificial Intelligence and Healthcare
40
model, including 246 molybdenum target images
from 246 patients, which were collected from March
2021 to June 2021, and the image resolution was
1136×944.
2.1.2 Prognostic Data
In this dataset, there were 858 mammographic images
with a resolution of 1915×2295. The data set was
from 429 patients. The patients were first treated from
April 2008 to December 2015. During follow-up, all
patients were treated with tamoxifen according to the
NCCN Breast Cancer Clinical Practice Guidelines
(8th edition) (Gradishar 2021). The time points of
molybdenum imaging were before surgery and 15
months after endocrine therapy for each patient, with
a median age of 44(25-61) years, a median height of
158(142-170) cm, and a median weight of 56(35-165)
kg. Median follow-up time was 59.8(6-82) months,
resulting in overall survival, progression-free
survival, distant metastasis-free survival, and
regional relapse-free survival.
2.2 Experiment
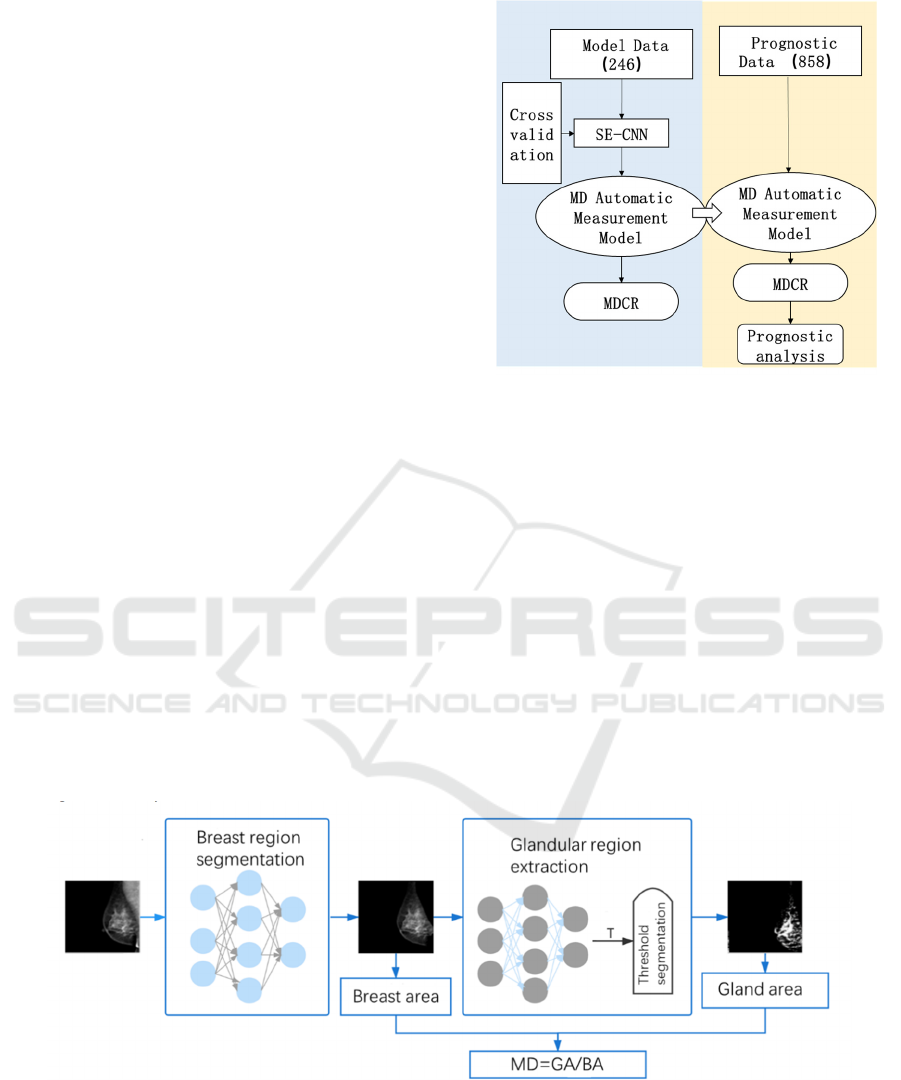
As shown in Figure 1, this experiment is divided into
two parts. The first part is the training and verification
of the MD automatic measurement model based on
model data, and the model with the best effect is
found through the five-fold cross-verification. Then,
based on the prognostic data, the MDCR value of the
prognostic data was obtained by the MD automatic
measurement model, and the prognostic ability of
MDCR value as a prognostic factor was obtained by
the prognostic analysis method.
Figure 1: Experimental design block diagram.
2.3 MD Automatic Measurement
Model
MD refers to the ratio of gland area to breast area, that
is, MD=GA/BA, where GA and BA represent gland
area and breast area respectively. As shown in Figure
2, the U-Net Plus method was firstly used to segment
the breast area and obtain the breast area BA. Then
the SE-CNN network was used to achieve the gray
threshold regression of the breast area and obtain the
threshold of gland segmentation in the breast area, so
as to realize the extraction of the gland area and
obtain the gland area GA. Finally, the MD value was
calculated.
Figure 2: Flow chart of MD automatic measurement model.
2.3.1 Breast Region Segmentation based on
U-NET Plus Network
U-net Plus network (Chen 2019) performs well in the
segmentation of esophageal cancer and esophageal
cancer in 2d CT slices. Its advantage lies in the use of
two U-shaped structures to enhance the extraction
ability of complex and abstract features, which can
effectively solve the problem of irregular and fuzzy
boundary segmentation. In the molybdenum target
Automatic Breast Density Measurement and Prognostic Methods of Postoperative Tamoxifen Therapy for Breast Cancer
41
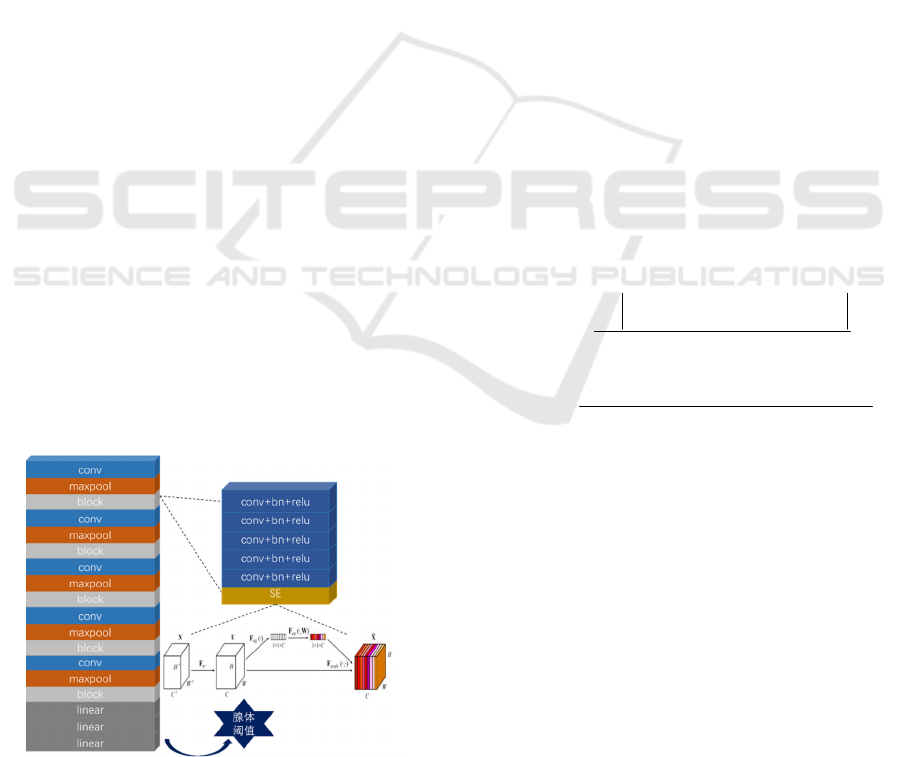
image used in this paper, the boundary of the breast
area is dark and the contour is fuzzy. The U-Net Plus
network can effectively complete the segmentation
task of the breast area and remove the surrounding
muscle and nipple tissues.
After testing, the DICE value of breast region
segmentation based on U-NET Plus method reached
0.997, which accurately segmented the breast region.
This network can be used for accurate segmentation
of breast region in molybdenum target image.
2.3.2 Breast Threshold Extraction based on
SE-CNN Network
In molybdenum images, adipose tissue appears to be
grayscale smaller, while glandular tissue appears
opaque or grayscale larger. Therefore, glandular
tissue and adipose tissue can be distinguished
according to gray threshold. Since most of the
glandular tissues in the breast image are concentrated
and a few are scattered, and the glandular tissues have
different luminance, the realization of threshold
regression requires stronger feature extraction ability
of the network. Based on the channel attention
mechanism, the SE-CNN model is proposed to meet
this requirement. As shown in Figure 3, the27 model
consists of block modules of convolution layer,
nonlinear layer and maximum pooling layer. In order
to deepen the number of convolution layers, the
model uses five block modules to enhance the
network's feature extraction capability. At the same
time, the model studies the dependencies between the
channels. The attention is paid to the channels. The
SE(Squeeze-and-Excitation) module is added to each
block. Then according to this importance, the useful
features are promoted and the useless features are
suppressed to improve the accuracy of threshold
regression.
Figure 3: Diagram of SE-CNN network structure.
2.4 MDCR Calculation
The objective of this study is to explore the effect of
MDCR value on postoperative tamoxifen treatment
for breast cancer. The automatic measurement
method proposed in this paper calculates the MD
values before and after surgery respectively, so as to
obtain the change rate of MD, NAMELY,
MDCR=(MD1-MD2)/MD1, where in MD1
represents the breast density of the patient before
surgery, and MD2 represents the breast density of the
patient from endocrine therapy to follow-up time.
2.5 Statistical Methods
2.5.1 MD Automatic Measurement Model
Evaluation Method
In this paper, deep learning method is used to study
the MD automatic measurement model, so as to
realize the automatic calculation of MDCR value.
The breast area was extracted by U-NET Plus
method. In this paper, we propose a method to
determine the gland area by determining the threshold
value of gland extraction in molybdenum target
image, so as to obtain accurate MD value. We used
threshold absolute error (MAE), determination
coefficient (R^2) and Bland-Altman consistency
analysis to evaluate the performance of the new
threshold extraction method for glands. They are
defined as:
predict label
MAE
num
value value
−
=
(1)
()
()
2
2
2
1
predict label
predict
label
mean
value value
R
value value
=−
−
−
(2)
2.5.2 Prognostic Evaluation Method
MDCR cutting value was solved by density map
method in R language, and patients were divided into
groups. K-M survival analysis was used to analyze
the effect of single factor on the prognosis of
postoperative tamoxifen treatment for breast cancer.
When P<0.05, the difference in progression-free
survival between the two groups was considered
statistically significant. Cox regression analysis,
using mathematical model to fit the relationship
between survival distribution and impact factors,
evaluate the impact of impact factors on the
distribution of survival function, further verify the
clinical significance of the prognostic method.
CAIH 2021 - Conference on Artificial Intelligence and Healthcare
42
3 RESULTS
3.1 MD Automatic Measurement
Results and Analysis
In the threshold regression module, the results of
AlexNet, Vgg11 and ResNet50 models were
compared with se-CNN model. As shown in Table 1,
the average absolute error of threshold regression
results of SE-CNN network was lower than the other
three models, and the determination coefficient was
higher than the other three models. It indicates that
the threshold regression results of SE-CNN network
are more accurate.
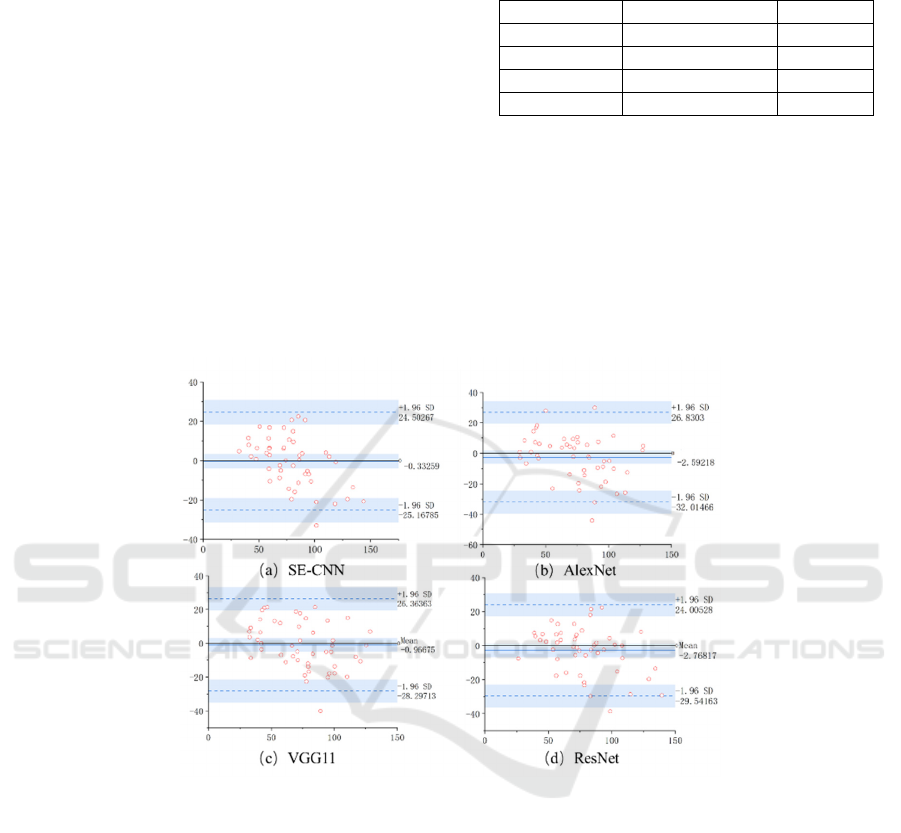
Bland-altman consistency analysis was
performed for AlexNet, VGG11, ResNet50 and SE-
CNN model threshold output and machine threshold
Table 1: Comparison of experimental results of threshold
regression model.
MAE R^2
AlexNet 12.64±5.88 0.63
VGG11 12.03±6.96 0.67
ResNet50 10.94±5.29 0.70
SE-CNN 10.41±4.78 0.74
label. Figure 4A is bland-Altman diagram of SE-
CNN model. It can be seen from the figure4 that
98%(48/49) samples are within the 95% consistency
limit. Within the consistency limit, the maximum
absolute value of difference between two groups of
data is 24.43, and the average value of difference is
0.33. Therefore, compared with the other three
models, the threshold result of SE-CNN model has
the best consistency and is the most accurate and
reliable.
Figure 4: Bland-Altman consistency analysis of threshold regression results.
3.2 MDCR Cut Value and Subjects
Were Grouped
In order to analyze the prognosis of postoperative
tamoxifen treatment for breast cancer, breast cancer
patients need to be grouped. Nuclear density
estimates were calculated and plotted using a density
map method independent of patient prognostic
information. The density map is performed by R's
package GGplot2 and the function geom_density (a
smoothed version of the histogram). As shown in
Figure5A, when the MDCR value is 5.3, the curve
reaches its peak and can be used as the optimal cutting
value. To evaluate the validity of the cut values, the
RMS software package of R was used to perform the
restricted cubic spline (RCS) function, and the Cox
regression model of the overall survival rate was
established using the RCS formula parameters. As
shown in Figure5B, with the increase of MDCR, the
risk of breast cancer progression decreases, and the
critical value of risk reduction is reached when
MDCR=5.3, which further verifies the reliability of
cutting value selection. We used MDCR=5.3 as the
cut-off value to divide breast cancer patients into two
groups and analyze the prognosis of postoperative
tamoxifen treatment.
Automatic Breast Density Measurement and Prognostic Methods of Postoperative Tamoxifen Therapy for Breast Cancer
43
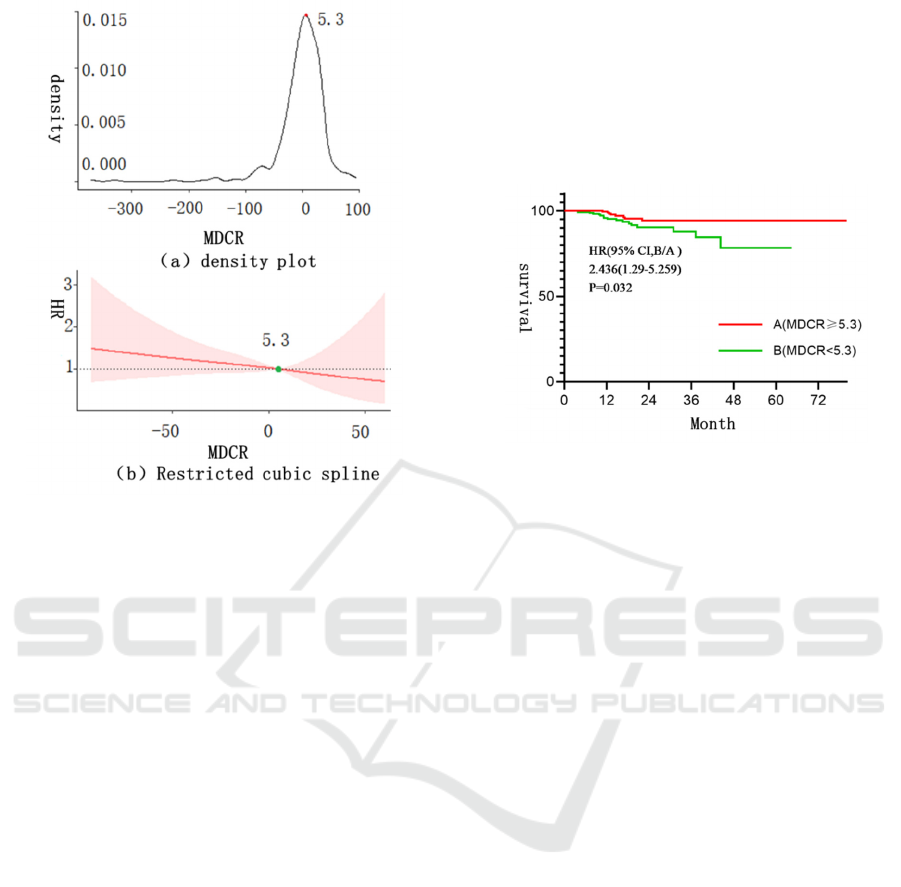
Figure 5: MDCR cutting value analysis.
3.3 Effect Evaluation of Tamoxifen
after Breast Cancer Operation
After obtaining MDCR cut values, breast cancer
patients were divided into two groups: Group
A(MDCR≥5.3) and Group B(MDC<5.3). Figure 6
shows the survival curve between the two groups.
The P-value of progression-free survival between the
two groups was 0.032 by Logrank test. There was a
significant difference between the two groups. It
can also be found that when MDCR≥5.3, the patient
survival curve is above, that is, the postoperative
tamoxifen treatment effect of this group of breast
cancer patients is better than that of the other group.
Multivariate Cox regression analysis was shown in
Table 2. Similarly, it was found that the risk rate of
MDCR was 2.654(95%CI,1.102-6.395), P=0.030.
These results suggest that MDCR can be used as a
key prognostic factor for postoperative tamoxifen
treatment of breast cancer.
Cox regression analysis was used to determine the
independent influencing factors of breast cancer
progression. Firstly, k-M analysis was performed to
screen out some meaningless variables, and factors
with p value less than 0.1 were included in Cox
regression model. K-M method was used to analyze
the following factors: age, height, weight, BMI and
MDCR, and the analysis results showed that age,
BMI and MDCR were correlated with the progression
of breast cancer. The results of Cox multivariate
analysis were shown in Table 2. MDCR (HR=2.654,
95%CI,1.102-6.395, P =0.030), BMI (HR=0.272,
95%CI, 0.088-0.846, P =0.024), Was an independent
risk factor for metastasis or recurrence in breast
cancer patients treated with tamoxifen. Follow-up
breast cancer patients with lower MDCR and higher
BMI had an increased risk of metastasis or
recurrence.
Figure 6: Survivorship curve.
4 CONCLUSIONS AND
DISCUSSIONS
In this paper, the following conclusions were drawn
through the study of automatic breast density
extraction model and the analysis of postoperative
tamoxifen treatment effect for breast cancer.
(1) In order to perform automatic prognostic
analysis of breast cancer, this paper proposed a
channel attention-based SE-CNN network to
accurately calculate breast density from molybdenum
target X-ray images. It can be seen from the
comparative analysis of performance that the
determination coefficient R^2=0.74, and from the
consistency analysis that 98% of samples are
distributed within an acceptable range. Therefore,
SE-CNN network can achieve accurate and automatic
extraction of MD.
(2) During prognostic analysis, MDCR cutting
value was obtained by density method, and the
subjects were divided into groups. The progression-
free survival between the two groups was HR
2.654(95%CI,1.102-6.395), P =0.030, showing a
significant effect. Patients with high MDCR had a
better prognosis, while those with low MDCR had a
worse prognosis. It indicates that MDCR value can be
used as a potential prognostic factor of postoperative
tamoxifen treatment for breast cancer, and can assist
doctors in finding patients with good prognosis after
postoperative tamoxifen treatment for breast cancer.
CAIH 2021 - Conference on Artificial Intelligence and Healthcare
44

Table 2: Multivariate Cox multivariate analysis.
Progres
sion-
Free
Recurrence/
Metastasis
HR (95%) P value
Adge/(year) 2.119(95%CI,0.905-4.964) 0.084
<44(n=209) 192 17
≥44(n=220) 212 8
BMI 0.272(95%CI,0.088-0.846) 0.024
<22(n=184) 176 8
≥22(n=245) 228 17
MDCR 2.654(95%CI,1.102-6.395) 0.030
<5.3(n=220)
202 18
≥5.3(n=209) 202 7
The contribution of this paper is mainly in two
aspects: 1) It explores a method to automatically
obtain accurate MD value, which effectively solves
the impact of human intervention on the prognosis of
breast cancer. The introduction of channel attention
mechanism helps the network model to be more
sensitive to glandular tissue and achieve accurate,
complete and automatic extraction of glands.2) The
prognostic factors of breast cancer in mammography
were explored and verified. MDCR has good
prognostic performance in breast cancer and can be
used as a prognostic factor for postoperative
tamoxifen treatment of breast cancer.
ACKNOWLEDGEMENTS
On the completion of this paper, I would like to
express my heartfelt thanks and respect to Hongbo
Chen and the students in the research group. This
project has been applied for national Natural Science
Foundation of China (81760322, 82171906) and
university-level innovation Project 2021YCXS174.
REFERENCES
Bell R. (2020). Mammographic density and breast cancer
screening. Climacteric, 23, 460-465.
Boyd N., Martin L. J., Bronskill M., et al (2010). Breast
tissue composition and susceptibility to breast cancer.
Journal of the National Cancer Institute, 102(16), 1224-
37.
Boyd N., Martin L. J., Yaffe M., et al (2011).
Mammographic density and breast cancer risk: current
understanding and future prospects. Breast Cancer
Research:BCR, 13, 223-223.
Byng J., Yaffe M., Jong R., et al (1998). Analysis of
mammographic density and breast cancer risk from
digitized mammograms. Radiographics : a review
publication of the Radiological Society of North
America, Inc, 18(6), 1587-98.
Chen S., Yang H., Fu J., et al (2019). U-Net Plus: Deep
Semantic Segmentation for Esophagus and Esophageal
Cancer in Computed Tomography Images. IEEE
Access, 7, 82867-82877.
Chlebowski R. T., Aragaki A., Pan K. (2021). Breast
Cancer Prevention: Time for Change. JCO oncology
practice, OP2100343.
Deng Dajun (2020). World Cancer Report 2020: Adapting
cancer prevention strategies to New trends in the cancer
epidemic. Electronic journal of integrated oncology
Therapy, 6(3), 27-32.
Feng J., Wen T., Li Z., et al (2020). Cross-talk between the
ER pathway and the lncRNA MAFG-AS1/miR-339-
5p/ CDK2 axis promotes progression of ER+ breast
cancer and confers tamoxifen resistance. Aging
(Albany NY), 12, 20658-20683.
Glide-Hurst C., Duric N., Littrup P. (2007). A new method
for quantitative analysis of mammographic density.
Medical physics, 34(11), 4491-8.
Gradishar W. J., Moran M. S., Abraham J., et al (2021).
Breast Cancer, Version 8.2021, NCCN Clinical
Practice Guidelines in Oncology. Journal of the
National Comprehensive Cancer Network: JNCCN,
18(4), 452-478.
Huo C., Chew G., Britt K., et al (2014). Mammographic
density a review on the current understanding of its
association with breast cancer. Breast Cancer Research
and Treatment, 144, 479-502.
Kerlikowske K., Zhu W., Tosteson A., et al (2015).
Identifying women with dense breasts at high risk for
interval cancer: a cohort study. Annals of internal
medicine, 162(10), 673-81.
King V., Brooks J. D., Bernstein J. L., et al (2011).
Background Parenchymal Enhancement at Breast MR
Imaging and Breast Cancer Risk. Radiology, 260(1),
50-60.
Lee J., Nishikawa R. (2018). Automated mammographic
mammographic density estimation using a fully
convolutional network. Medical Physics, 45, 117X
1190.
Li S., Wei J., Chan H., et al (2018). Computer-aided
assessment of mammographic density: comparison of
Automatic Breast Density Measurement and Prognostic Methods of Postoperative Tamoxifen Therapy for Breast Cancer
45

supervised deep learning and feature-based statistical
learning. Physics in medicine and biology, 63(2),
025005.
Lv F., Jin W., Zhang X., et al (2019). Tamoxifen therapy
benefit predictive signature combining with prognostic
signature in surgicalΠonly Er positive breast cancer.
Journal of Cellular Physiology, 234, 11140-11148.
Lynge E., Vejborg I., Andersen Z., et al (2019).
Mammographic Density and Screening Sensitivity,
Breast Cancer Incidence and Associated Risk Factors
in Danish Breast Cancer Screening. Journal of Clinical
Medicine, 8.
Nguyen T. L., Choi Y.-H., Aung Y. K., et al (2018). Breast
Cancer Risk Associations with Digital Mammographic
Density by Pixel Brightness Threshold and
Mammographic System. Radiology, 286(2), 433-442.
Oladeru O. T., Singh A. K., Ma S. J. (2020). Association of
endocrine therapy with overall survival in women with
hormone recepto’ positive, HERR negative, nod…
negative breast cancer of favorable histology. The
Breast Journal, 26, 2006-2010.
Peng Fangfang, Shen Weiyi (2020). Research progress on
the relationship between breast density and breast
cancer in Chinese and Western women. Chinese
Journal of Cancer Prevention and Treatment, 12(4),
469-474.
Rahem S. M., Epsi N., Coffman F., et al (2020). Genome-
wide analysis of therapeutic response uncovers
molecular pathways governing tamoxifen resistance in
ER+ breast cancer. EBioMedicine, 61.
Román M., Sala M., Baré M., et al (2019). Changes in
mammographic density over time and the risk of breast
cancer: An observational cohort study. Breast, 46, 108-
115.
Sherratt M., Mcconnell J., Streuli C. (2016). Raised
mammographic density: causative mechanisms and
biological consequences. Breast Cancer Research:
BCR, 18.
Siegel R., Miller K., Jemal A. (2020). Cancer statistics. CA:
A Cancer Journal for Clinicians, 70.
Wu X., Sun A., Yu W., et al (2020). CXCL10 mediates
breast cancer tamoxifen resistance and promotes
estrogen-dependent and independent proliferation.
Molecular and Cellular Endocrinology, 512.
Xu L., Shen J., Qu J.-L., et al (2021). FEN1 is a prognostic
biomarker for ER+ breast cancer and associated with
tamoxifen resistance through the EU±/cyclin D1/Rb
axis. Annals of translational medicine, 9(3), 258.
Zhai G., Grubbs C. J., Stockard C. R., et al (2013).
Diffusion Weighted Imaging Evaluated the Early
Therapy Effect of Tamoxifen in an MNU-Induced
Mammary Cancer Rat Mode. PLoS ONE, 8.
Zhou J., Li W., Ming J., et al (2020). High expression of
TRAF4 predicts poor prognosis in tamoxifen-treated
breast cancer and promotes tamoxifen resistance. Anti-
Cancer Drugs, 31, 558-566.
CAIH 2021 - Conference on Artificial Intelligence and Healthcare
46
