
The Impact of Sino-US Clean Energy Trade Complementarity on
China’s Clean Energy Consumption
Yaowu Dong, Ruoxi Hu and Denghui Duan
*
Guizhou University of Commerce, Guiyang, China 550014
Keywords: Energy Structure, Markov Chain.
Abstract.
This paper analyzes the dynamic relationship between Sino--US clean energy trade complementary index and
China’s clean energy consumption by using autoregressive distributed lagged model (ARDL) based on the
sample data from 1992 to 2017. The results show that there is a long-term cointegration relationship among
Sino—US clean energy trade complementary index, China’s clean energy consumption, economic growth,
and energy intensity. In the long run, the complementarity of clean energy trade between China and the United
States has a negative impact on the growth of China’s clean energy consumption, proves that the
complementary relationship between U.S. clean energy export growth and China’s import growth is only
reflected in theory, and there is no actual trade complementarity ,reflected in the trade between the two
countries. In the long run, the increase of per capita GDP and the decrease of energy intensity will be
accompanied by the increasing clean energy in China, which indicates that China is in the process of energy
structure optimization, and with the economic growth, the proportion of clean energy utilization is also
increasing. Besides, in the short term, the industrial structure has a positive impact on China’s clean energy
consumption, and clean energy consumption in the first lag stage also promotes the clean energy consumption
in the current period, while other factors do not significantly contribute to clean energy consumption in China.
Finally, on the basis of empirical analysis, the corresponding countermeasures and suggestions are put
forward.
1 INTRODUCTION
With the change of global climate and the destruction
of human living environment caused by the massive
use of traditional energy, global warming and
environmental pollution have become difficult
problems that all countries need to deal with together,
and the countries began to pay attention to the
development and utilization of clean energy. As the
world’s second largest economy, China is facing
internal and external pressure in the fields of climate
and environmental improvement for its annual energy
consumption and CO2 emissions are ranking first in
the world. The energy consumption in China—the
biggest increase among all countries in more than a
decade—rose by nearly half from 2007 to
2017(BP,2018). In 2017, the energy consumption of
coal and oil were top 2 of the world, which accounted
for 60.4 % and 18.8 % respectively in China.
Proportion of coal consumption is relatively high, and
put great pressure on energy conservation and
emission reduction. Based on that point, the Chinese
government has pledged to accelerate the use of clean
energy, which will reach to 35 % of total energy
consumption in China by 2030. Compared with
China, the United States is rich in clean energy
resources and has advantages in both experience and
technology in developing clean energy, while China
has just focused on strengthening international trade
cooperation and clean energy technologies in recent
years.
According to the economic development of
various countries, there is a correlation relationship
between the economic growth and the energy
consumption(Yemane, 2004; DolgpolovalI, et
al,2014; Ergin& Simbarashe, 2019) . Statistically,
there is a great difference in thermal efficiency among
different energy resources. The thermal efficiency of
natural gas is above 75%, that of oil is about 65% and
coal is 40%-60%. Therefore, based onthe energy
consumption structure of a country, the energy
efficiency will be low if the proportion of traditional
energy consumption (such as coal)is high (Meng&
Zhou,
2014). As inefficient energy consumption
10
Dong, Y., Hu, R. and Duan, D.
The Impact of Sino-US Clean Energy Trade Complementarity on China’s Clean Energy Consumption.
DOI: 10.5220/0011104000003355
In Proceedings of the 1st International Joint Conference on Energy and Environmental Engineering (CoEEE 2021), pages 10-17
ISBN: 978-989-758-599-9
Copyright
c
2022 by SCITEPRESS – Science and Technology Publications, Lda. All rights reserved
Figure 1. Annual Primary Energy Consumption in Mtoe for the US and China from 2007 to 2017.
drives economic growth, it will inevitably generate
large amounts of carbon emissions and cause
pollution to the environment.The pollution, in
turn,will dampen down economic growth(Tiba&
Omri , 2017). Technological innovation plays a
significant role in promoting energy efficiency both
in the short and the long term(Xiongfeng, et al, 2019).
As the traditional energy, like coal, is gradually
replaced by clean energy, and energy technology is
improved, the energy consumption structure will be
optimized and the energy efficiency will be
improved. It means that ifeconomic
growthaccompanied by improvements in energy
efficiency, it will lead to a slowdown or reduction in
total energy consumption.Therefore, improving
energy efficiency, changing the structure of energy
consumption and reducing the intensity of energy
consumption are keys to reduce CO2 emissions,
which should be important means used to promote the
development of China's low-carbon economy in the
future (Wu&Zeng, 2013; Xiaojun ,et al, 2019). It
suggests that advanced energy technologies and the
increase of clean energy consumption enhance the
energy efficiency. In this case, economic growth does
not necessarily enlarge energy consumption. Figure 1
illustrates the annual primary energy consumption for
the US and China from 2007 to 2017. Since 2007, the
consumption of China has risen continuously and
there is a great increase during the succeeding years.
Meanwhile, the trend of America’s energy declined
slightly and nearly remained stable in recent years. It
is clear that the growth of the US economy has not
been accompanied by an increase in total energy
demand, which has been driven by improvements in
energy efficiency. By contrast, China's energy
efficiency is still relatively low.
For a long time, there has been a huge trade deficit
between the United States and China. The clean
energy cooperation between the United States and
China enables the United States to take advantage of
its energy and technology, increase its exports of
clean energy products, technologies and equipment to
China, and reduce the trade deficit. In the cooperation
of clean energy, if the United States can appropriately
reduce the export restrictions onhigh-tech products to
China, China will also moderately widen the market
in the investment field, the cooperation between the
two sides will surely promote win-win situation under
the trade balance. For example, China has been faced
with insufficient natural gas supply every winter in
recent years, while the United States is the largest
producer of natural gas. Therefore, increasing the
trade of natural gas between China and the United
States can help solve the problem of natural gas
shortage in China.
In order to analyze the impact of Sino-U.S. clean
energy trade cooperation on China’s clean energy
consumption, this paper will take Sino-U.S. clean
energy trade complementary index (TCI) , China’s
clean energy consumption ratio (CE) , energy
intensity (TEG) , per capita output (PG) and industrial
structure (STRU) as the objects, construct an ARDL
model, analyze the dynamic relationship among
them, and try to put forward the corresponding
recommendations.
2 METHODS AND DATA
2.1 Methods
In this section, we develop an econometric model to
estimate the dynamic relation betweenSino—U.S.
clean energy trade complementarity and China’s
clean energy consumption. We know that the premise
of foreign trade is that the export products have
comparative advantages, such as relatively rich
resources, high-quality products and technology. If a
country’s products have a certain export
competitiveness, there should be a potential
cooperation with other countries. Where there is a
certain trade potential, there is a potential economic
0
1000
2000
3000
4000
2007
2008
2009
2010
2011
2012
2013
2014
2015
2016
2017
U.S
CHINA
The Impact of Sino-US Clean Energy Trade Complementarity on China’s Clean Energy Consumption
11

effect. Trade Completeness Index (TC) in this paper
measures the complementarity of clean energy trade
between China and the United States. The TC
between countries k and j is defined as(WTO,2017):
TC
ij
= 100(1 – sum(|m
ik
– x
ij
| / 2))
where xij is the share of good i in global exports of
country j and mik is the share of good i in all imports
of country k. The index is zero when no goods are
exported by one country or imported by the other and
100 when the export and import shares exactly match.
In order to reflect the influence of the Sino-U.S.
clean energy trade complementarityon China’s clean
energy consumption, this paper adopts the proportion
of clean energy consumption in total energy
consumption (CE) to show the change of China’s
clean energy consumption.
At the same time, considering other factors in
clean energy consumption, this paper introduces the
per capita output (PG), industrial structure (STRU)
and energy intensity (TEG) as control variables. PG
is the real GDP per capita, STRU is the ratio of
industrial output to GDP, and TEG is the ratio of total
energy consumption to GDP. In view of the empirical
strategies provided by theprior literatures (Bas and
Ledezma, 2010; Bustos, 2011), the empirical
framework can take thefollowing form.
C𝐸
𝑡
= (C𝐸
𝑡
,TC
𝑡
,STRU
𝑡
,TEG
𝑡,
PG
t
,𝜀
𝑡
) (1)
As that time series are always non-stationary, it is
effective to specify the econometric model following
the process of the data generation. Results in table (2)
show the dependent variable is not of integration, so
the equation (1) can be represented by a structural
ARDL model. The ARDL model is a standard least
squares model. The ARDL model is to determine
whether there is cointegration relationship between
variables through the boundary test method, and to
estimate the correlation Coefficient between
variables on the basis of this. First proposed by
Charemza&Deadman(Charemza&Deadman, 1992),
then perfected and extended by Pesaran et al.(Pesaran
et al, 2001). Different from the traditional co-
integration test model, the ARDL model does not
require the same order single integer when testing the
long-term relationship among variables.Even under
small samples, the estimations of ARDL model
would be stable enough. The ARDL model takes the
form shown as follows (2):
C𝐸
𝑡
=α
0
+
∑
α
C𝐸
𝑡-i
+
∑
α
TC
𝑡-i
+
∑
α
STRU
𝑡-
i
+
∑
α
TEG
𝑡-i
+
∑
α
PG
𝑡-i
+𝜀
𝑡
(2)
Furthermore, the unit root test also imply that all
the explanatory variables are not of integration higher
than I (1), thus explanatory variables might be co-
integrated with the dependent variable. Then, the
equation (1) can fit a structural ARDL model in error-
correction form as follows.
∆C𝐸
𝑡
=α
0
+α
1
C𝐸
𝑡-1
+α
2
TC
𝑡-1
+α
3
STRU
𝑡-1
+α
4
TEG
𝑡-
1
+α
5
PG
𝑡-1
+
∑
𝛾
∆C𝐸
𝑡-i
+
∑
𝛾
∆TC
𝑡-i
+
∑
𝛾
∆STRU
𝑡-i
+
∑
𝛾
∆TEG
𝑡-i
+
∑
𝛾
∆PG
𝑡-i
+𝜀
𝑡
(3)
where α
is the long-term Correlation Coefficient of
the variable, 𝛾
is the short-term Correlation
Coefficient of the variable, 𝑞
is the maximum lag
order of the model, and 𝑞
is the White noise of the
normal distribution.
2.2 Data
Based on the classification of HS codes, this paper
selects the representative clean energy trade products
of the United States and China from 1992 to 2017 as
the research sample, including Solar Energy, wind
energy, biomass energy, water energy, natural gas,
nuclear power, and selected both import and export
data from the UN comtrade Database. Other data
involved in the study, such as China’s GDP per
capita, industrial structure, and clean energy
consumption, are collectedfrom China Energy
Statistical Yearbook and China National Bureau of
Statistics.
Among them, the per capita real GDP (PG) is
calculated by the China's real GDP (which is adjusted
by price deflator as the base year of 1978) divided by
China's total population at the end of the year; The
value of Energy consumption intensity (TEG) is
calculated by dividing the total energy
consumptionby the real GDP. Table 1 shows the
descriptive data of the values above after natural
logarithm. Figure 2 shows the trend of CE and TC. It
can be seen that CE has been rising steadily since
1992, but clearly there is still room to achieve the goal
of 35% of total consumption by 2030; At the same
time, TC has been in a high position for many years,
which shows that there is a strong complementarity in
clean energy trade between China and America in
theory. However, the dynamic relationship between
TC and CE needs to be further tested by the ARDL
model.
CoEEE 2021 - International Joint Conference on Energy and Environmental Engineering
12
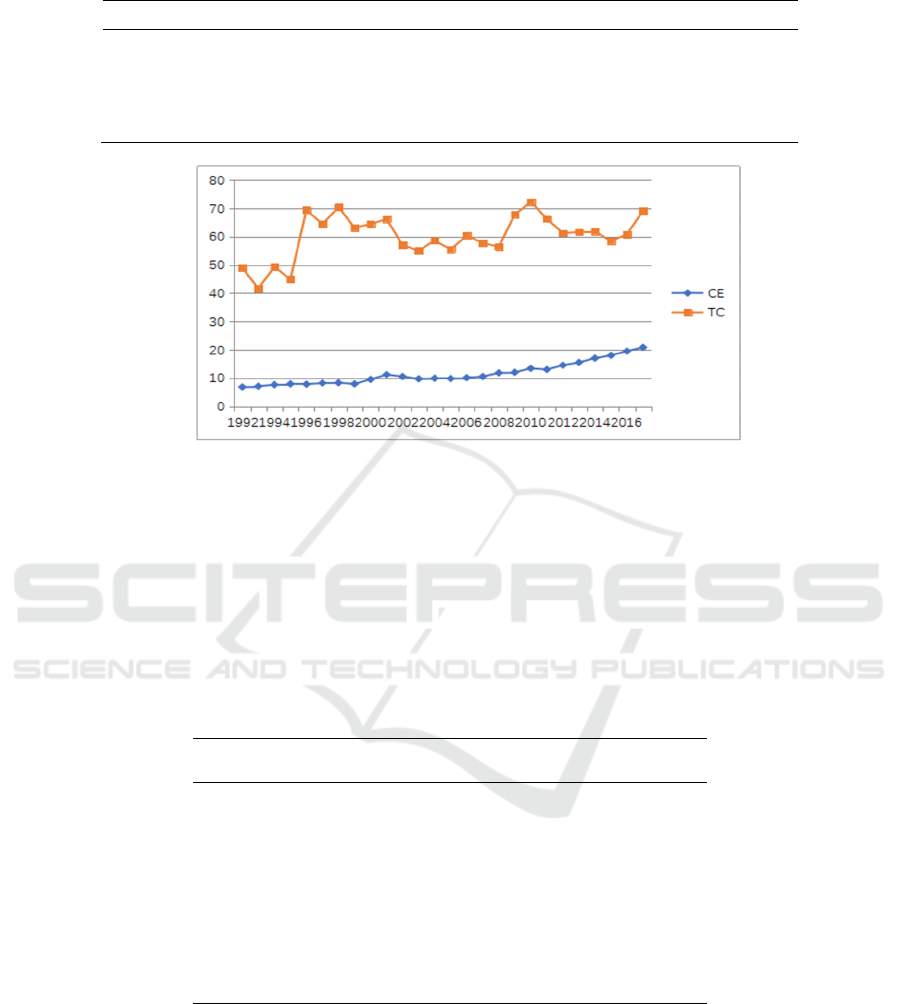
Table 1. Descriptive Statistics.
LNCE LNPG LNSTRU LNTC LNTEG
Mean 2.388465 -0.346857 3.669433 4.087292 0.928757
Maximum 3.034953 0.655577 3.738473 4.278937 1.389892
Minimum 1.916923 -1.455002 3.511376 3.728934 0.520496
Std. Dev. 0.320811 0.658869 0.062195 0.136925 0.223413
Figure 2. General Trends for CE and TC (1992-2017).
3 RESULTS AND DISCUSSION
3.1 Result of Unit Root Test
In this paper, the variables above are tested by the
Augmented dickey-fuller test statistics. The test
results are shown in Table 2. It can be seen from Table
2 that the variable LNPG is stationary and the
variables LNCE, LNSTRU, LNTC and LNTEG are
non-stationary, but they are stationary after the first-
order difference. Therefore, the variables used in this
paper do not exceed I(1), and the cointegration
relationship among variables can be further analyzed
by using ARDL model.
Table 2. Unit Root Tests.
Var ia bl es
Augmented Dickey-
Fuller
LNCE
Level 0.512
First Difference -4.582***
LNPG
Level
-2.164(drift)**
First Difference
LNSTRU
Level 0.502
First Difference -3.812***
LNTC
Level -2.672*
First Difference -7.162***
LNTEG
Level -1.063
First Difference
-1.771(drift)**
3.2 Cointegration Analysis
In this paper, the ARDL model is tested by eviews10,
and the cointegration relationship between variables
is tested by calculating the value of the corresponding
F-statistic. The lag order is determined by AIC and
SC information criterion. The cointegration test
results are shown in Table 3. Referring to the research
of Pesaran,et al.[13], Table 3 illustrates the F-statistic
values of I (0) and I (1) processes at the significance
levels of 1%, 5% and 10% respectively through
ARDL-Bounds Test. The test results show that when
CE is the explained variable, there is a cointegration
relationship among variables at the significance level
of 1%. The optimal model is determined as ARDL
(2,0,2,2,2). The estimations of ARDL model are
The Impact of Sino-US Clean Energy Trade Complementarity on China’s Clean Energy Consumption
13

shown in Table 3, and conditional error correction
regressionand the coefficient of long-term
equilibrium are shown in Table 4.
From Table 4, it can be found that in the long term,
the impact coefficient of LNTC on LNCE is -
0.652176 at the significant level of 10%. It indicates
that Sino--US clean energy trade complementarity
has negative impact on the growth of China’s clean
energy consumption, which is not conducive to the
optimization of China energy consumption structure.
This proves that although China’s clean energy
imports and U.S. clean energy exports have formed a
synchronous growth trend, there is rare relationship
between the growth of China’s import of clean energy
and theUS’clean energy export.In other words, the
growth of China’s clean energy imports is not driven
by the growth of clean energy exports of the United
States. By comparing Figure 3 and Figure 4, it can be
seen that the overall China’s clean energy import
shows an upward trend, and the import of clean
energy has accelerate since 2010; however, after
2011, the trend of clean energy export of China is
opposite to the overall clean energy export of the
United States. The total export of the United States
has steadily increased, while the export to China has
begun to slow down. This shows that the growth of
U.S. clean energy export and that of China’s clean
energy import are not complementary, which is not
reflected in the trade between the two countries. From
table 4, the coefficient of LNTEG is also significantly
negative(-1.835918). It shows that the change of
energy intensity and the change of the proportion of
clean energy consumption are reverse. To some
extent, it is related to China’s strengthening pollution
control, limiting CO2 emissionsand increasing the
use of clean energy. As a result, while the energy
consumption per unit GDP decrease, the proportion
of clean energy increase. The coefficient of LNPG is
significantly positive(1.5614.6), that is, the increase
of per capita GDP is in direct proportion to the growth
of clean energy consumption. Furthermore, it shows
that with China’s economic growth, the use of clean
energy is also increasing, and the energy consumption
structure is constantly optimized.
Table 3. ARDL Estimation (dependent variable LNCE).
Variable Coefficient Std.Error t-Statistic Prob.*
LNCE(-1) 0.146732 0.227824 0.644059 0.534
LNCE(-2) -0.365591 0.228609 -1.599199 0.1409
LNPG 1.903133 0.778937 2.443244 0.0347
LNSTRU 0.22887 0.828776 0.276154 0.7881
LNSTRU(-1) 0.050416 1.030798 0.048909 0.962
LNSTRU(-2) -1.305904 0.740789 -1.762855 0.1084
LNTC -0.251401 0.133551 -1.882435 0.0892
LNTC(-1) -0.291565 0.149303 -1.95284 0.0794
LNTC(-2) -0.251944 0.138546 -1.818491 0.099
LNTEG -2.262761 0.863481 -2.620512 0.0256
LNTEG(-1) 1.714517 1.181713 1.450874 0.1774
LNTEG(-2) -1.689481 0.825431 -2.046787 0.0679
C 14.77916 4.031182 3.666209 0.0043
@TREND -0.167481 0.075814 -2.209114 0.0516
S.E. of regression 0.045135 Akaike info criterion -3.06714
Sum squared resid 0.020371 Schwarz criterion -2.379942
ARDL-BoundsTest Value Signif. I(0) I(1)
F-statistic 5.787697 10% 3.03 4.06
5% 3.47 4.57
1% 4.4 5.72
Table 4. Long-term relationship coefficient of ARDL model.
Variable Coefficient Std. Erro
r
t-Statistic Prob.
LNPG 1.561406 0.652661 2.392370 0.0378
LNSTRU -0.842278 0.577513 -1.458457 0.1754
LNTC -0.652176 0.294462 -2.214809 0.0511
LNTEG -1.835918 0.667798 -2.749212 0.0205
CoEEE 2021 - International Joint Conference on Energy and Environmental Engineering
14
Figure 3. Clean energy imports and exports for US and China (1992-2017).
Figure 4. General Trends for bilateral trades between US and China (1992-2017).
After the long-term relationship coefficient of the
cointegration equation is estimated, error correction
model (ECM) regression based on ARDL model can
be further established toanalyze the dynamic
relationship between the short-term fluctuation of
independent variables and dependent variable . The
results are shown in table 5. The coefficients of
D(LNCE(-1)) and D(LNSTRU(-1)) are significantly
positive, indicating that clean energy consumption and
the industrial structure in the first lag stage have a
positive impact on the increase of the clean energy
consumption in the current period. D(LNTC)
coefficient is significantly negative, while D(LNTC(-
1)) coefficient is significantly positive, which
indicates that although Sino--US clean energy trade
complementary index is unfavorable to the increase of
China’s clean energy consumption in the current
period, it has a positive effect in the first lag stage. The
coefficient of D(LNTEG) is significantly negative,
while the coefficient of D(LNTEG(-1)) is significantly
positive. Generally speaking, the impact of Sino--US
clean energy trade complementary index and energy
intensity on China’s clean energy consumption in the
short term is limited.The coefficient of the error
correction term CointEq(-1) is significantly negative
at the significance level of 1%, which conforms to the
negative feedback mechanism, that is, when the short-
term change is out of the long-term equilibrium level,
it can be adjusted to the long-term equilibrium state
through the error correction model.
Table 5. ECM regression.
Variable Coefficient Std. Erro
r
t-Statistic Prob.
C 14.77916 2.324173 6.358890 0.0001
@TREND -0.167481 0.026788 -6.252120 0.0001
D(LNCE(-1)) 0.365591 0.158065 2.312908 0.0433
D(LNSTRU) 0.228870 0.550510 0.415741 0.6864
D
(
LNSTRU
(
-1
))
1.305904 0.563589 2.317122 0.0430
D
(
LNTEG
)
-2.262761 0.474407 -4.769662 0.0008
D
(
LNTEG
(
-1
))
1.689481 0.514627 3.282920 0.0082
D(LNTC) -0.251401 0.087067 -2.887450 0.0162
D(LNTC(-1)) 0.251944 0.096313 2.615903 0.0258
CointE
q(
-1
)
* -1.218858 0.191492 -6.365051 0.0001
The Impact of Sino-US Clean Energy Trade Complementarity on China’s Clean Energy Consumption
15

4 CONCLUSION AND
SUGGESTION
Based on the annual data from 1992 to 2017, this
paper studies the relationship between Sino—U.S.
clean energy trade complementarity and China’s
clean energy consumption. The results show that
there is a long-term co-integration relationship among
Sino—US clean energy trade complementary index,
China’s clean energy consumption, economic
growth, and energy intensity. In the long run, the
complementarity of clean energy trade between
China and the United States has a negative impact on
the growth of China’s clean energy consumption,
which is not conducive to the optimization of energy
consumption structure. This proves that the
complementary relationship between U.S. clean
energy export growth and China’s import growth is
only reflected in theory, and there is no actual trade
complementarity, which is not reflected in the trade
between the two countries. In the long run, the
increase of per capita GDP and the decrease of energy
intensity will both boost clean energy consumption
and optimize the energy consumption structurein
China. Besides, in the short term, the industrial
structure has a positive impact onclean energy
consumption, and clean energy consumption in the
first lag stage also promotes the consumption of clean
energy in the current period, while other factors do
not significantly contribute to clean energy
consumption in China.
In recent years, China has formulated policies to
save energy and reduce emissions, and to increase the
proportion of clean energy. At present, China should
speed up the adjustment of industrial structure, the
development and application of clean energy
technology, and improve the awareness of energy
conservation of enterprises and residents. From the
perspective of clean energy development goals and
policy guidance of China and the United States, both
China and the United States attach importance to the
clean energyconsumption. The United States has
advancedexperience and technology in clean energy,
and it needs to expand new markets, while China is
just in the early stage of development and has great
market demand. Obviously, bilateral trade
cooperation is beneficial to both countries.
Theoretically, there is a strong complementarity, and
there is a large space for win-win cooperation in
practice. At present, China and the United States
should reach a consensuson the intellectual property
system and related legal system as soon as possible.
In terms of patent application and protection, it is
necessary to jointly establish transparent
management measures and valid examination system
to ensure the standardization of application and
examination, strengthen cooperation and
communication between China and the United States,
so as to crack down on cross-border intellectual
property violations and crimes, and maintain the
bilateral trade order. In the process of specific
implementation, the United States should gradually
reduce the technical restriction, and China should also
accelerate the liberalization of market access. Only in
this way will be benifit to the clean energy trade
cooperation which is caused by different division of
labor in the industrial chain, that is, the high-end
products of the United States enter the Chinese
market, while the medium and low-end products of
China enter the American market. We should
improve the mechanism of capital access and exit,
ensure the legalization and transparency of capital
investment, and protect the legitimate rights and
interests of enterprises. In addition, we should
establish an effective bilateral communication and
coordination mechanism, actively listen to the
opinions involved in trade divergence of enterprises,
and strengthen bilateral communication and
consultation when formulating relevant trade
policies, so that we can solve the problems existing in
Sino--US cooperation in a timely manner, and
promote win-win cooperation between the two sides.
REFERENCES
BP, Statistical Review of Word Energy, 2018
Yemane W R., 2004. Disaggregated industrial energy
consumption and GDP: the case of Shanghai. Energy
economics, 26(2), 9-75.
DolgpolovalI, et al. 2014. Energy consumption and
economic growth: evidence from non-OPEC oil
producing states. Quality & quantity, 48(2), 887-898.
ErginA , Simbarashe H., 2019. Carbon
emissions, energy use, real GDP per capita and trade
matrix in the Indian economy-an ARDL
approach.Energy, 168, 1081-1093.
Meng F Y, ZhouP., 2014. Ineffciency and Congestion
Assessment of Mix Energy Consumption in 16 APEC
Countries by Using DEA Window Analysis. Energy
Procedia,61 ( 36), 2518-2523.
TibaS , Omri A., 2017, Literature survey on the
relationships between energy
,
environment and
economic growth. Renewable and Sustainable Energy
Reviews, 69, 1129-1146.
Chen P Y, et al., 2016. Modeling the global
relationships among economic growth, energy
consumption and CO2 emissions. Renewable &
Sustainable Energy Reviews, 65, 420-431.
CoEEE 2021 - International Joint Conference on Energy and Environmental Engineering
16

Xiongfeng P,et al., 2019. Dynamic relationship among
environmental regulation, technological innovation
and energy efficiency based on large scale provincial
panel data in China. Technological Forecasting and
Social Change, 2019, 144, 428-435.
Wu L Y,Zeng W H., 2013. Research on the Contribution
of Structure Adjustment on SO2 Emissions Reduction-
Case Study of Shijingshan District Beijing. Procedia
Environmental Sciences, 18( 114), 849-855.
Xiaojun M,et al., 2019. Carbon emissions from energy
consumption in China: Its measurement and driving
factors. Science of the Total, 648, 1411-1420.
WTO. (2017, 19 June). WTO. Retrieved from Trade
Indicators:http://wits.worldbank.org/wits/wits/witshelp
/Content/Utilities/e1.trade_indicators.htm.
Charemza W W, Deadman D F., 1992. New Directions in
econometric practice: General to specific modelling,
cointegration and vector autoregression. Cheltenham:
Edward Elgar,.
Pesaran M H,Shin Y, Smith R J., 2001. Bounds testing
approaches to the analysis of level relationships.
Journal of Applied Econometrics, 16(3), 289-326.
The Impact of Sino-US Clean Energy Trade Complementarity on China’s Clean Energy Consumption
17
