
Design of Chicken Feed Mixer Machine Model to Increase Work
Productivity
I Ketut Gde Juli Suarbawa and A. A. Ngurah Bagus Mulawarman
Department of Mechanical Engineering, Bali State Polytechnic, Bukit Jimbaran, Denpasar, Indonesia
Keywords: Mixing Machine, Subjective Complaints, Workload and Work Productivity.
Abstract: Feed is the largest single variable cost in a vertically integrated industrial animal factory. U.S. Department of
Agriculture have estimated that feed costs account for 60-64 percent of the total cost of producing poultry and
eggs, 47 percent for pork, and 17 percent for beef. Feed requirements (in dry weight) for each chicken is 3-
5% of their body weight. In animal feed consumption is influenced by various factors, namely energy levels,
amino acid balance, feed fineness, animal activity, body weight, growth speed and environmental temperature.
The increasing price of animal feed in recent years has caused many farmers to mix their own feed to make
animal feed. At present the process of mixing animal feed is still stirred by hand, causing an increase in
workload and subjective complaints of pain in the back, arms and hands when stirring and the time in the
mixing process. This causes the work productivity on animal feed to be low. Efforts to overcome these
problems, carried out research with the same subject design that is designing a model of animal feed mixing
machines to help speed up the work process of mixing feed to speed up work time and increase work
productivity. The Mixer Machine model is designed according to the needs of chicken farmers and subjective
complaints data are recorded with a fatigue questionnaire, workload is measured based on work pulse and
work time is measured during work and work productivity is measured from the ratio of inputs (work pulse)
to output (Amount of kg of animal feed load stirred) multiplied by work time (hours).The results showed that
the use of the Mixing Machine Model for the stirring process of animal feed can facilitate chicken breeders
in the process of mixing animal feed so that the animal feed mixture is more evenly compared to mixing using
the previous manual method, reducing the subjective complaints of pain in the limbs when stirring decreases
by 20 %, reduce the workload of workers by 48% and increase work productivity by 84%.
1 INTRODUCTION
Feed is that the largest single variable cost during a
vertically integrated industrial animal factory. U.S.
Department of Agriculture have estimated that feed
costs account for 60-64 percent of the whole cost of
manufacturing poultry and eggs, 47 percent for pork,
and 17 percent for beef (
Dennis Olson,2006). The feed
that's given isn't only intended to beat hunger or as a
stomach filler but must be really useful for the
requirements of life, forming new cells, replacing
damaged cells and for producing (Setiawan, Tony and
Arsa Tanius,2005). the necessity for feed (in dry
weight) for every chicken is 3-5% of weight. The
consumption of animal feed is influenced by various
factors, namely energy state, aminoalkanoic acid
balance, feed fineness, livestock activity, weight, rate
of growth and ambient temperature. the extent of
difference in consumption is additionally influenced
by several factors, including: weight, age, feed
digestibility, feed quality and palatability. Palatability
is that the level of preference shown by livestock to
consume a given feed ingredient at a specific time.
Good quality food features a higher consumption
level than inferiority food in order that if the feed
quality is comparatively an equivalent, the
consumption level isn't different (Parakkasi, A,
1998). the method of blending animal feed is
currently done by hand to stir the animal feed
consisting of fifty kg of corn, 50 kg of bran, 50 kg of
concentrate and 50 kg of minerals. The animal feed
that has been placed during a large container is then
stirred by the worker with both hands stirring slowly
until the animal feed is evenly mixed. The stirring
process is administered by standing and bending for a
mean of 63 minutes to stir 200 kg of animal feed. This
work process causes the typical pulse of workers to
extend, sweating plenty, and increased pain within the
Suarbawa, I. and Mulawarman, A.
Design of Chicken Feed Mixer Machine Model to Increase Work Productivity.
DOI: 10.5220/0010967700003260
In Proceedings of the 4th International Conference on Applied Science and Technology on Engineering Science (iCAST-ES 2021), pages 1485-1490
ISBN: 978-989-758-615-6; ISSN: 2975-8246
Copyright
c
2023 by SCITEPRESS – Science and Technology Publications, Lda. Under CC license (CC BY-NC-ND 4.0)
1485

limbs after work, like pain within the back, neck, legs,
upper arms, forearms, and hands. Increased pulse at
work and complaints after work cause work
productivity to be low (Manuaba, A, 2000). Work
posture that aren't physiological are often caused by
the characteristics of task demands, work tools, work
stations, and work Posture that are incompatible with
the skills and limitations of workers (Kroemer and
Grandjean, 2000; Manuaba, A, 2000). Non-
physiological work posture that's administered for
years can cause bone deformities in workers
(Kroemer and Grandjean, 2000).
In an attempt to beat this problem, a machine for
mixing animal feed with a gasoline motor drive was
designed with a drum capacity of 200 kg. The
working mechanism of this animal feed mixer is that
the rotation produced from the gasoline motor shaft
to rotate the stirrer shaft within the stirring drum until
the animal feed is evenly mixed. The rotation of the
driving motor is sustained with the belt rotation and
uses a pulley in order that the rotation of the stirring
shaft is smoother. the utilization of a mixing machine
for animal feed that replaces human labour within the
mixing process will increase work productivity and
reduce workloads and subjective complaints from
workers. By designing the assembly process it's ready
to save the necessity for raw materials and processes,
in order that overall costs are often saved within the
manufacturing industry Rusdiyantoro, 2011).
Ergonomic redesign of kit will reduce muscle
complaints and worker fatigue (Kroemer and
Grandjean, 2000).
2 METHODS
2.1 Research Design
This research is a one-short case study with a pre and
post test design of the design group carried out
observational to the crafters in the process of stirring
the animal feed (Suarbawa, at all, 2016). The chart
can be described as picture1.
R P0 PI
Figure 1: Research Design.
Information:
R = Random sample.
P0= the result of the pretest experimental unit.
PI = the result of the posttest experimental unit.
The research stages in the design of an animal
feed mixer is to examine the current manual stirring
process (stirring with a shovel) compared to the
stirring process with the help of a mixer on working
time, workload, skeletal muscle complaints, fatigue
and work productivity.
2.2 Research Variable
The variables to be measured during this study
include: (1) workload as measured by the heart beat
of rice before and after work; (2) complaints of
fatigue and skeletal muscles before and after work;
(3) work productivity after work by comparing work
pulse (beats per minute) with the amount of products
produced (kg) during working time (minutes). The
measurement of variables number (1) to number (3)
is that the information data of the initial condition and
therefore the final condition which is then compared
to work out the comparison before using the mixer
machine and after using the mixer machine.
2.3 Data Analysis
The design data of the mixer machine are calculated
supported the necessity for a load capacity of 100 Kg,
then an electrical motor, a shaft and a stirrer tank, and
an ergonomic machine holder construction are
planned. Test data before using mixer a machine and
after using mixer a machine include data on working
time/ a length of labour, a workload, subjective
complaints, and work productivity which can then be
analyzed descriptively to get conclusions.
3 RESULT AND DISCUSSION
3.1 Subject Characteristics
The mean age of the themes was 33.21 ± 1.56 years
and therefore the age range was 28 - 34 years. This
age range remains included within the working age
bracket. This age range still includes the workforce
consistent with the Central Statistics Agency (BPS).
The regulation for the workforce that applies in
Indonesia is 15 to 64 years old. The mean age of the
themes of this study, when viewed from muscle
strength, has decreased because the recommended
optimum muscle strength for work is between 20 and
30 years (Corlett, Nigel, 2005). The mean body mass
index (BMI) during this study was 20.21 ± 0.04
kg/m2. The meaning of this BMI value is that workers
are during a normal nutritional status. the traditional
BMI of Indonesians ranges from 18.5 - 25 kg/m2
iCAST-ES 2021 - International Conference on Applied Science and Technology on Engineering Science
1486
(Almatzier, S, 2001). BMI is an indicator of body fat,
if the BMI is below 18.5 kg/m2 it's said to be very
thin (underweight) while above 25.0 kg/m2 is
claimed to be obese (overweight) because of
excessive fat accumulation. The mean work
experience of the themes during this study was 5.23 ±
1.45 years. The meaning of this experience mean is
that the topic has been skilled and ready to adapt to
his job. Work experience in formal sector jobs is
usually considered to be ready to improve one's
employability (Robbins, Stephen P and Timothy A.
Judge. 2008).
Table 1: Subject Characteristics.
Description
n Min Max Mean SD
Age (year) 4
28.00 34.00 33.21 1.56
Height (cm) 4
158.21 168.00 167.22 2.15
Weight (kg) 4
55.40 73.60 62.14 6.98
BMI (kg/m
2
) 4
20.26 21.56 20.21 0.04
Work experience
(year)
4
4.50 6.30 5.23 1.35
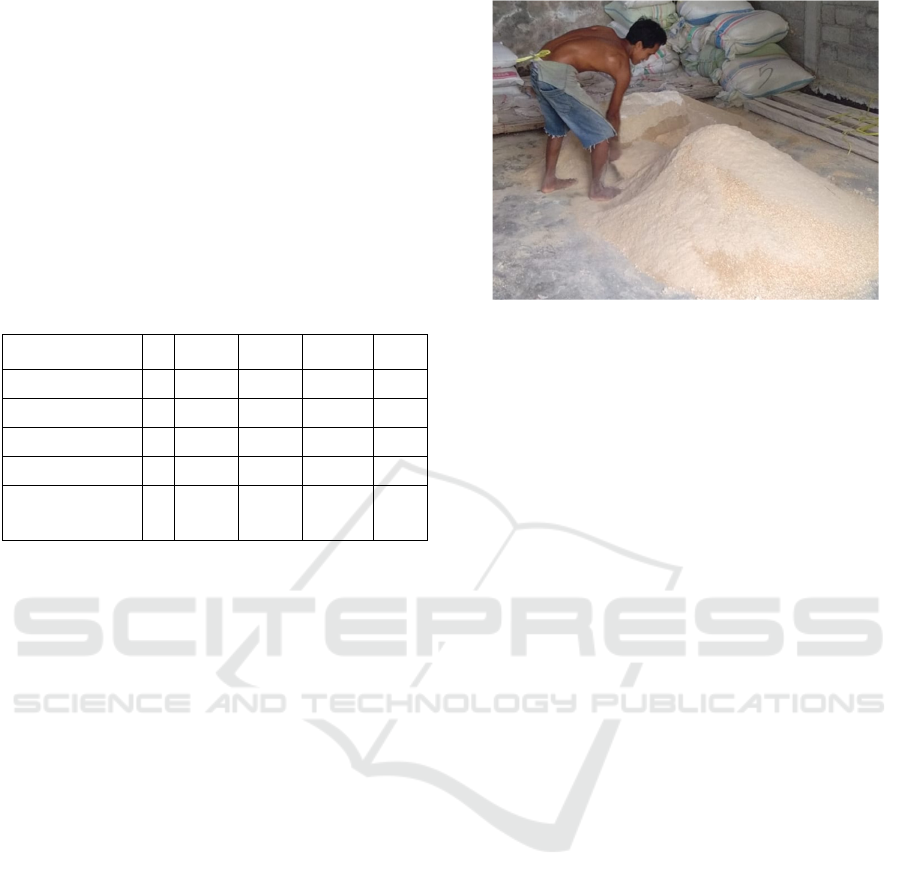
3.2 Manually Stirring Mixture of
Animal Feed
Previously, the process of stirring animal feed was
done manually with a working stance, standing bent
with both hands holding a shovel to stir. The length
of work in the stirring process for 200 kg of animal
feed mixture was carried out for an average of 64
minutes. A work posture that slows down repeatedly
for a long time is a non-physiological work posture.
Work posture that are not physiological can be caused
by the characteristics of task demands, work tools,
work stations, and work Posture that are incompatible
with the abilities and limitations of the workers
(Manuaba, A, 2000). Non-physiological work posture
that is carried out for years can cause bone
deformities in workers (Corlett, Nigel, 2005).
Kimberly (2011) stated that there needs to be a
change in the work system to reduce the level of
worker fatigue. Roles, et al., 2009 made a study on a
work model based on ergonomic principles, and
found that the work model was able to reduce fatigue
by 17.71% (Rolles P., Manuaba, A., Adiputra, N.,
Pangkahila, A, 2012). Torik, et al, 2009 also stated
that designing an ergonomic work system can reduce
the level of worker fatigue. The working posture and
working conditions of the craftsmen are as shown in
Figure 2.
Figure 2: Manual Stirring of Animal Feed Mixture.
3.3 Work Environment
The mean air temperature was 30.01 ± 1.11 (
0
C), the
mean ball temperature was 31.22 ± 1.03 (
0
C), the
mean ratio was 64.23 ± 1.31%, the typical WBGT
index was 29.84 ± 0.49 (0C). the edge value for the
category of heavy work with WBGT of 30.5 (
0
C) is
that the setting of working time per hour is merely
allowed to succeed in 25%, while the edge value for
the category of moderate workload with WBGT
reaches 29 (
0
C) is allowed for setting the working
time of fifty - 75% per hour. The lighting intensity is
332.21 ± 6.23 lux, this intensity value is within the
safe category consistent with the choice of the
Indonesian Minister of Health. No. 405 of 2002
concerning the wants and procedures for
implementing the health of the economic work
environment, where manual work requires a
minimum candlepower of 100 lux. Lighting that's not
enough or below the specified threshold will cause
work fatigue because the shortage of sunshine
intensity within the workplace leads to decreased eye
vision and work fatigue (Bridger, R.S, 2005). The
typical noise intensity reaches 76.43 ± 3.51 dBA.
Workplace noise remains within normal limits when
it's below 85 dBA (Tarwaka, 2010). and therefore the
air velocity is 0.85 ± 0.21 m / s. it's recommended that
indoor air movement isn't quite 0.2 m / s in order that
air movement doesn't have an adverse impact on
workers, whereas for work environments exposed to
heat a better wind speed is required (Corlett, Nigel,
2005).
Design of Chicken Feed Mixer Machine Model to Increase Work Productivity
1487
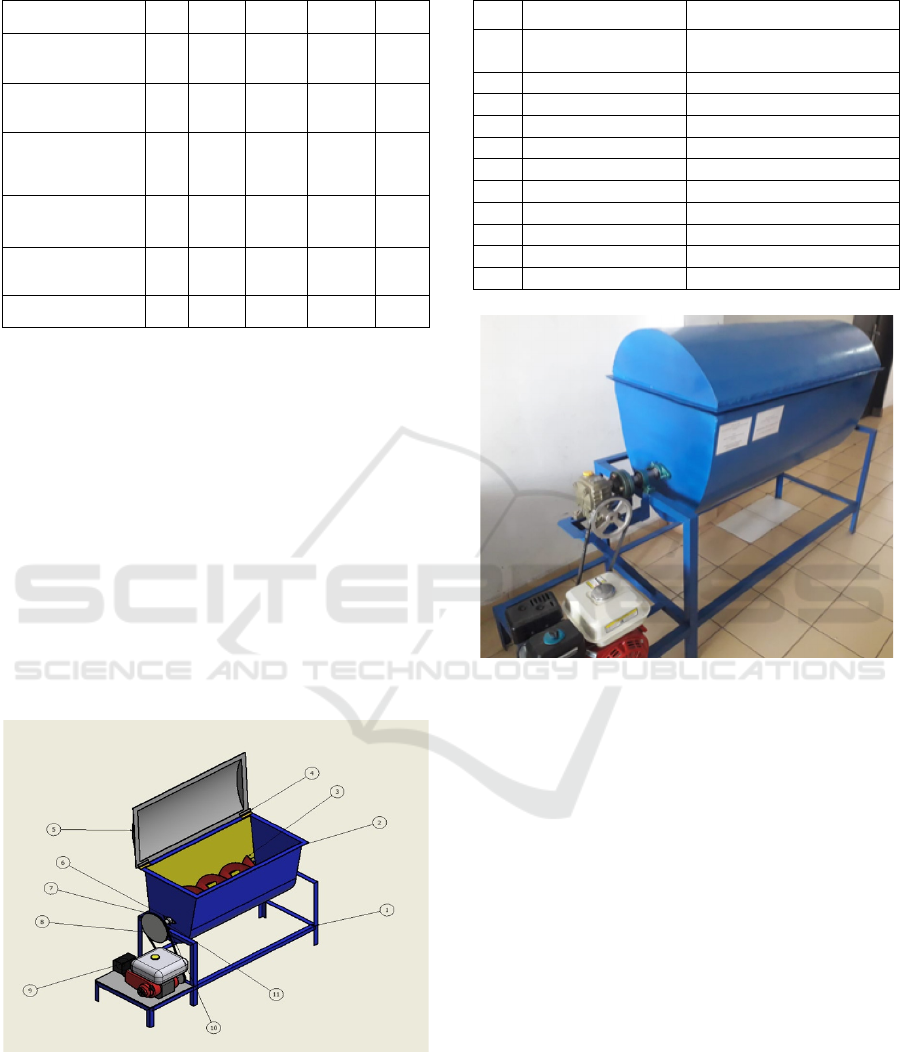
Table 2: Work Environment.
Description n Min Max Mean SD
Air Temparature
(
0
C)
10 30.10 32.90 30.01 1.11
Ball Temparature
(
0
C)
10 28.80 33.00 31.22 1.03
Humidity (
%
) 10 63.90 69.60 64.23 1.31
WBGT (
0
C) 10 27.16 28.01 27.64 2.26
Illumination
Intensity (lux)
10 380.20 3901.40 385.33 4.23
Noise Intensity
(
dBA
)
10 74.31 82.32 76.43 3.51
Air Speed (m/det) 10 0.65 0.70 0.85 0.21
3.4 Design of Animal Feed Mixer
Machine
This animal feed mixer machine is meant with a
gasoline motor drive. the facility on the motor shaft
which is provided with a belt attached to the pulley
with a ratio of 1: 3. The rotation of the stirrer is meant
at 3600 rpm. The capacity of the mixer drum is 100
Kg. This machine is operated by one person with a
standing work posture. The way the machine works is
extremely easy, namely: 1). Put the animal feed
ingredients which will surrender into the mixer drum,
2). activate the mixer for about quarter-hour until the
animal feed is evenly mixed, 3). Remove the animal
feed mixture from the drum.
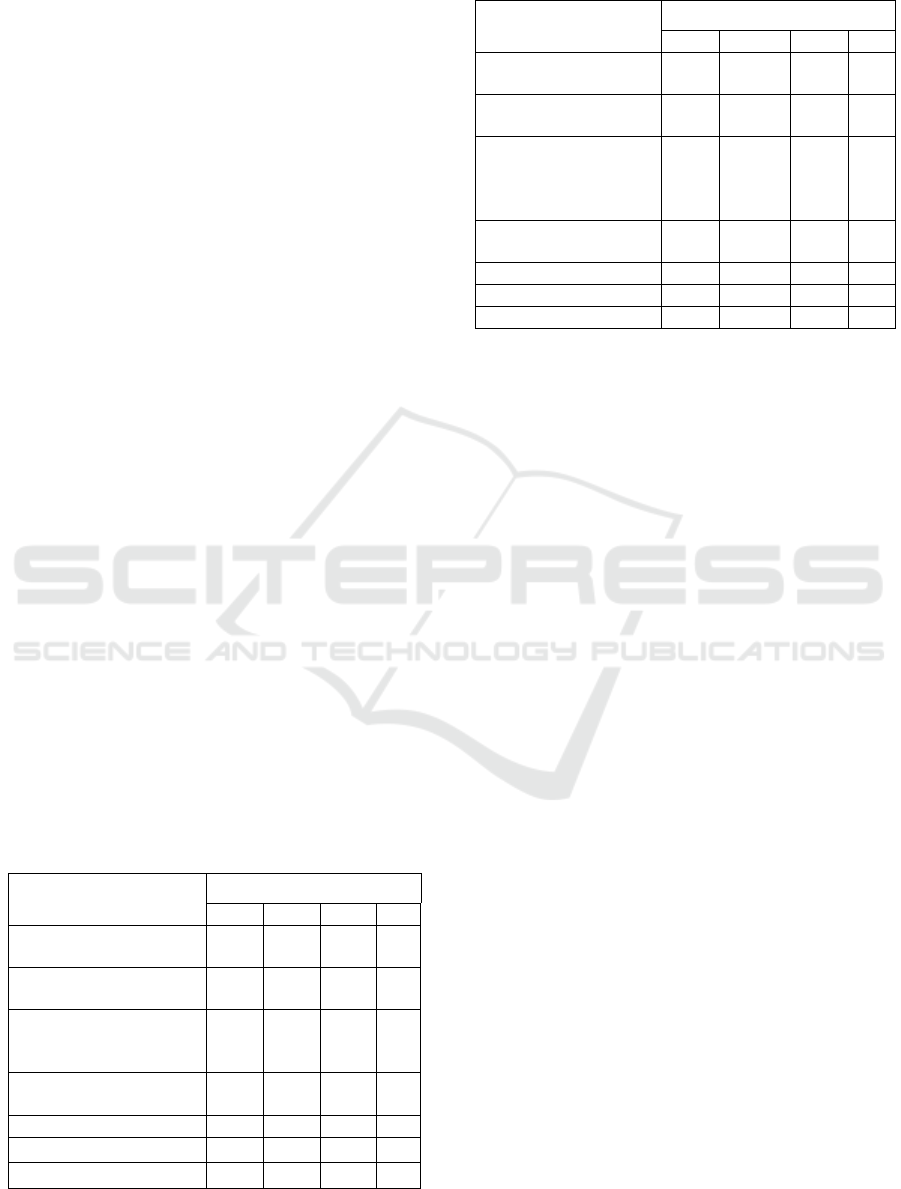
Figure 3. Design Engine Component.
Table 3: Engine Component.
No. Engine Component Caption
1 Machine frame Iron Elbow 40 mm x 40
mm x 4 mm
2 Mixing dru
m
Steel plate 1,2 mm
3 mixe
r
Iron steel
4 Hin
g
e Iron steel 12 x 3 m
m
5 Cove
r
Steel
p
late 1,2 mm
6 Bearing Holde
r
Iron steel Ø40 mm
7 Pully Ratio pully 1: 3
8 V-
b
elt 1,5 mm x 80 mm
9 Gasoline moto
r
5,5 hP
10 Pollow bloc
k
50 m
m
11 Shaft Iron steel Ø40 mm
Figure 4: The Result of Design Mixer Machine.
3.5 Workload, Musculoskeletal
Complaints, Fatigue, and
Productivity
Measurement of workload is done by measuring the
work rate per minute using the 10 pulse method.
Work pulse is measured every 60 minutes. The 10
pulse method is a method by palpation of the radial
artery of the left hand, which is calculated as the
length of time it takes from the first pulse to the
eleventh pulse, the result is in seconds (Adiputra,
2002). Workload was measured in the period I
research (P0), namely the manual stirring process
research and in the second period study (PI), the
stirring process using a mixer machine.
Musculoskeletal complaints are disorders of the
skeletal muscle system caused by work tools and
conditions of the subject, organization, environment.
The discrepancy of these factors affects the work
posture when doing work that is recorded using the
Nordic Body Map. The complaint value of the
iCAST-ES 2021 - International Conference on Applied Science and Technology on Engineering Science
1488
musculoskeletal disorder system is determined based
on the difference between the mean value of
complaints before work and the mean value of
complaints after work. The assessment criteria were
not sick, slightly sick, sick and very sick.
Musculoskeletal disorder were measured in the
Period I (P0) study, namely the manual stirring
process research and in the II Period (PI) study, the
stirring process using a mixer.
Fatigue in general is a condition that is reflected
in the symptoms of psychological changes in the form
of slackness in motor and respiratory activity, a
feeling of pain, heaviness in the eyeballs, weakening
of motivation, decreased activity which will be
influenced by physical and mental activity (Bridger,
R.S, 2005). Fatigue was recorded with 30 items of
fatigue level which was modified with four Likert
scales and consisted of three categories, namely
fatigue for activity (1−10), fatigue for motivation
(11−20) and physical fatigue (21−30). Fatigue was
measured in the period I (P0) study, namely the
manual stirring process and in the second period (PI)
study, the stirring process using a stirrer machine.
Work productivity is the ratio between the amount
of output (mixture of animal feed in units of Kg) and
the input (average working pulse in units of dpm) in
a period of time (length of work in minutes),
calculated based on the following formula (Manuaba,
2000). Productivity was measured in the period I
research (P0), namely the manual stirring process
research and in the second period study (PI), the
stirring process using a mixer. The results of
measuring workload, musculoskeletal complaints,
fatigue and productivity in the first period (P0) study,
namely the manual stirring process research and the
second period research (PI), namely the stirring
process using a mixer, are presented in Table 4
.
Table 4: Measurement Results of Workload, Musculo-
skeletal Disorder, Fatigue and Productivity (Period I).
Description
Period I (P0)
Min Max Mean SD
Resting Pulse
(denyut/menit)
64,21 70,2 72,56 2,05
Work Pulse
(
den
y
ut/menit
)
18,39 23,42 20,21 2,45
Different Score
Musculoskeletal Disorder
Before and After Work
10 15 12,1 3
Different Score fatigue
Before and After Wor
k
5 10 7,2 2,1
Productions
(
K
g)
100
Times of mixer (menit) 41 48 43 1,2
Work Productivity 0,178 0,265 0,230 0,03
Table 5: Measurement Results of Workload, Musculo-
skeletal Disorder, Fatigue and Productivity (Period II).
Description
Period II (PI)
Min Max Mean SD
Resting Pulse
(
den
y
ut/menit
)
62,02 70,02 71,4 2,61
Work Pulse
(denyut/menit)
8,4 12,8 10,61 2,04
Different Score
Musculoskeletal
Disorder Before and
After Work
2,31 10,25 6,31 0,72
Different Score fatigue
Before and After Wor
k
2,33 7 4,7 0,8
Productions
(
K
g)
100
Times of mixer (menit) 12 16 13,5 0,4
Work Productivity 0,977 1,984 1,396 0,01
Table 4 and 5 shows that the use of an animal feed
mixer machine in the process of stirring the animal
feed mixture reduces the workload of workers by
48%. The average work pulse rate of workers in the
P0 study (stirring manually) was 92.58 bpm including
the light workload category (pulse 75-100), while the
average work pulse rate of workers in the P1 study
(stirring with a stirring machine) was obtained a mean
work pulse amounted to 74.25 bpm, including the
category of very light workload (pulse 65-75)
(Corlett, Nigel, 2005).
The results of measuring the musculoskeletal
complaint score showed that the use of an animal feed
mixer in the process of stirring the animal feed
mixture reduced musculoskeletal complaints by 48%.
The mean score of musculoskeletal complaints in the
P0 (Manual stirring) study was 12.1, while the mean
score of workers' musculoskeletal complaints in the
P1 study (stirring with a stirring machine) was 6.31.
The results of the measurement of the fatigue score
showed that the use of a mixer for animal feed in the
stirring process of the animal feed mixture reduced
fatigue by 35%. The mean score of fatigue in the P0
study (stirring manually) was 7.2, while the mean
score of worker fatigue in the P1 study (stirring with
a stirring machine) was 4.7. The result of productivity
measurement shows that the use of a mixer for animal
feed in the process of stirring the animal feed mixture
increases productivity by 84%. The average
productivity in the P0 study (stirring manually) was
0.230, while the average productivity of workers in
the P1 study (stirring with a stirring machine) was
1.396. A decrease in musculoskeletal complaint
scores, fatigue and an increase in work productivity
indicate that ergonomic interventions in work
systems can reduce musculoskeletal complaints
scores due to physiological work posture (Adiputra,
Design of Chicken Feed Mixer Machine Model to Increase Work Productivity
1489

N, 2002), reduce fatigue scores (Suma’mur PK,
2013), and increase productivity (Bridger, R.S, 2005).
4 CONCLUSIONS
Based on the results of the discussion of the design of
a mixture of animal feed mixer, it was found that the
use of a mixer in the process of mixing animal feed
can reduce workload by 48%, reduce the score of
musculoskeletal complaints by 48%, reduce fatigue
scores by 35% and increase work productivity by
84%. Therefore, in the process of mixing animal feed,
an ergonomic animal feed mixer can be used.
ACKNOWLEDGEMENTS
The authors would like to thank the department of
research and community service center Bali State
Polytechnic and the Ministry of Education and
Culture of Indonesia for the financing of this research.
REFERENCES
Dennis Olson, R. 2006. IATP Trade and Global
Governance Program This fact sheet draws heavily on
the Global Development and Environment Institute’s
Working Paper 05-07, “Identifying the Real Winners
from U.S. Agricultural Policies,” by Timothy A. Wise,
which was adapted for IATP by GDAE Research
Assistant Elanor Starmer. The original paper is
available at: http://www.ase.tufts.edu/gdae/policy_
research/RealWinners.htm.
Setiawan, Tony and Arsa Tanius. 2005. Raising Ettawa
Cross-breed Dairy Goats. Publisher: Swadaya. Jakarta.
Parakkasi, A. 1998. Science of Nutrition and Forage of
Ruminants. UI Press. Jakarta. (references).
Manuaba, A. 2000. Stress and Strain. Ergonomics. Vol. II.
Denpasar. Work Physiology Ergonomics Study
Program. Udayana University.
Kroemer and Grandjean, E. 2000. Fitting The Task To The
Human. A Texbook Of Occupational Ergonomics 5th.
Edition Philadelphie: Taylor and Francis (references)
Rusdiyantoro. 2011. Product Green Design Development to
Support Green Lifecycle Engineering Manufactured in
Adibuana Metalworks, Prosiding International
Conference on Creative Industry (ICCI), ISBN 978-
979-781-8
Suarbawa, JKGJ., Nyoman Adiputra, J Alek Pangkahila,
and IDP Sutjana. 2016. “Work Posture Improvement
Using Ergonomic Approach Decreases Subjective
Disorders of Perapen Workers on the Process of
Nguwad Gamelan in Bali.” International Research
Journal of Engineering, IT & Scientific Research
(IRJEIS) 2605(9): 4290–2016. http://ijcu.us/online/
journal/index.php/irjeis%5Cnhttp://dx.doi.org/10.2174
4/irjeis.v2i9.164%5Cnhttp://orcid.org/0000-0003-0948
-7858.
Corlett, Nigel. 2005. Static Muscle Loading and the
Evaluation of Posture. Evaluation of Human Work, 3rd
Edition. London: Taylor & Francis. (references).
Almatzier, S. 2001. Basic Principles of Nutrition. Jakarta:
PT. Gramedia Pustaka Utama. (references).
Robbins, Stephen P dan Timothy A. Judge. 2008.
Organizational behavior. Edition 12. Book 1. Jakarta:
Salemba Empat. (references).
Kimberly, F.K. 2011. The Effect of Shift Work on Fatigue
of Palm Oil Mill Workers at PT. X Labuhan Batu.
Journal of Industrial Engineering, Vol. 12, No. 2,
August 2011. p110–117.
Rolles P., Manuaba, A., Adiputra, N., Pangkahila, A. 2012.
Ergonomics (Apelerg) Based Field Practicum Activity
Model Improves Body Physiological Response,
Reduces Fatigue, and Increases Performance,
Compared to the Old Model (Apel), in FMIPA Unima
Students.
Torik, H., Kholil, M., Ari, S. 2009. Ergonomic Work
System Design to Reduce Fatigue Levels. Jurnal
Industrial and Systems Engineering Assessment
Journal (INASEA), Vol. 10 No.1, April 2009. p 45-58.
Indonesian Journal of Biomedical Sciences. Vol. 3, No.
1. January 2009.
Bridger, R.S. 2005. Introduction to Ergonomics. Singapore:
McGraw-Hill. (references).
Tarwaka. 2010. Industrial Ergonomics: the basics of
ergonomics knowledge and workplace applications.
First Edition. Harapan Press Solo. ISBN
9789791814416. (references).
Adiputra, N. 2002. The Pulse and Its Use In Ergonomics.
Indonesian Journal of Ergonomics. Vol. 3 No. 1, June:
22-26.
Suma’mur PK. 2013.Company Hygiene and Occupational
Health (HIPERKES). Jakarta: Agung Seto. (references).
iCAST-ES 2021 - International Conference on Applied Science and Technology on Engineering Science
1490
