
The Prediction of Solar Energy in Supporting Green Energy at
Bongkasa Pertiwi, Sangeh, Mengwi, Pelaga and Pangsan
Anak Agung Ngurah Gde Sapteka
1a
, Anak Agung Ngurah Made Narottama
1b
,
I Gusti Agung Gede Wiadnyana
2c
, Kadek Amerta Yasa
1d
,
I Wayan Suasnawa
1
and I Gusti Putu Arka
1
1
Electrical Engineering Department, Politeknik Negeri Bali, Badung, Bali, Indonesia
2
Mathematics Education Department, Universitas PGRI Mahadewa Indonesia, Denpasar, Bali, Indonesia
Keywords: Renewable Energy, Green Energy, Solar Cell, Solar Panel, Bongkasa Pertiwi, Sangeh, Mengwi, Pelaga,
Pangsan, Badung, Bali.
Abstract: Bongkasa Pertiwi, Sangeh, Mengwi, Pelaga and Pangsan are five villages in Badung Regency, Bali Province.
Badung Regency Tourism Office plans these five villages as tourism villages that are supported by green
energy. For this purpose, we conduct a study on solar energy potential for solar cells using data from the
Prediction of Worldwide Energy Resources (POWER) at the average latitude and longitude position of the
five village offices location, i.e., -8.44209 lat and 115.21381 lon. In addition, we collected the data of all-sky
insolation incidents on a horizontal surface (kW-hr/square meter/day) for this position from 2010 to 2019. As
stated in Table 2-4, the result shows that the sixth-order polynomial equation and its coefficients can predict
the maximum, mean, and minimum solar energy value in these areas. Furthermore, the adjusted r-square of
the insolation fitness equation has a value of more than 90 percent.
1 INTRODUCTION
Several researchers have studied solar energy in Bali
Province in several locations, such as Nusa Penida,
Kayubihi, Denpasar, and Badung Regency, focused
on sunlight intensity and required battery capacity
comparison of simulation results with the actual
production of electrical energy and also solar energy
modeling.
Research on solar energy in Nusa Penida, a small
island located at 8°44'4" south latitude and 115°32'2"
east longitude in Klungkung Regency, shows that the
area gets light intensity average of 5.34 kWh/m
2
/day
with a wind speed average of 4.4 m/s (Manik, Wijaya,
& Juliandhy, 2014). In Kutampi Village, Nusa
Penida, a solar power plant supplies a base transceiver
station (BTS) load of 174.66 kWh that requires 45
panels with a total battery capacity of 3,800 Ah and a
whole battery of 16 units (Indrawan & Hartati, 2013).
Solar-powered street lighting in Nusa Penida had also
a
https://orcid.org/0000-0001-7919-1847
b
https://orcid.org/0000-0002-8239-0422
c
https://orcid.org/0000-0003-4613-7363
d
https://orcid.org/0000-0002-8019-4647
been analyzed and summarized about the causes of
battery damage were due to disproportionate to the
load capacity requirements and because the battery
has been old (Wiguna, Ariastina, & Kumara, 2012).
The study found at Pemecutan Kaja Village,
Denpasar City, Bali Province that the average daily
energy produced by the solar panel is 23.59 kWh,
yielding energy at IDR 7,766/kWh. Experiment to
clean filters of the plant reduced daily energy
consumption from 8.84 kWh to 3.05 kWh or 65%
(Arimbawa, Kumara, & Hartati, 2016).
In Kayubihi, Bangli Regency, a 1 MWp solar
power plant has been built and connected to the
electricity network. The comparative study of
simulation results with the actual production of
electrical energy shows a difference of 32.3%
(Setiawan, Kumara, & Sukerayasa, 2014).
In Denpasar City, the capital of Bali Province,
research on solar energy at elementary school no. 5,
located in Pedungan area, with a roof angle of 30.96
o
produces an energy potential of 3214.6 kWh, lower
Sapteka, A., Narottama, A., Wiadnyana, I., Yasa, K., Suasnawa, I. and Arka, I.
The Prediction of Solar Energy in Supporting Green Energy at Bongkasa Pertiwi, Sangeh, Mengwi, Pelaga and Pangsan.
DOI: 10.5220/0010967400003260
In Proceedings of the 4th International Conference on Applied Science and Technology on Engineering Science (iCAST-ES 2021), pages 1467-1473
ISBN: 978-989-758-615-6; ISSN: 2975-8246
Copyright
c
2023 by SCITEPRESS – Science and Technology Publications, Lda. Under CC license (CC BY-NC-ND 4.0)
1467
than the optimal angle of 15
o
that make the immense
potential value of 3407 kWh (Kristiawan, Kumara, &
Giriantari, 2019). Statistically, our research modeled
the electrical characteristics of the 150-Watt peak
solar panel in Denpasar using Boltzmann sigmoid
function with a good fit (Sapteka et al., 2018).
Furthermore, the lighting systems with 150-Watt
peak solar panel in Denpasar shows that the
maximum received wattage is 0.76 kW/day in
October based on NASA data (Narottama, Amerta
Yasa, Suwardana, Sapteka, & Priambodo, 2018).
In Badung Regency, the hybrid solar power plant
for the parking area of Cipta Karya Building, Office
of Highways and Irrigation of Badung Regency has
been planned, which works automatically controlled
by the inverter system that produces 148.274 kW,
which is equal to 30% of the electrical energy
consumption in the building of 2.310 MWh (Duka,
Setiawan, & Weking, 2018).
This paper discusses the solar energy projections
in Bongkasa Pertiwi, Sangeh, Mengwi, Pelaga, and
Pangsan areas that other researchers have never
studied. The research aims to support this area to
become tourism villages supported by green energy.
2 METHODOLOGY
2.1 Determining the Average Location
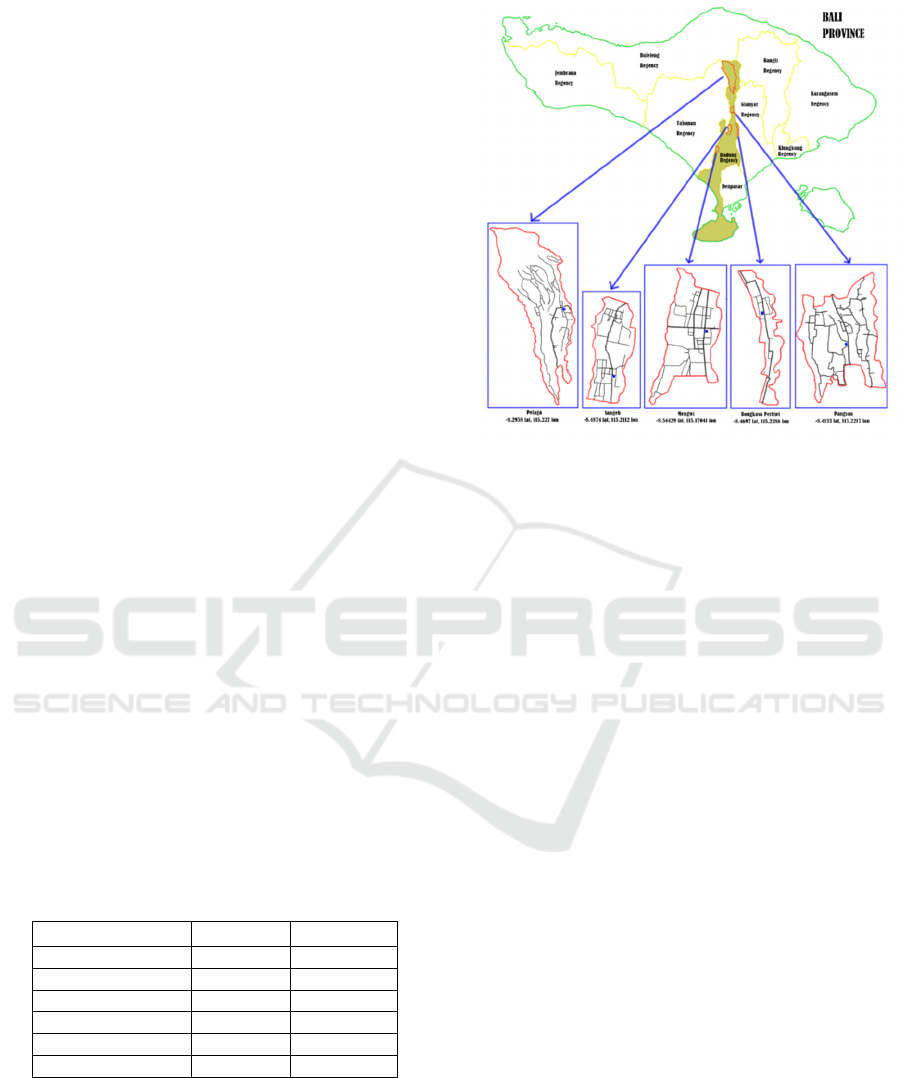
As shown in Table 1, we should select the average
location by determining the midpoint of latitude and
longitude of Bongkasa Pertiwi, Sangeh, Mengwi,
Pelaga, and Pangsan Government Office. The small
blue square in Figure 1 shows the locations of
government offices in these villages. It is fixed that
the average site is -8.44209 lat and 115.21381 lon.
Table 1: Location of village government office.
Area Latitude Longitude
Bongkasa Pertiwi -8.4697 115.2386
Sangeh -8.4874 115.2112
Men
g
wi -8.54429 115.17041
Pela
g
a -8.2958 115.227
Pan
g
san -8.4133 115.2217
Average -8.44209 115.21381
Figure 1: Location of government office.
2.2 Collecting the Data
We collect the all-sky insolation incident on
horizontal surface data from the Prediction Of
Worldwide Energy Resources (POWER) at the
average latitude and longitude of the five village
offices, i.e., -8.44209 lat and 115.21381 lon. This data
is collected from 2010 to 2019 in kW-hr/square
meter/day.
2.3 Analysing the Data
First, we analyze the data by finding the monthly
maximum, mean and minimum values of all-sky
insolation incidents on a POWER's horizontal surface
data. The next step is calculating the fittest order of
polynomial equations and their coefficients. The
equations are used as prediction of insolation value at
Bongkasa Pertiwi, Sangeh, Mengwi, Pelaga and
Pangsan. Last step is determining the statistic of
maximum, mean and minimum equations to ensure
the prediction.
3 RESULT AND DISCUSSION
3.1 Result
Based on the determination of the average location of
the five village offices at Table I, the all-sky
insolation incidents on a horizontal surface data was
collected from the Prediction Of Worldwide Energy
iCAST-ES 2021 - International Conference on Applied Science and Technology on Engineering Science
1468
Resources (POWER) at the average latitude and
longitude position of the five village offices location,
i.e., -8.44209 lat and 115.21381 lon. This data is
collected from 2010 to 2019 in kW-hr/square
meter/day as shown in Figure 2 to Figure 11.
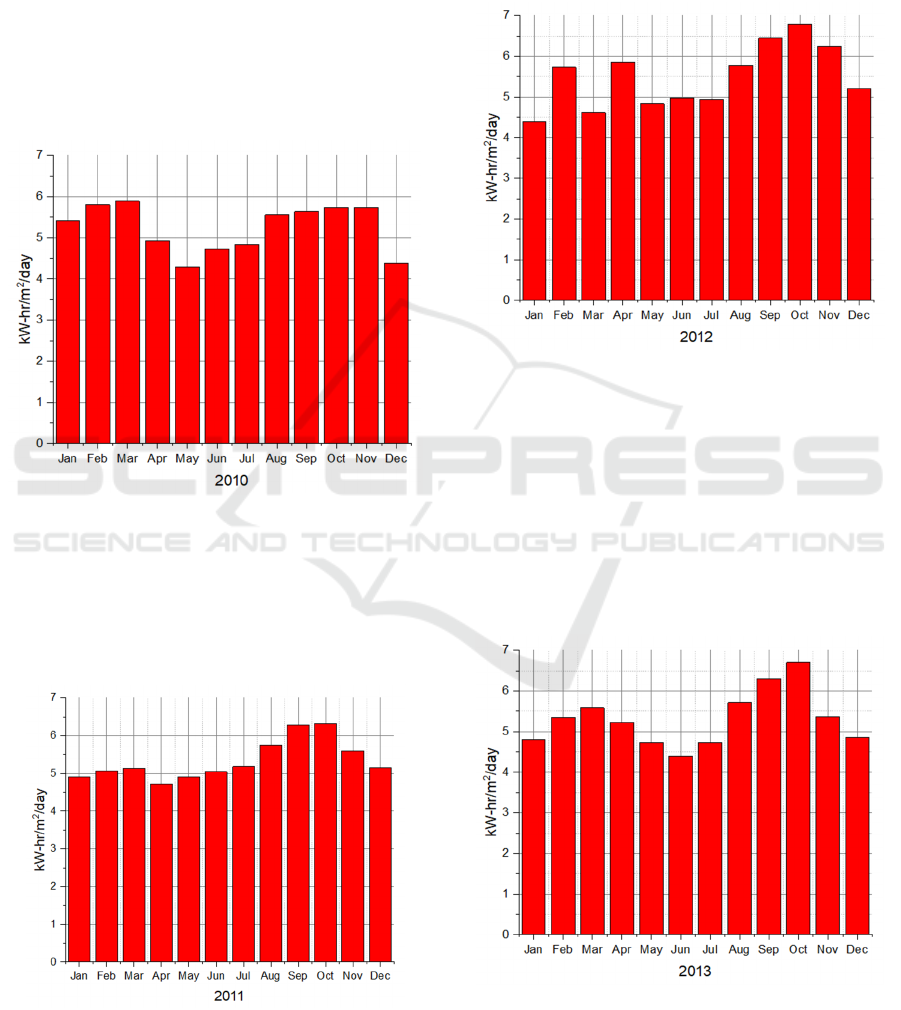
In 2010, insolation incidents on a horizontal
surface had a maximum value of 5.9 kW-hr/m
2
/day in
March. It increases from January to March, then
decreases until May with a minimum value of
4.3 kW-hr/m
2
/day. The value climbs from May to
November but drops in December, as shown in
Fig. 2.
Figure 2: Insolation incident on a horizontal surface in
2010.
In 2011, an insolation incident on a horizontal
surface had a maximum value of 6.3 kW-hr/m
2
/day in
October and a minimum value of 4.8 kW-hr/m
2
/day
in April, as shown in Figure 3.
Figure 3: Insolation incident on a horizontal surface in
2011.
In 2012, insolation incidents on a horizontal
surface had a maximum value of 6.5 kW-hr/m
2
/day in
October and a minimum of 4.4 kW-hr/m
2
/day in
January. However, it fluctuates from January to July.
For example, the value climbs from July to October
but decreases until December, as shown in Figure 4.
Figure 4: Insolation incident on a horizontal surface in
2012.
In October 2013, an insolation incident on a
horizontal surface had a maximum value of
6.7 kW-hr/m
2
/day. It increases from January to March
and then decreases to June, reaching a minimum
value of 4.3 kW-hr/m
2
/day. Because of the sun's
movement from northern to southern solstice, the
insolation increases from June to October but then
goes down until December, as shown in Figure 5.
Figure 5: Insolation incident on a horizontal surface in
2013.
The Prediction of Solar Energy in Supporting Green Energy at Bongkasa Pertiwi, Sangeh, Mengwi, Pelaga and Pangsan
1469
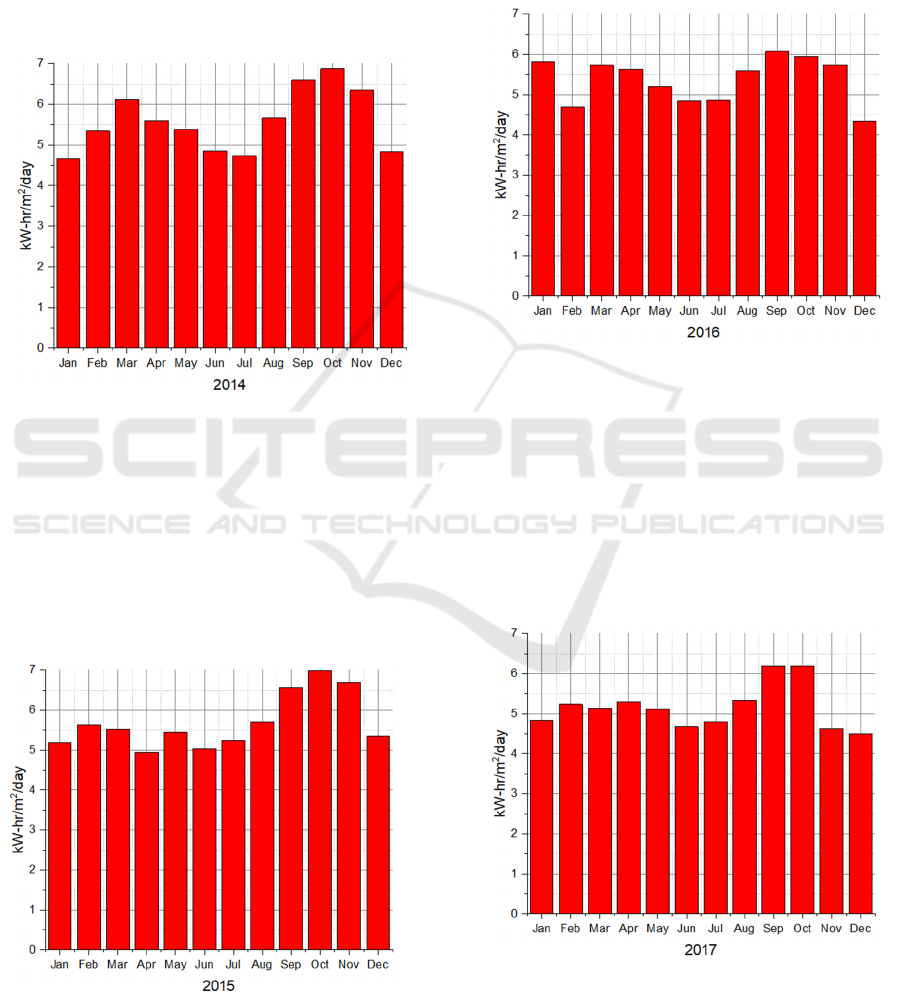
The insolation incident on a horizontal surface in
2014 experienced a similar pattern with 2013. It has a
maximum value of 6.9 kW-hr/m
2
/day in October. It
increases from January to March and then decreases
to July, where it reaches a minimum value of
4.8 kW-hr/m
2
/day. The sun's shifting from northern
to southern solstice causes the insolation to increase
from July to October but then declines until
December, as shown in Figure 6.
Figure 6: Insolation incident on a horizontal surface in
2014.
In 2015, the insolation incidents on a horizontal
surface increased from January to February, and then
it decreased until April with a minimum value of
4.9 kW-hr/m
2
/day. It fluctuates in May and June
before increases to reach its maximum value of
6.8 kW-hr/m
2
/day in October then goes down until
December, as shown in Figure 7.
Figure 7: Insolation incident on a horizontal surface in
2015.
In 2016, the insolation incident on a horizontal
surface fluctuated from January to March. It reached
a minimum value of 4.6 kW-hr/m
2
/day in February.
From March to June, it decreases linearly and then
climbs from June to September. Finally, it reaches a
maximum value of 6.8 kW-hr/m
2
/day in September,
then drops until December, as shown in Figure 8.
Figure 8: Insolation incident on a horizontal surface in
2016.
In 2017, insolation incidents on a horizontal
surface fluctuated from January to May and then
declined until June. From June to September, it
increases and reaches a maximum value of
6.3 kW-hr/m
2
/day in September and October, then
decreases sharply in November and December to
reach a minimum value of 4.7 kW-hr/m
2
/day, as
shown in Figure 9.
Figure 9: Insolation incident on a horizontal surface in
2017.
iCAST-ES 2021 - International Conference on Applied Science and Technology on Engineering Science
1470
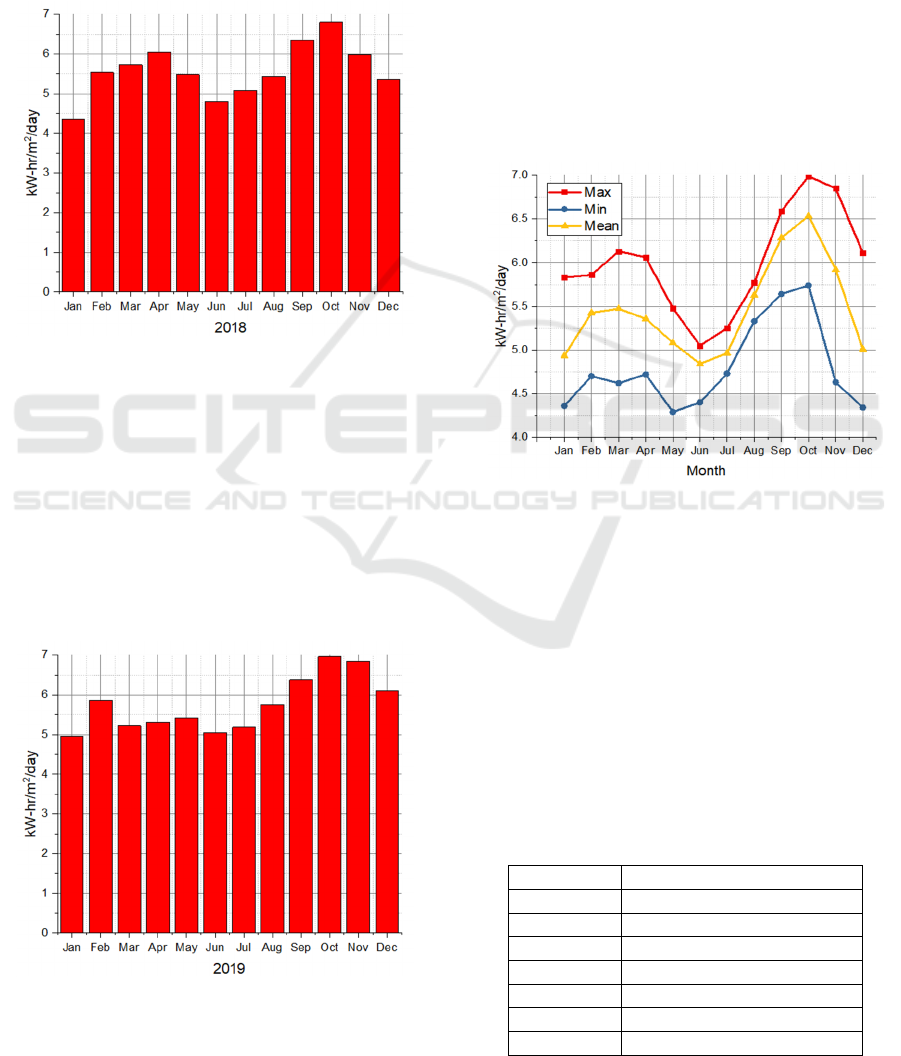
In January 2018, an insolation incident on a
horizontal surface experienced a minimum value of
4.4 kW-hr/m
2
/day. From January to April, it increases
and then goes down until June. Furthermore, it
gradually increases from June to October where it
reaches maximum value of 6.8 kW-hr/m
2
/day. As
shown in Figure 10, the insolation decreases linearly
from October to December.
Figure 10: Insolation incident on a horizontal surface in
2018.
In 2019, insolation value had higher condition
than in 2018, i.e., it reached a minimum value of
5.0 kW-hr/m
2
/day in January and maximum value of
7.0 kW-hr/m
2
/day in October. It fluctuates from
January to March and increases linearly to May.
Insolation value fluctuation occurs again from May to
June before it climbs to reach maximum value in
October, as shown in Figure 11. The insolation value
decreases from October to December.
Figure 11: Insolation incident on a horizontal surface in
2019.
3.2 Discussion
After collecting the data, we analyze it by finding the
monthly maximum, mean and minimum value of all-
sky insolation incidents on a horizontal surface from
2010 to 2019. As shown in Figure 12, The red line
plots the maximum value, where it reaches the lowest
value of 5.0 kW-hr/m
2
/day in June and the highest
value of 7.0 kW-hr/m
2
/day in October. The blue line
plots the minimum value, where it reaches the lowest
value of 4.5 kW-hr/m
2
/day in May and the highest
value of 5.7 kW-hr/m
2
/day in October. Meanwhile,
the yellow line plots the mean value, where it reaches
the lowest value of 4.8 kW-hr/m
2
/day in June and the
highest value of 6.5 kW-hr/m
2
/day in October.
Figure 12: Max, min and mean value of insolation from
2010 to 2019.
Using the maximum, mean and minimum insolation
data as shown in Figure 12, we deliver a
6
th
order polynomial as stated in Eq. (1) to predict the
solar energy in Bongkasa Pertiwi, Sangeh, Mengwi,
Pelaga and Pangsan area.
𝑦𝑔𝐵
𝑥
𝐵
𝑥
𝐵
𝑥
𝐵
𝑥
𝐵
𝑥
𝐵
𝑥
(1)
Here, y is the value of insulation (kW-hr/m
2
/day),
and x is the number of months. Table 2-4 shows the
coefficient values in Eq. (1) for the polynomial fit of
maximum, mean, and minimum equations.
Table 2: Coefficient of maximum insolation fitness.
Coefficient
Value
𝑔
8.47318 ± 0.46565
B
-5.37383 ± 0.77834
B
3.67557 ± 0.44693
B
-1.08975 ± 0.11881
B
0.15343 ± 0.01595
B
-0.01011 ± 0.00105
B
2.51225×10
-4
± 2.68386×10
-5
The Prediction of Solar Energy in Supporting Green Energy at Bongkasa Pertiwi, Sangeh, Mengwi, Pelaga and Pangsan
1471
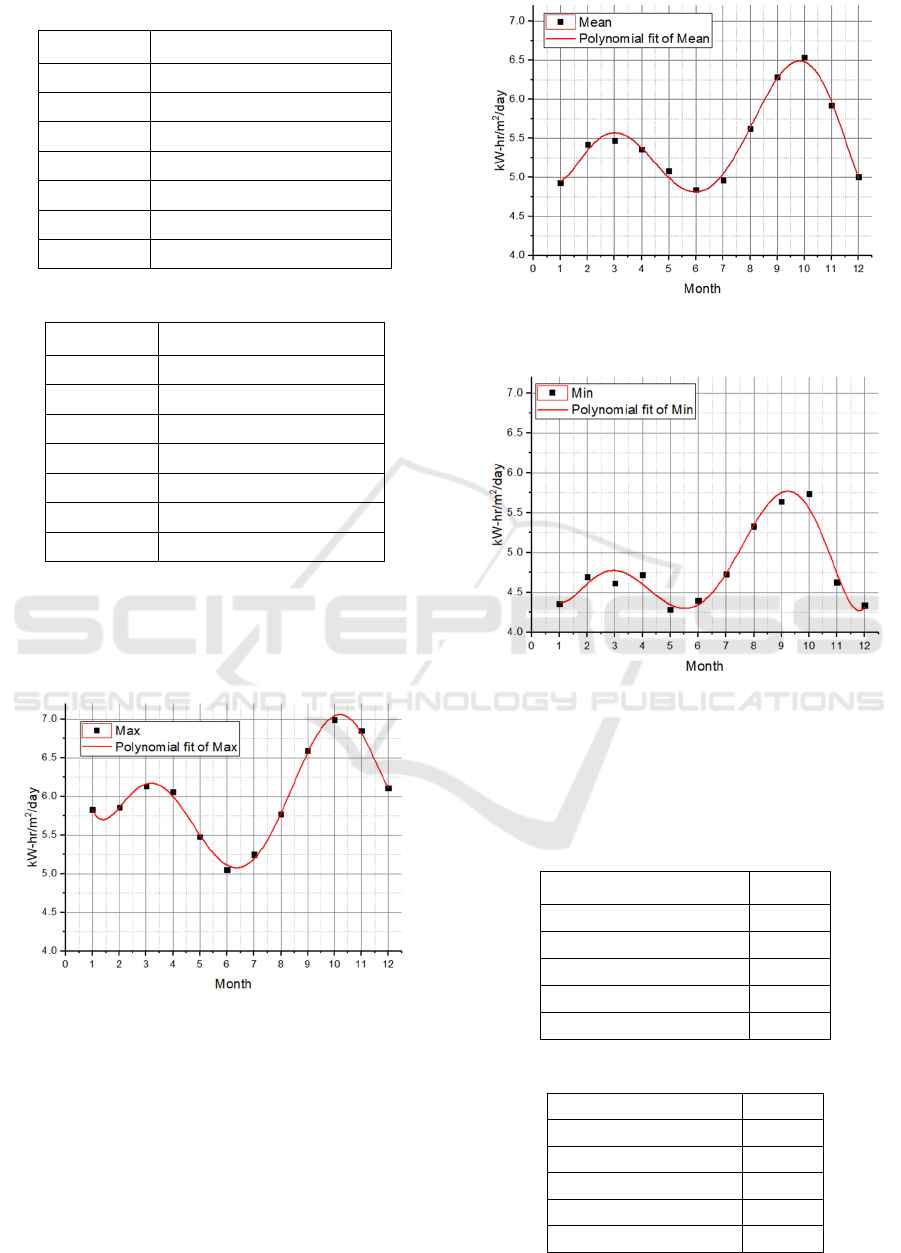
Table 3: Coefficient of mean insolation fitness.
Coefficient
Value
𝑔 5.70982 ± 0.69508
B
-2.16013 ± 1.16184
B
1.98487 ± 0.66713
B
-0.6786 ± 0.17735
B
0.10404 ± 0.02381
B
-0.00725 ± 0.00157
B
1.87173×10
-4
± 4.00622×10
-5
Table 4: Coefficient of minimum insolation fitness.
Coefficient
Value
𝑔 5.5175 ± 1.19266
B
-2.74317 ± 1.99356
B
2.25739 ± 1.14471
B
-0.76468 ± 0.3043
B
0.12081 ± 0.04085
B
-0.00882 ± 0.00269
B
2.404×10
-4
± 6.87413×10
-5
Figure 13-15 draws the graphs of this fitness using
Eq. (1) and the coefficient for the polynomial fit of
max, mean, and min values as stated in
Table 2 – 4.
Figure 13: Maximum value of insolation and its 6
th
order
polynomial fit.
Figure 14: Mean value of insolation and its 6
th
order
polynomial fit.
Figure 15: Minimum value of insolation and its 6
th
order
polynomial fit.
All the polynomial fit equations show the statistic
value of adjusted r-square more than 90%, as stated
in Table 5-7.
Table 5: Statistic of maximum insolation fitness.
Parameter
Value
number of points 12
degree of freedom 5
residual sum of squares 0.01731
r-square 0.99558
adj. r-square 0.99028
Table 6: Statistic of mean insolation fitness.
Parameter
Value
number of points
12
degree of freedom
5
residual sum of squares
0.03858
r-square
0.98844
adj. r-square
0.97457
iCAST-ES 2021 - International Conference on Applied Science and Technology on Engineering Science
1472

Table 7: Statistic of minimum insolation fitness.
Parameter
Value
number of points
12
degree of freedom
5
residual sum of squares
0.11357
r-square
0.95910
adj. r-square
0.91003
Therefore, Eq. (1) is fit to predict the maximum,
mean, and minimum insolation value in supporting
energy independence at Bongkasa Pertiwi, Sangeh,
Mengwi, Pelaga, and Pangsan area.
4 CONCLUSIONS
The 6
th
order polynomial equation, as stated in Eq.
(1), can predict the solar energy in supporting green
energy at Bongkasa Pertiwi, Sangeh, Mengwi,
Pelaga, and Pangsan area. We can use it to forecast
the maximum, mean and minimum insolation values
in these areas by using coefficients as stated in Table
2 – 4. The statistic shows that all of the adjusted r-
square of insolation fitness values are more than 90%.
ACKNOWLEDGEMENTS
We would like to express our grateful to Badung
Regency Tourism Office, P3M Politeknik Negeri
Bali, and Government Village of Bongkasa Pertiwi,
Sangeh, Mengwi, Pelaga and Pangsan.
REFERENCES
Arimbawa, P. A. R., Kumara, I. N. S., & Hartati, R. S.
(2016). Studi Pemanfaatan Catu Daya Hibrida PLTS
3,7 KWp dan PLN Pada Instalasi Pengolahan Air
Limbah Desa Pemecutan Kaja Denpasar Bali.
Teknologi Elektro, 15(2), 33–38.
Duka, T. E. A., Setiawan, I. N., & Weking, A. I. (2018).
Perencanaan Pembangkit Listrik Tenaga Surya Hybrid
Pada Area Parkir Gedung Dinas Cipta Karya, Dinas
Bina Marga dan Pengairan Kabupaten Badung.
SPEKTRUM, 5(2), 67–73.
Indrawan, I. P. E., & Hartati, R. S. (2013). Perancangan
Photovoltaic Stand Alone Sebagai Catu Daya Pada
Base Transceiver Station Telekomunikasi Di Pulau
Nusa Penida. Teknologi Elektro, 12(1), 32–41.
Kristiawan, H., Kumara, I. N. S., & Giriantari, I. A. D.
(2019). Potensi Pembangkit Listrik Tenaga Surya Atap
Gedung Sekolah di Kota Denpasar. SPEKTRUM, 6(4),
66–70.
Manik, C. T., Wijaya, F. D., & Juliandhy, T. (2014).
Evaluation of Hybrid System Solar Wind Diesel in
Nusa Penida. International Journal of Scientific &
Engineering Research, 5(11), 1140–1145.
Narottama, A. A. N. M., Amerta Yasa, K., Suwardana, I.
W., Sapteka, A. A. N. G., & Priambodo, P. S. (2018).
Analysis of AC and DC lighting systems with 150-watt
peak solar panel in Denpasar based on NASA data. In
Journal of Physics: Conference Series (Vol. 953).
https://doi.org/10.1088/1742-6596/953/1/012100
Sapteka, A. A. N. G., Narottama, A. A. N. M., Winarta, A.,
Amerta Yasa, K., Priambodo, P. S., & Putra, N. (2018).
Modelling of electric characteristics of 150-watt peak
solar panel using boltzmann sigmoid function under
various temperature and irradiance. In Journal of
Physics: Conf. Series (Vol. 953).
Setiawan, I. K. A., Kumara, I. N. S., & Sukerayasa, I. W.
(2014). Analisis Unjuk Kerja Pembangkit Listrik
Tenaga Surya (PLTS) Satu MWp Terinterkoneksi
Jaringan di Kayubihi, Bangli. Teknologi Elektro, 13(1),
27–33.
Wiguna, I. W. Y. M., Ariastina, W. G., & Kumara, I. N. S.
(2012). Kajian Pemanfaatan Stand Alone Photovoltaic
System Untuk Penerangan Jalan Umum Di Pulau Nusa
Penida. Teknologi Elektro, 11(2).
The Prediction of Solar Energy in Supporting Green Energy at Bongkasa Pertiwi, Sangeh, Mengwi, Pelaga and Pangsan
1473
