
The Effect of Electronic Disposition of Spherical Electrode on Plasma
Behavior in Argon Gas Media
David Suban Koten, Monalisa Malelak and Mikael Namas
Institute Department of Electrical Engineering, State Polytechnic of Kupang, Kupang, Indonesia
Keywords
:
Plasma Reactor, Spherical Electrode, Argon Gas, Paschen Curve, Breakdown Voltage.
Abstract:
Plasma is an ionized gas, a substance whose electrons leave the orbit of each atom and can be created by
heating a gas or exposing a sufficiently strong electromagnetic field using a laser or microwave generator.
This study examines how to design a high voltage plasma generator so that it can supply direct current (DC)
voltage to generate plasma in the reactor chamber containing low-pressure argon gas. In this study, the
breakdown voltage analysis was also carried out until a plot of the relationship between the breakdown
voltage, gas pressure, and distance between the electrodes was found. It is expected that the plotting can be
adjusted to the curve according to Paschen's Law and get results that are close to the ideal curve. This research
also aims to see the condition, behavior, and discharge of plasma that results from the release of spherical
electrode electrodes, so that the results of this research can carry out in an industry, agriculture, and electro-
medical.
1
INTRODUCTION
Plasma is an ionized gas, a substance whose
electrons come out of the orbit of each atom and can
be created by heating the gas or by exposing a
sufficiently strong electromagnetic field using a laser
or microwave generator. The increase or decrease in
the number of electrons present in the plasma results
in particles with positive or negative charges called
ions. This can usually be followed by the untying of
the molecule. The appearance of a large electric
charge makes the plasma conductive, so it reacts very
strongly to electromagnetic fields. Like gas, plasma
does not have a fixed shape or volume unless it is in
a closed space. However, unlike gases under the
influence of magnetic fields, plasma can form a
variety of structures such as filaments, beams, and
bilayers. Industrial and commercial applications of
plasma technology include plasma cutting (a
technology that emerged from plasma welding in the
1960s) and is a highly productive way to cut sheet
metal and plate.
Plasma welding, in this application, uses high
frequency and voltage. Plasma welding is much better
than tungsten welding because the welding process
can be faster. Besides, there is also the plasma
nitriding method, which is a function of plasma in the
hardening process of metal materials. In this
application, a metal material is placed between the
cathode and the anode electrode in a vacuum tube,
releasing an electric current. Applications in other
commercial and industrial fields, namely the
manufacture of ozone, sterilization of pool water,
removing various unwanted volatile organic matter,
such as chemical pesticides, solvents or chemicals
from the atmosphere, and as ionizing air which is
good for health. Of the various applications of plasma
technology, both in the industrial and commercial
world that have begun to be developed, there are still
obstacles in the application of plasma technology in
the form of devices that are not yet available on the
market or freely sold. One of the contributing factors
is how to design a plasma reactor system that has low
pressure (vacuum) and produces a high plasma
discharge.
Based on the description above, this research will
design a plasma generator that will generate from an
HVT (high voltage transformer) that produce a
voltage to activate the plasma on the electrodes
installed in an airtight tube. HVT functions to convert
an AC voltage of 220 V to an AC voltage of 2000 V,
while the high voltage diode and capacitor function
as a rectifier and filter circuit and then converts the
2000 V AC voltage to 2000 V DC voltage. From the
plasma generator made, an optimization of the plasma
Koten, D., Malelak, M. and Namas, M.
The Effect of Electronic Disposition of Spherical Electrode on Plasma Behavior in Argon Gas Media.
DOI: 10.5220/0010967300003260
In Proceedings of the 4th International Conference on Applied Science and Technology on Engineering Science (iCAST-ES 2021), pages 1459-1466
ISBN: 978-989-758-615-6; ISSN: 2975-8246
Copyright
c
2023 by SCITEPRESS – Science and Technology Publications, Lda. Under CC license (CC BY-NC-ND 4.0)
1459

formation process parameters will be carried out,
namely knowing the Paschen curve of the gas used
(argon gas). This research will use a ball electrode
type. The choice of the shape of the spherical
electrode is based on its function, which is to obtain a
very high electric field so that it can produce a large
enough plasma debit.
The research to be carried out is also in line with
the 2017-2045 National Research Master Plan
(RIRN) to support the direction of national
development in the field of science and technology,
as well as respond to the government's commitment
to supporting the development of advanced materials.
2
BASIC THEORY
2.1 Plasma
Plasma is one of the four basics forms of matter,
apart
from solid, liquid, and gas. Plasma has different
properties compared to the other. Plasma can be
created by heating a gas or exposing it to a strong
electromagnetic field, which can generate using a
laser or a microwave generator. Basically, plasma is
an ionized gas, which has atoms whose electrons
bounce out of their orbits. This results in the plasma
being able to conduct electricity because the atoms
themselves no longer have a positive balance between
the positive and negative charges, but the atoms are
positively charged due to the presence of protons in
the core, while the electron cloud that exists between
the atoms is negatively charged. The concept of
plasma was first described by Langmuir and Tonks in
1928. They defined plasma as a gas that is ionized in
an electric discharge, so plasma can also be defined
as a neutral-neutral mixture of electrons, radicals,
positive and negative ions. The mixing of positively
charged ions with negatively charged electrons has
very different properties from that of the general gas
and matter in this phase is called the plasma phase.
2.2 Collecting the Data
Plasma is an ionized gas. Ionization events are
always present in the process of plasma. Ionization is
the process of releasing electrons from an atom or
molecule from its bonds. The energy required to
remove one or more electrons from its orbit in an
atom is called the ionization energy E. The amount of
ionization energy is expressed in electron-Volts (eV).
In a stable state, ionization can occur if the energy of
the colliding electron is greater than or equal to the
ionization energy of the atom or molecule collided,
which is shown in Equation (1).
2≥ 𝑒𝑉
𝑖
(1)
Where:
m
e
= rest mass of the electron (9.109534 · 10- 31 kg)
νe
= velocity of the electrons (m s-1)
e
= elementary charge (1.6021892 · 10-19 C)
Vi = ionization potential of an atom or molecule
(eV)
In the process of collisions between electrons and gas
particles not only ionization occurs but also causes
other events. The opposite of the ionization process is
the recombination process. Recombination occurs by
binding of electrons by ions and binding between
atoms to become molecules so that they become
neutral species or negative ions accompanied by
photon emission (Nur, 2011).
2.3 Analyzing the Data
The discharge of electricity in gases has been a
long-standing subject in physics. The release in the
gas that is best known in nature is lightning. Gas,
which is an insulator by nature, will turn into a
conductor under certain conditions. The following is
the mechanism of lightning. Clouds that are close to
the earth's surface have a very high potential
difference from the earth's surface. Due to cosmic
radiation, there is the ionization of the gas between
the cloud and the ground.
This ionized gas increases in volume and allows
chain ionization to occur because the electrons
produced in the ionization are accelerated towards the
cloud and on their way collide with gas atoms and
molecules.
This event continues and in a certain condition,
there
is an electronic avalanche. The air (gas)
between the
clouds and the earth becomes a conduit in
the form of
a canal and emits white light. Electrical
discharge
(electrical discharge) has occurred in nature,
followed
by the sound of lightning which is the
sound of
meeting between air separated in a short
time by a
channel of discharge between cloud and
earth and
between cloud and cloud.
In the laboratory, the discharge of electricity can
be
carried out in a gas-filled tube. If two electrodes in
the form of parallel plates are placed in a tube
containing
gas with a certain pressure and the two
electrodes are connected to a high voltage DC source,
there will be a discharge of electricity between the
electrodes. Gas discharge tube can be seen in Fig.1.
iCAST-ES 2021 - International Conference on Applied Science and Technology on Engineering Science
1460

Figure 1: Gas Discharge Tube.
The electrons from the cathode will move towards
the
anode and during their travel, the electrons will hit
the
molecules or gas atoms between the two
electrodes. For chain ionization to occur, the first step
that must be passed is the ionization to produce free
electrons. Scientists believe the first electrons came
from the ionization of gases by cosmic ray radiation.
This first electron is accelerated by the potential
difference between the two plate electrodes in the
discharge tube. In their journey, these electrons will
collide and ionize other atoms or gas molecules in
succession. The process of consecutive collisions will
produce electronic avalanches and can lead to chain
ionization.
2.4 Electric Field Generating
Electrodes
The electric field distribution, which is greatly
influenced by the shape and dimensions of the
electrodes, the distance between the electrodes, and
the number of electrodes arranged. In selecting the
electrode material, it is emphasized on its function,
which is to produce a very high electric field
(Davidson, 2000). Fig.
2 shows the types of electrodes
used to generate high
electric fields.
Figure 2: Types of High-Field Generating Electrodes.
2.5 Electric Field Intensity
The electric field is an area around an electric
charge which is affected by an electric force. Michael
Faraday describes the electric field as a vector of
electric field lines coming out of the positive charge
into the negative one. The greater the intensity of the
electric field is depicted by the denser of field lines.
Each point in the electric field is a quantity that
expresses the level of strength of it, which is called
the electric field intensity. The intensity of the electric
field is the electric force that rests on one unit of
electric charge (Iskander, 1992). Electric field
intensity is the
electric force defined by Coulomb as
the force that
arises between two points of charges
separated by a
certain distance. This law states that
if there are two
points of charge there will be a force
between them
which is proportional to the
multiplication of the
values of the two charges and
is inversely
proportional to the square of the
distance between
them (Koefl and Saengl,2000), Fig.
3 shows vector electric field line
generated by
electric charges.
Figure 3: Vector electric field line generated by electric
charges (a) one point of positive charge, (b) one point of
negative charge, (c) two like charges, (d) two dissimilar
charges.
3
RESEARCH METHODS
This research begins with the design of tools,
manufacture, and testing of tools to determine the
shape of the plasma which is produced from the
release of spherical electrons in the argon gas medium
and to determine the plasma debit generated in the
plasma reactor. The results of this research will be
used as initial data for further research on the
application of plasma technology in industry,
agriculture and medicine. The stages of this research
can be seen in Fig. 4, which explains the procedures
for implementing the research to be carried out.
The Effect of Electronic Disposition of Spherical Electrode on Plasma Behavior in Argon Gas Media
1461
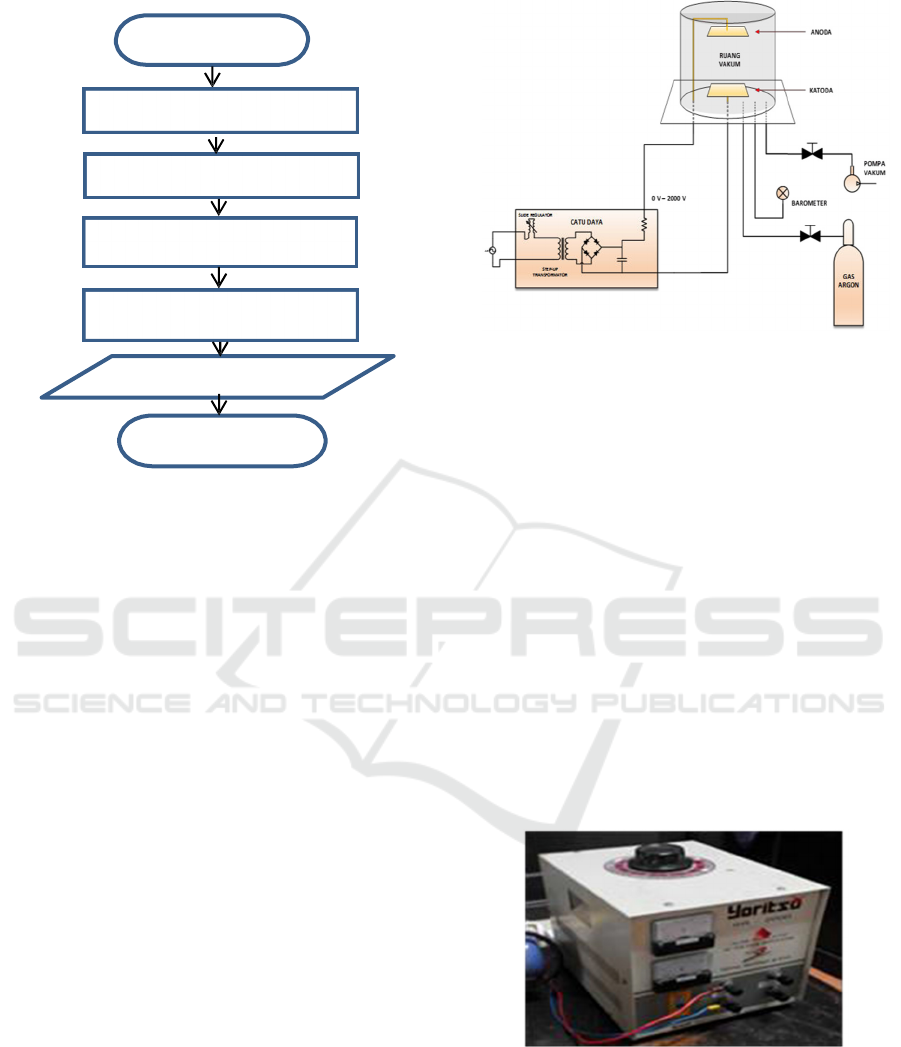
Figure 4: Research Flow Chart.
The stages in this research are:
1.
Plasma generator system design.
2.
Manufacture of a plasma generator system
consisting of manufacturing a power supply,
manufacturing a vacuum tube, installing a
vacuum
pump, installing pipes and valves,
installing an argon
gas reservoir, installing
measuring instruments, and
manufacturing an
electrode system.
3.
Plasma behavioral testing.
4.
Data retrieval.
5.
Analysis of the performance of the resulting
plasma.
The airtight tube as a reactor filled with low-pressure
argon gas is evacuated through the pipe using a
vacuum pump and controlled by a valve, the cylinder
containing high-pressure argon gas also acts as a
supplier of argon gas and is controlled by a valve. The
gas pressure in the reactor can be observed with a
pressure gauge. The anode and cathode are made of
spherical copper. The electrodes are arranged in
parallel. The power supply used for the anode and
cathode is a source with a maximum voltage of 2000
VDC. The Plasma generator system design is shown
in Fig. 5.
Figure 5: Plasma Generator System Design.
4
RESEARCH RESULTS AND
DISCUSSION
By the research method, the first step taken in
designing the tools, then making the tools, and testing
them, then analyzing the results and making
conclusions.
4.1 Research Tools
The tools used to conduct research are divided
into
several parts. The first is the power supply, which
functions to supply direct high voltage (DC). This
section converts the input in the form of an alternating
voltage of 220 V into a direct voltage that can be
adjusted from 0 V to 2000 V. Fig. 6 shows parts of
the power supply.
Figure 6: Parts of the Power Supply.
The second part is the plasma reactor, which must
be
a transparent, airtight space so that visual
observations can be made. In the room, there is a ball
electrode that can be changed the distance between
the anode and cathode.
Star
t
Design Tools
tool making
Plasma behavior testing
Performance analysis
Conclusion
En
d
iCAST-ES 2021 - International Conference on Applied Science and Technology on Engineering Science
1462
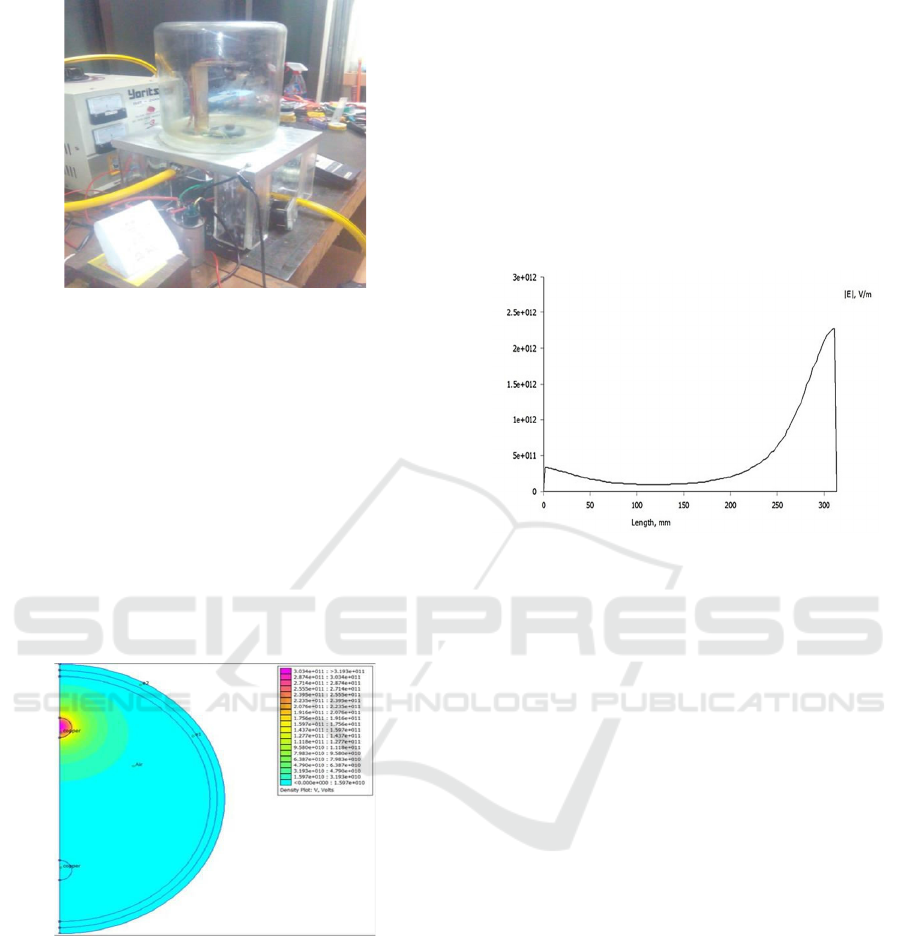
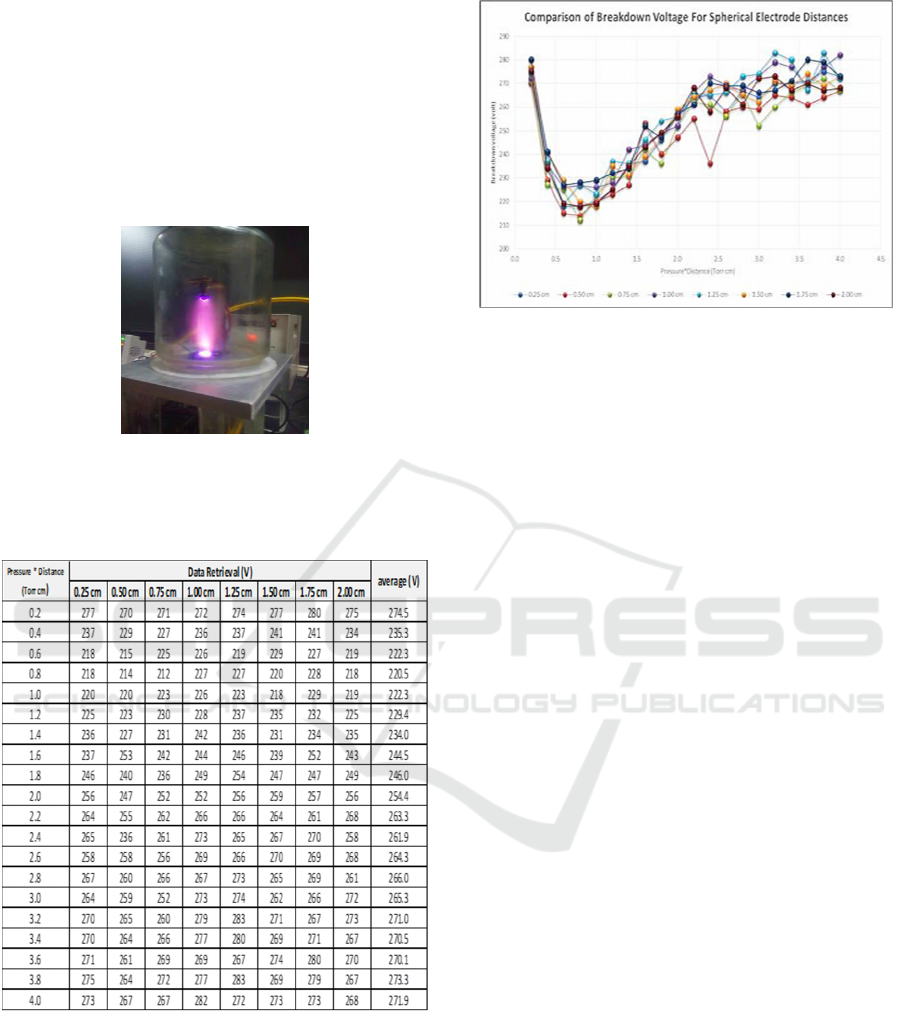
Figure 7: Plasma Reactors Used in Research.
Fig. 7. shows the plasma reactor used in this study.
At
the base there is a flat metal platform covered by a
silicon glue seal to create a vacuum when the reactor
glass is closed from above, thus preventing gas
leakage from outside into the reactor. Fig. 7 also
shows the ammeter at the bottom of the reactor
platform, which is used to measure the amount of
current when plasma occurs in the reactor. The
plasma contours of the reactor are shown using
special software, namely FEMM. The illustration in
the software calculation results shows a slice of the
electric field intensity and electric field flux in 2
dimensions using a vacuum.
Figure 8: The Intensity of The Electric Field at The
Spherical Electrode with a Distance of 1 cm and a Voltage
of 200 V.
Fig. 8 shows the electric field intensity of a
spherical
electrode with a distance of 1cm and a
voltage of
200 V. From Fig.8 it can be analyzed the
behavior of
the electric field that occurs at a spherical
electrode in
the form of a field that collects at the
cathode and
is spread along the spherical electrode
surface as
well. The distribution of the electric field
is also
visible at the anode, but very little. When
viewed
from Appendix 3, the higher the voltage used,
the
higher the intensity and the slightly more scattered
the
shape of the electric field is in the spherical
geometry. In this simulation, voltage 200 V, 500 V,
1,000V, and 1,500 V. As for the greater distance
between the electrodes, it can be seen that the shape
of the electric field is constant. In this simulation, a
distance of 1 cm, 5 cm, and 10 cm are used. The
results of plotting the electric field intensity of the ball
electrode with a distance of 1 cm and a voltage of 200
V are shown in Fig. 9.
Figure 9: The results of plotting the electric field intensity
of the ball electrode with a distance of 1cm and a
voltage of
200 V. Source: Software Simulation FEMM.
4.2 Retrieval of Data
Data was collected by gradual iteration in
accordance
with the aim of obtaining a Paschen curve
which
shows the relationship between the breakdown
voltage and the electrode distance and the argon gas
pressure.
Retrieval of data starts from the electrode distance
of 0.25 cm. First, the distance between the electrodes
is adjusted until the tip of the anode needle with the
tip of the cathode needle is 0.25 cm, then the
adjustment bolt is locked and the reactor is closed.
Table I shows an example of data collection carried
out at a pressure of 0.8 Torr and an electrode distance
of 0.25 cm.
In Table I, one of the observations of the
breakdown voltage that occurs in argon gas with a
pressure of 0.8 Torr and the distance between the
electrodes (using a needle) is 0.25 cm. In Table I, the
voltage data is skipped up to 265 V because the
current values are both 0 mA. It can be seen that when
the voltage reaches 268 V a sudden 120 mA of current
is formed, and visually a plasma is formed in the
reactor.
An example of plasma display is shown in
Figure
10. In taking this data, it can be concluded that
the
breakdown voltage for a pressure of 0.8 Torr and a
The Effect of Electronic Disposition of Spherical Electrode on Plasma Behavior in Argon Gas Media
1463
needle electrode distance of 0.25 cm is 268 V.
Observations by increasing the voltage are no longer
needed because the breakdown voltage has been
obtained. Figure 15 shows the relationship between
current and voltage.
Data collection was carried out continuously for
different pressures with a pressure gap of 0.1 Torr. At
the next level, data collection is carried out for
different electrode distances (made further).
Figure 10: One of the Experiments when there was Plasma
in The Reactor.
Table 1: Combined Average Breakdown Voltage Data
from
Each Electrode Distance and Type of Ball Electrode.
Table 1, shows the average breakdown voltage of
the spherical and plate electrodes. Fig. 11 shows a
data comparison graph of all electrode distances for
the spherical electrode.
Figure 11: Retrieval of Argon Gas Breakdown Voltage
Data
for All Spherical Electrode Data at a Distance of
0.25cm to 2.00cm.
4.3 Searching the Ideal Paschen Curve
From the results, the actual Paschen Curve is
obtained in accordance with the results of the ball
electrode data collection. From this data, several
values can be taken, including values A, B, and γSE.
Because there are difficulties in getting the Ideal
Paschen Curve using the equation in Paschen's Law,
the strategy for finding the Ideal Paschen Curve is
divided into two, the first uses the Paschen's Law
equation approach, and the second uses the
polynomial approach.
Fig. 12 shows the results of plotting the average
breakdown voltage from all distances in the
experiment, where the Ideal Paschen Curve will be
searched based on the results of this plotting. In both
approaches, MSE (mean squared error) is used as an
indicator of the similarity of the observed data with
the ideal curve data sought. The search for the MSE
value is based on the error or difference between the
observed data and the ideal curve data which is
squared to avoid negative values (called SE or
squared error) and from all SE values the average is
sought so that the MSE value appears. The lower the
MSE value, the more similar the observation results
will be to the ideal curve.
iCAST-ES 2021 - International Conference on Applied Science and Technology on Engineering Science
1464
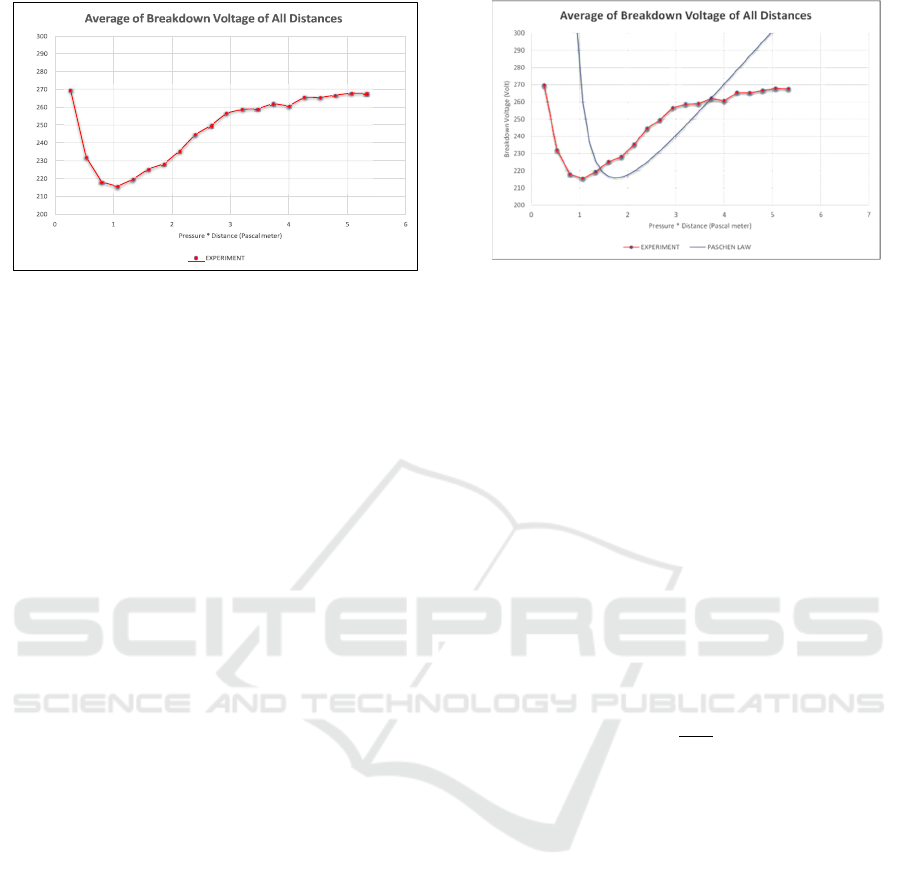
Figure 12: The result of plotting the mean breakdown
voltage over all experimental distances.
4.4 Polynomial Approach
In the polynomial approach, the Microsoft Excel
tool
is used after plotting the average breakdown
stress
over all distances. The tool in Microsoft Excel
is able
to display trend lines as well as their equations.
The
trend line that is formed can use one of several
types,
namely exponential, linear, logarithmic,
polynomial,
quadratic, and moving average. The only
curve that is
able to form a pattern close to the result
of plotting
the average breakdown stress is the
polynomial.
The 6th order polynomial approximation is shown
as in Fig. 13, which produces a line equation as in
Equation (2).
𝑉
=0.1168(pd)
6
- 2.5984
(
pd
)
5
+ 23.461
(
p) (2)
=- 108.67
(
pd
)
3
+ 264.42
(
pd
)
2
Where
,
- 291.36
(
pd
)
+ 329.26
V
B
= breakdown voltage (V)
p = gas pressure (Pa)
d
= distance between electrodes (m)
Visually, it can be seen that the polynomial
approach of the sixth order has been very detailed in
describing the Paschen Curve as shown in Fig.13
below.
Figure 13: Results of the order 6 polynomial approximation.
4.5 Paschen's Legal Approach
In the Paschen Law approach, the values A, B, and
γSE
are taken according to the results of previous
research. The γSE value is determined to be 1.32
according to the results of research on secondary
electron emission constants for copper metal (as the
electrode material used in this study) at a voltage of
240 V.
Meanwhile, the value of A as the gas ionization
constant was determined to be 16 Pa · m-1 and B as
the excitation constant and the ionization energy was
240 V · Pa · m-1, according to the experimental
results for argon gas. The next step is
to fill in the three
values while observing the shape of
the curve that
occurs. The following is the equation
of Paschen's
Law as in Equation (3).
𝑉
𝐵
=
(3)
Where:
VB = breakdown voltage (V)
A = gas ionization constant (Pa m-1)
B = excitation constant and ionization energy
(V Pa m-1)
γSE = secondary electron emission coefficient
p = gas pressure (Pa)
d = distance between electrodes (m)
In Fig. 14, the results of the Paschen's Law curve
approach are shown using a value of A of 16 Pa · m -
1, B of 240 V · Pa · m-1, and γSE of 1.32.
Fig. 14. shows the curve of the results of the
approach from Paschen's Law using an A value of 16
Pa · m-1, B of 240 V · Pa · m-1, and γSE of 1.32,
which results in an MSE value of 12,654.49. Some of
Paschen's Law theoretical curves fall below the graph
boundary line on the y-axis.
Breakdown
Voltage
(Volt)
The Effect of Electronic Disposition of Spherical Electrode on Plasma Behavior in Argon Gas Media
1465
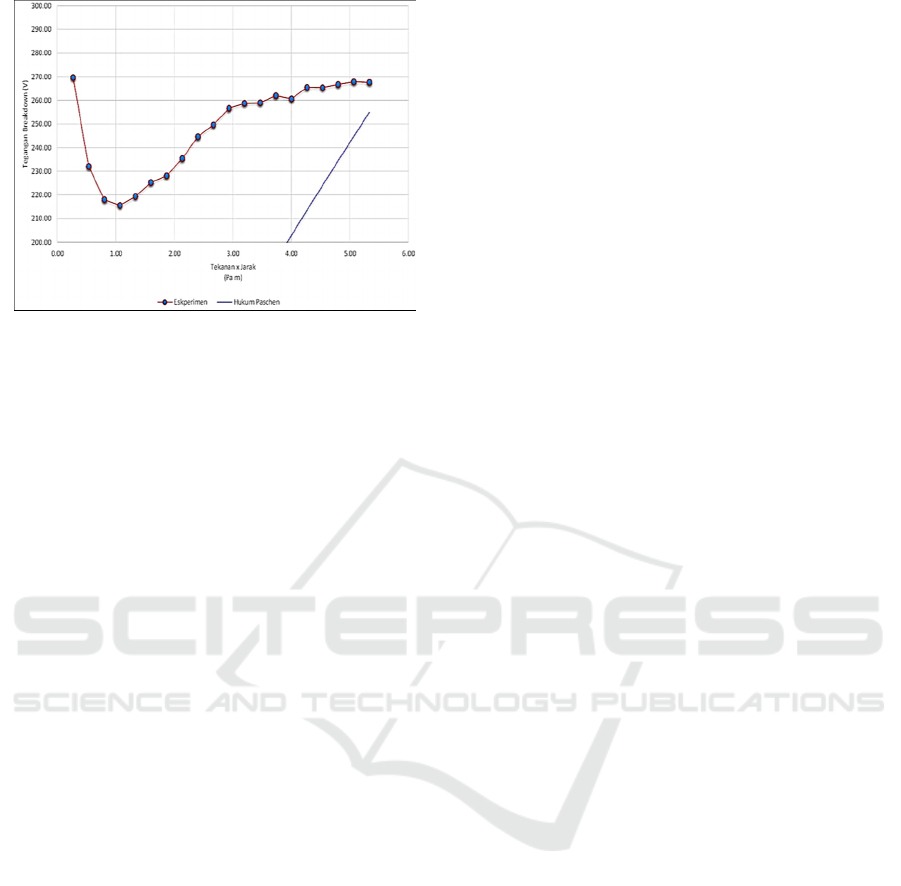
Figure 14: Paschen's Law Approach with A = 16 Pa m-1, B
= 125 V Pa m-1, and γSE = 1.32, with a minimum
breakdown voltage limit of 200 V.
REFERENCES
Davidson, J. H. ( 2000). Recent Trends In Electrostatic
Precipitation. New York: McGraw-Hill Inc.
E., Kuffel, W.S., Saengl, J., Kuffel. (2000). High Voltage
Enggineering Fundamental. Published by Butterworth-
Heinemann. Typeset by Laser Words, Madras, India.
Iskander, M.F. ( 1992). Electromagnetic Fields and
Waves. New Jersey: Prentice Hall Inc.
Nur, Muhammad. ( 2011). Fisika Plasma dan
Aplikasinya. Universitas Diponegoro. Semarang.
iCAST-ES 2021 - International Conference on Applied Science and Technology on Engineering Science
1466
