
Management Information System Identification and Projection of
Staff Requirements at Manado State Polytechnic
David, Monalis Amalela and Mikael Namas
Institute Department of Electrical Engineering, State Polytechnic of Kupang, Kupang, Indonesia
Keywords: Management Information System, Managers, Decision, Staff, Projections, Analysis.
Abstract: The current staffing of both teaching and educational staff at Manado State Polytechnic is still being analyzed
manually without looking at the parameters that affect quality. This is because there are no future projections
for the number of staff required based on the number of staff who will be active and retire each year. If we
have computerized staffing tenure data, of course we can make projections annually for the number of staff
we need. This is of course also compared with other parameters such as the number of students and available
classrooms. Management Information Systems are computer-based systems to support leaders or managers
in making analysis and making managerial decisions. In this study, researchers will create a Management
Information System application that will accommodate all employee data, namely the work period and
retirement period. It can also contain data on classrooms and class numbers of students per study program
each year as parameters for analysis and decision making on projected staff needs. This system will be able
to store and display staff statistical data with certain parameter criteria in the form of graphs or diagrams. So
that the leadership of Manado State Polytechnic can easily display and analyze the needs of staff each year.
Thus, this management information system is expected to be able to accommodate employment data in terms
of tenure and can also help the leadership to propose the number of staff needs per year in detail.
1 INTRODUCTION
The distribution of teaching staff and teaching staff at
Manado State Polytechnic is still not balanced and
efficient. This is due to the large number of staff who
have the same competence and very few staff who
have the competence required by the work unit. The
main cause of this problem is the absence of a system
that can identify and project staff requirements
according to the needs of the work unit. Therefore, an
application that can store information on tenure and
staff competency is needed. The Management
Information System is a computer-based system that
can assist leaders and decision makers in solving
managerial problems. This information system
application is urgently needed at Manado State
Polytechnic to store data on staff tenure and their
competencies. With this information system, the
leadership of the institution can analyze staff
requirements based on criteria and other parameters
such as the number of students and classrooms. So
that the annual projections for staff requirements can
produce efficient results. This application will help
the leadership to display the number of active staff
and who will retire each year. With this management
information system can store and display the results
of the analysis of employee needs accurately. So that
the projected staff needs will be obtained to be
proposed to the central government. It is hoped that
this application can help a balanced and efficient
distribution in competent work in each work unit.
2 BASIC THEORY
The concept of Information Management has been
defined as the ability of an organization to create,
maintain, retrieve information at the right time, in the
right place, and in the right person, at low cost, to be
used as the best medium and used in decision making.
In short, therefore, the key content involved in
information management is managing information in
an organization using modern information
technology. The concept of Information Systems is a
system for receiving data / information as raw
material and through one or more transmutation
processes, producing information as a product. It
consists of the following functional elements relating
David, ., Amalela, M. and Namas, M.
Management Information System Identification and Projection of Staff Requirements at Manado State Polytechnic.
DOI: 10.5220/0010967200003260
In Proceedings of the 4th International Conference on Applied Science and Technology on Engineering Science (iCAST-ES 2021), pages 1453-1458
ISBN: 978-989-758-615-6; ISSN: 2975-8246
Copyright
c
2023 by SCITEPRESS – Science and Technology Publications, Lda. Under CC license (CC BY-NC-ND 4.0)
1453

to the organization and the environment in the form
of physical records of data, processing -
transformation according to the "special" needs of the
organization, transmissions - flows that occur in
information systems, storage - presupposing some
expected future use, recovery - searching for recorded
data, presentations - reporting, communication, and
decision-making - inclusions that are controversial,
except to the extent that the information system is
involved in making decisions concerning itself.
2.1 OLAP (Online Analytical
Processing)
According to Turban, Sharda, Delen, and King (2011:
77) the main operational structure in OLAP is based
on a concept called a cube (cube). The cubes (cubes)
in OLAP are multidimensional (actual or virtual) data
structures that allow fast data analysis. It can also be
defined as the ability to efficiently manipulate and
analyze data from multiple perspectives. Arranging
the data into cubes aims to overcome the limitations
of laser-relevant data. Relational databases are not
suitable for fast and close analysis of large amounts
of data. Instead, they are better suited for
manipulating records (adding, deleting, and updating
data) that represent a series of transactions. Online
Analytical Processing (OLAP), which is a database
concept where data processing is used to analyze data.
yet clear and complex so that no immediate solution
can be used).
Such as sales and age trends. OLAP features:
1. Is read-only
2. Oriented in business subjects
3. Integrated data
4. Data is historical
5. Erratic data activity
2.2 The Several Differences between
OLTP and OLAP
From the above understanding, there are several
differences between OLTP and OLAP:
• OLTP (Online Transaction Processing):
1. The query used is quite simple.
2. The processing speed is basically very fast.
3. The required data space is relatively small.
4. The processed data includes the latest data.
5. The main function of OLTP is to support the
operational activities of a company using daily
databases. An example is an application for entering
consumer data, viewing transaction data, adding
employee data and so on.
• OLAP (Online Analytical Processing):
1.The query used is quite difficult.
2.The speed of the process depends on the data
being processed.
3.The required data space is relatively large.
4.Processed data includes past data (history data).
5.The main function of OLAP is to be able to
produce information from existing data analysis so
that it can assist in making a decision in a company
2.3 ETL Concept (Extract Transform
Load)
Data extraction is the process by which data is
retrieved or extracted from various operational
systems, either using queries, or ETL applications.
There are several data extraction functions, namely:
1. Automatic data extraction from the source
application.
2. Filtering or selection of extracted data.
3. Sending data from various application platforms
to data sources.
4. Change the data layout format from the original
format.
5. Storage in temporary files for incorporation with
extracted results from other sources.
2.4 Electric Field Generating
Electrodes
Transformation is a process in which raw data (raw
data) extracted is filtered and modified according to
applicable business principles. The steps in data
transformation are as follows:
1. Map the input data from the original data scheme
to the data warehouse schema.
2. Convert data types or data formats.
3. Cleaning and eliminating duplication and data
errors.
4. Calculation of derivative or preliminary values.
5. Calculation of aggregate or summary values.
6. Data reference integrity check.
7. Filling in empty values with default values.
8. Merging data.
The last process that needs to be done is the
process of loading the data obtained from the
transformation into the data warehouse. The way to
load data is to run SQL scripts periodically.
2.5 Website
Website or site can be interpreted as a collection of
pages that are used to display text information, still or
motion pictures, animations, sounds, and or a
iCAST-ES 2021 - International Conference on Applied Science and Technology on Engineering Science
1454
combination of both static and dynamic that form a
series of interrelated buildings, each of which is
connected with page networks. The relationship
between one web page with another web page is
called a hyperlink, while the text is used as a
connecting medium is called hypetext. There are
several things that are prepared to build a free
website, then the supporting elements must be
available as follows:
1. Domain Name (Domain Name / URL - Uniform
Resource Locator)
2. Home Website
3. Content Management System (CMS) The
development of the website world at this time is
more emphasis on content management is a
website. Users who can not website programming
languages at this time can create a website using
the CMS.
Types of Web Along with the development of
information technology so quickly, the website also
experienced a very significant development. In
grouping web types, more directed based on the
function, nature or style and the programming
language used.
The types of web based on nature or style,
namely:
1. Dynamic Website, is a website that provides
content that is always changing at any time. The
programming languages used include PHP, ASP,
NET and utilizing a MySQL or MS SQL database.
For example the website www.artikel.com, www.
detik.com, www.tecnomobile.co.cc, and others.
2. Static Website, is a website whose content is very
rarely changed. The programming language used
is HTML and has not utilized the database. For
example: organization's web profile, and others.
3 RESULT
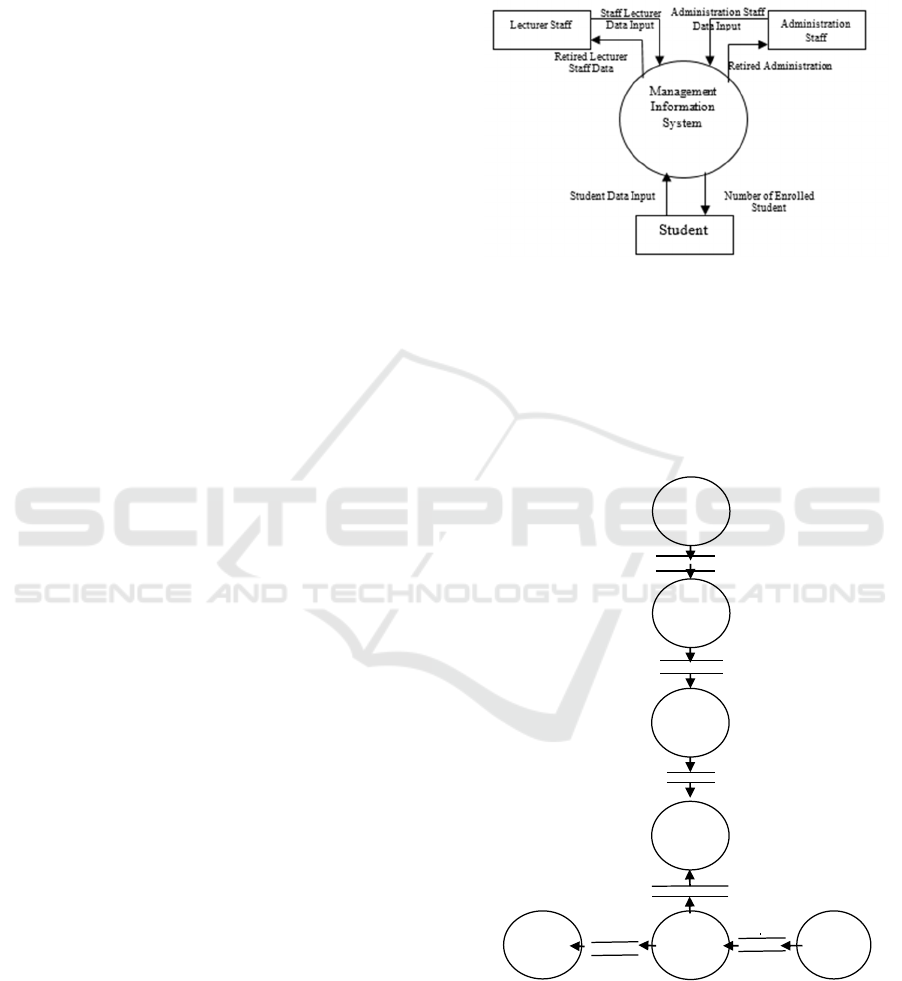
3.1 Data Flow Diagram
Data flow diagrams are an overview of the data flow
that runs on the application system where in this
design the data flow diagram will be explained either
through context diagrams or DFD Level1 so that it
can be known the details of the process related to the
data flow from the system process to entities that use
the system.
• Context Diagram
In this stage the author will explain the data flow in
the application as a whole where it is known that there
is a support system for employee performance
appraisal decision which is the core data flow process
that is accessed by 3 system user entities, namely
admin, leader and also officers.
Figure 1: Context Diagram.
• Level 1 Diagram
Next will be described about the system process flow
in more detail per sub-process system for each
application page, the following will be divided
process data flow for each application page, among
others.
Figure 2: Level 1 Diagram.
3.2 Table Relational Model
Based on the level 1 diagram above, we build 3
related tables. The tables contain the property called
5.0
Display the
enrolled
studenst
7.0
Counting the
enrolled
students
6.0
Input
Student Data
Ratio of Staff and Student
Student Data
Number of enrolled student
2.0
Counting of
Staff Data
1.0
Inp5.0
Display the
enrolled
studenst
3.0
Displa4.0
Projection
5.0
Display the
Data
Dosen - Pe
g
awai
Number Retired Staff Data
4.0
Projection
Staff
Requirements
Retired Staff Data
Management Information System Identification and Projection of Staff Requirements at Manado State Polytechnic
1455
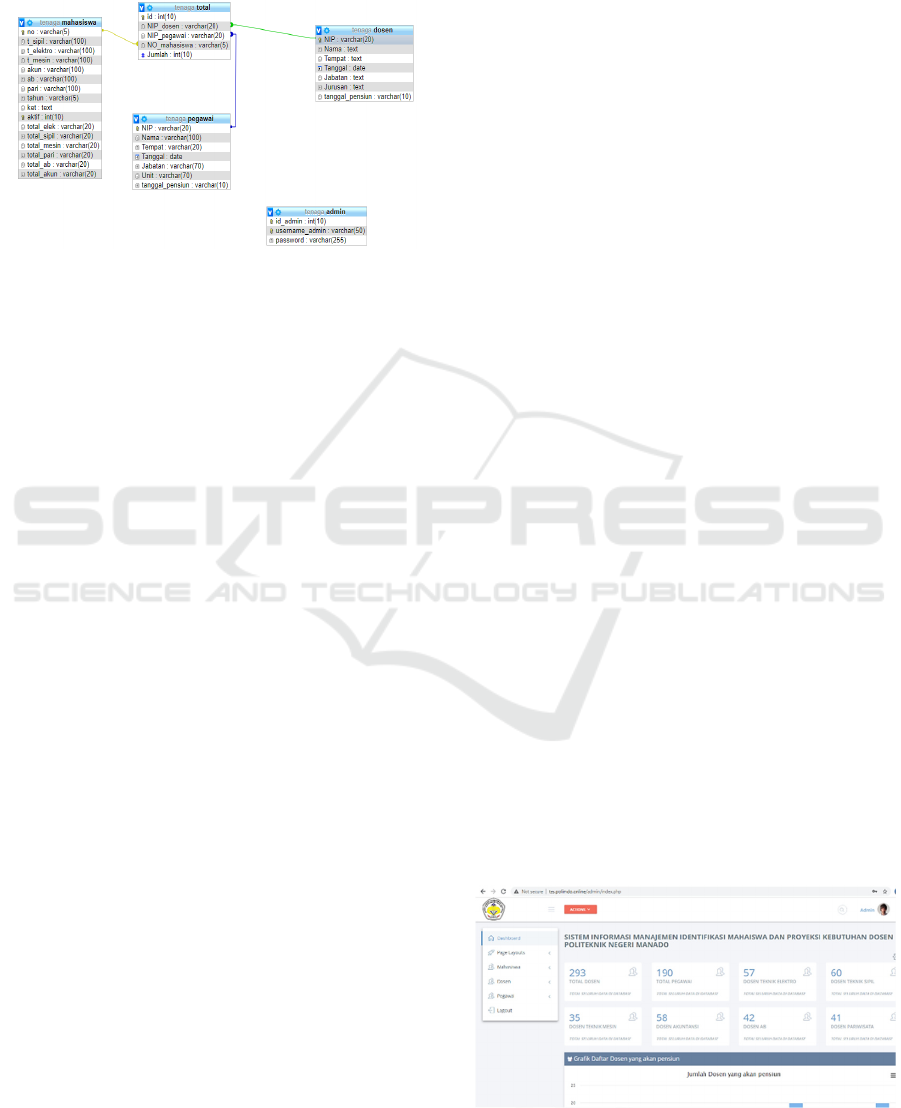
fields and a primary key. To relate the all tables, we
make an additional table at the center that connect the
3 tables by itself. So, there are 4 related table
altogether with its own fields.
Figure 3: Table Relational Model.
3.3 System Design
In the plan to implement the management information
system into computer application. It is necessary to
carry out activities of its application. The steps that
need to be taken to implement the system are making
programs, testing programs, training and receiving
documentation, but in writing this thesis the
implementation of the system is carried out only to
the stage of making the program. From the results of
the needs analysis, the design, design and
manufacture of the application program the author
succeeded in making a decision support system
application related to performance appraisal in
providing information of the number employment
who will retired ini a certain period. So does the
enrolled student information in all department in
Manado State Polytechnic. Where in the system
created by the author will be operated by 3 users with
access capacity of each according to the needs of the
management information system to calculate the ratio
in order to have an accurate projection of staff
requirements.
The ability of the application made is that it can
process employee data related to each employee's
personal data information and number, in addition
there is also an analysis of employee assessment
criteria where each employee will be aggregate to
have a total number of requirements of administration
staff and the lectures. We design the database based
on the data flow diagrams. There are three tables
consist of personal data of the students, lectures and
administration staff. Students’ table consist of the
number of the student in all department based on
study program and education level (D3 or D4).
Lecturers’ table consist of NIP, name, date of birth
and department. Administration staff table consist of
NIP, name, date of birth and working unit. Advantage
of the application is that there is data collection
related to their own department. So, we can calculate
the time of retired based on their date of birth. After
that we displayed it based on department and year
period. The calculation of the number of enrolled
students in certain year is calculated by the total of all
year in the period minus the number of graduates.
Noted that the number of graduates is counted for D3
in 3 years of study and D4 in 4 years study. For
example, the total number of enrolled students in
2019 is total enrolled student in 2015 till 2019 minus
in 2019 (D4 – 4 years) and 2018 (D3 – 3 years). The
number of retired lecturers and administration staff
are calculated for the certain year minus the date of
birth. After getting the total number of students,
lecturers and administration staff, we displayed it
based on the certain period. It will display the data of
employee who will retired in that year. Then the
graphic in several year of retired can be display. So,
the manager or the leader in Manado State
Polytechnic can analyze the tables and the graph.
Based on the aggregated table of lecturer and
administration staff, the leader can analyze and
decide the employee requirement for a certain year
period. Finally, it can make a projection of the
lecturers and staff administration every year based on
the enrolled student and retired employee. So, it is
hoped that by applying this application by the leader
or decision maker in Manado State Polytechnic, can
analyze and make a projection of staff accurately.
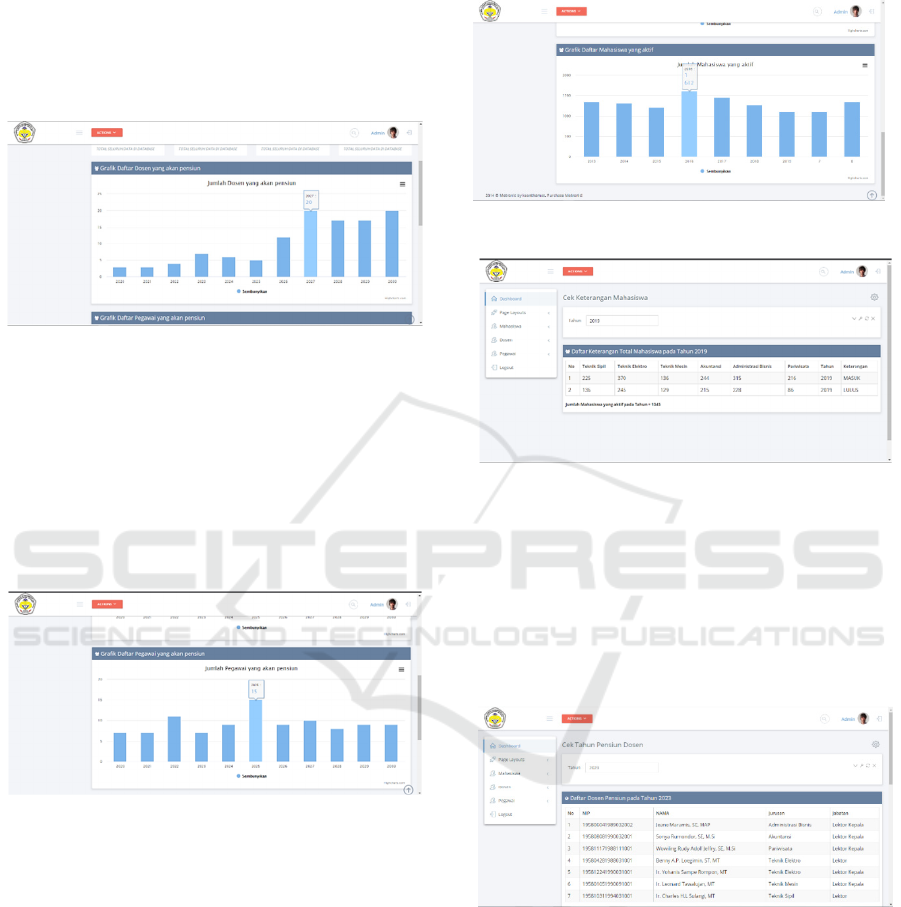
3.4 Result and Discussion
• Dashboard/ Home Page
The dashboard page of application contains several
button and option such as Student, Lecturer and
Administration Staff. The number of them in current
year are displayed in the dashboard/ main page. It
displayed the number of student and lecturer in all
department.
Figure 4: Dashboard.
iCAST-ES 2021 - International Conference on Applied Science and Technology on Engineering Science
1456
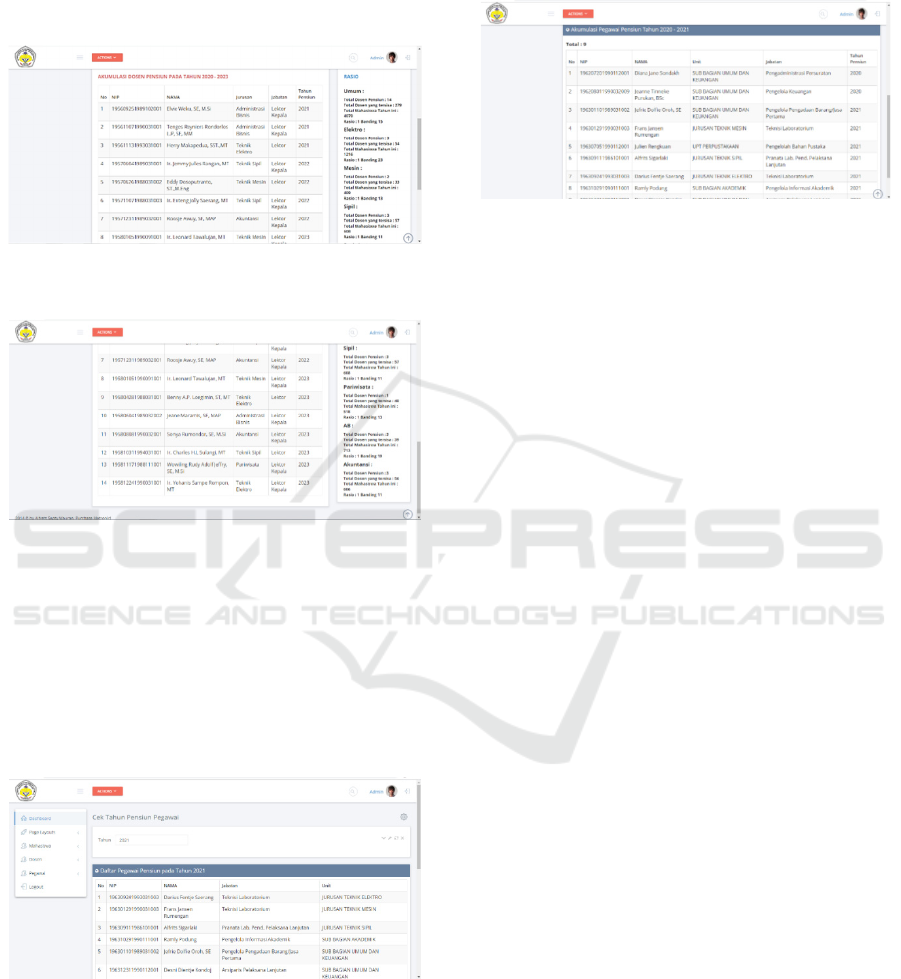
• Retired Lecturer Data
At the second row of dashboard display the graph of
the number of retired lecturers in several year period.
The result is shown by the chart and the number of
the lecturers in bar. In the total number of students is
calculated automatically by the list of the retired
lecturers.
Figure 5: The number of retired lecturer.
• Retired Administration Staff Data
The second graph ini the dashboard is the number the
retired administration staff. The graph displays the
number of retired staff in certain year period. The
graph can be used by the leader for make a projection
of staff requirements. The number of yearly retired
administration staff displayed per-year by the bar and
number.
Figure 6: The number of administration staff.
• Enrolled Student Data
At the third row displayed the number of enrolled
students. The chart shows the number of the student
calculated by 5 years accumulation enrolled student
minus the graduate students. The graduate student of
D3 program is only three years and D4 program is
four years.
The form bellow shows us the number of enrolled
students in certain year, for example 2019. The pages
show the number of students in all departments. It
shown the number of enrolled student and graduate
student in certain department. Based on the graph, the
leader can analyze the characteristic of the enrolled
student for the period of 2019.
Figure 7: The number of enrolled students.
Figure 8: The number of enrolled student in a year.
• The Accumulation of Retired Staff Data
The table below show us the number of lecturers who
is retired until 2023. It shown there are 7 lecturers
with their own department. It ordered in department
for grouping it easily. So, the leader knows the
number of lecturers in 2024 that is without the 7
lecturers.
Figure 9: The list of retired lecturers in a year.
The ideal ratio of the lecturer and student for
vocational school is 1:20 with its compensation of
50% low and up maximum number. For getting the
ratio number we calculate the number of lecturers in
a certain year – retired lecturers: the number of
enrolled students. It must be considered that the
student in a year consist of 4 serial year of D4 students
and 3 serial year of D3 students. Because the D3
student will graduate in 3 years only. The table below
Management Information System Identification and Projection of Staff Requirements at Manado State Polytechnic
1457
shows us the accumulation number of lecturers and
students in all department in Manado State
Polytechnic. It is also calculated and displayed the
ratio of lecturer and student in all departments in a
certain year.
Figure 10: The accumulation of retired lecturer of a
department in a year.
Figure 11: The accumulation of retired lecturer of a
department in a year.
Next table show us the number of retired
administration staff in 2025. It shown there are 7 staff
will retire in 2025. It shows s their own working unit,
so leader can evaluated the requirement in the
working unit. If the Unit have 2 retired staff in that
year period, that it will be a requirement for that unit
to have a new staff.
Figure 12: Retired administration staff in a year.
The next table show us the accumulation of the
retired administration staff who will be retired in a
certain year. So, It displayed the total number of
administration staff with their unit and which year
they will be retired. As an accumulation it shows the
number of the of retired administration staff in a year.
Figure below tell us that there will be 9 administration
staff of retired in 2021.
Figure 13: The accumulation of retired administration staff
in several year.
4 CONCLUSION
With this application, calculations can be made more
quickly, and the results of the calculations can be
verified by the leadership of the leader to make a good
projection of staff requirements. This application can
calculate the number of enrolled student in certain
year or period. The number of retired lecturer and
administration staff can be calculated by the year of
birth. Where the lecturer will retire at the age of 65,
the administration staff at the age of 58. But the
lecturer who have the predicate of professor can be
retired at the age of 70. The number of enrolled
student is calculated by the followed 4 years, but the
graduate student are 4 years of D4 and 3 years of D3.
So this application can describe the characteristic of
the number of employee and student by showing it in
graph. So, the manager can easily analyse the
requirements of staff in a certain year and period by a
good projection. The result is accurate enough by
comparing with the manual calculation. This
application can be used easily and accurately.
REFERENCES
Hendri Susanto, “Pengembangan Sistem Informasi
Pendidik dan Tenaga Kependidikan”, Jurnal
Pendidikan Humaniora 2019
Irvin Nugroho, Sistem Informasi Penerimaan Siswa Baru
Berbasis Web dengan PHP dan SQL, 2011
Jayant Oke, Management Information System, Nirali
Prakasan 2009
Keneth Laudon, Sistem Informasi Manajemen, Pearson
2012
Raymod McLeod, George Schell, Management
Information System, Pearson 2009
iCAST-ES 2021 - International Conference on Applied Science and Technology on Engineering Science
1458
