
Design of Tracker based PV System for Health Care Facilities in
Remote Islanded
Syafii
1
, Lovely Son
1
and Rahmad Fahreza
2
1
Electrical Engineering Department Engineering Faculty, Universitas Andalas, Padang, Indonesia
2
Mechanical Engineering Department Engineering Faculty, Universitas Andalas, Padang, Indonesia
Keywords: Tracker based PV System, Heath Care Facilities, Optimum Design.
Abstract: In this paper, the solar based electrical power system for health care facilities in the Mentawai island has
been presented with different tracking mechanisms. First, the health center's electrical system was designed
for a photovoltaic (PV) system with fixed installations combined with diesel generators as backup systems.
The optimal results with the lowest cost of energy (CoE) values are obtained with the PV/Diesel
configuration and storage system in operation. Furthermore, the electrical system was tested using three
different PV structure installations - fixed structures, single-axis tracking, and dual-axis tracking
mechanisms. Among the three tracking configurations, the two-axis tracking system was found to be the
most profitable in terms of PV electricity production 3,931 kWh in a year and had the lowest CoE of 0,307
$/kWh. The payback period for a flat PV system longer than the two-axis tracker PV system. Apart from the
increase in power generation, PV systems with two-axis solar tracking will need fewer PV modules to
supply the same load, hence requiring less space.
1 INTRODUCTION
Community health centers for remote areas in the
Indonesian archipelago need to be considered during
the current Covid-19 pandemic. Lack of facilities
and electricity resources is an important issue that
needs attention. Based on the the Indonesian state-
owned power utility firm, PT PLN (Persero)
planning document in Electricity Supply Business
Plan 2018-2027, there are still some areas in
Indonesia that have an electrification ratio below
80%, mainly in the islands area. The availability of
electricity resources for the region is a priority, but
the quality is less noticeable.
Generally, the supply of electricity in the islands
relies on diesel generators. Diesel generators are
known consume expensive fuels and are not very
environmentally friendly. Therefore, the presence of
the assembler from an easily installed and
environmentally friendly solar energy source
becomes the right choice as an electric power source
in rural health clinics for the islands. This is also in
line with the Nawacita vision as part of the
Indonesia government's policies, which is intended
to build a political, economic, and Indonesia cultural
sovereign. This policy has nine work programs, one
of which is to develop Indonesia from the periphery
by strengthening regions and villages.
Several previous studies have been carried out
by utilizing solar energy with low operational costs
and environmentally friendly. The 6,709 kWh
energy per day during clear sky can be produced by
using 5@250 Wp PV panel in West Sumatera. In the
literature, a study on the design of hybrid PV power
plants with battery storage has been carried out for
health care clinics in remote areas in the Gema sub-
district of Kampar Regency. Several studies on the
optimization and feasibility of PV have also been
carried out for rural villages in Nigeria , Masirah
Island, and rural desert areas in Oman. The optimal
design and feasibility analysis carried out using
Homer software. The result obtained revealed a
hybrid PV/wind/diesel/battery system as the most
cost-effective. However, the load of health care
center studied used general health clinic facilities
and not support Covid-19 patients and used flat solar
panel installation.
The feasibility study of the PV system in a
public health center in the midst of the covid-19
pandemic must pay attention to some Covid service
equipment. The lack of weather data will affect the
calculation of economic viability, especially on PV
Syafii, ., Son, L. and Fahreza, R.
Design of Tracker based PV System for Health Care Facilities in Remote Islanded.
DOI: 10.5220/0010966400003260
In Proceedings of the 4th International Conference on Applied Science and Technology on Engineering Science (iCAST-ES 2021), pages 1415-1419
ISBN: 978-989-758-615-6; ISSN: 2975-8246
Copyright
c
2023 by SCITEPRESS – Science and Technology Publications, Lda. Under CC license (CC BY-NC-ND 4.0)
1415
systems installed in the tropical area. Economic
feasibility studies have also been carried out in
previous studies taking into account the cycling cost
of each component. The economic feasibility study
also functions to determine the optimal NPC (Net
Present Cost) of all the system options designed.
Details of the PV system design for the Community
Health Center (Puskesmas) in the Siberut Island, one
of the islands in the Mentawai Islands as a case
study will be explained in the following section.
2 DESIGN OF PV POWERED
HEALTH CARE FACILITIES
2.1 Health Care Clinic Facilities
In rural communities, the health care facilities are
not in a well-developed state. In some cases, rural
individuals do not have access to these facilities and
are required to travel to distant places or urban areas.
Considering the current pandemic condition, health
facilities in remote island health centers need to be
equipped with Covid patient handling equipment
and sufficient availability of electrical energy. The
Covid-19 patient handling equipment at least as
default data given by Hybrid Optimization of
Multiple Energy Resources (HOMER) Powering
Health Tool (NREL, 2020):
Covid Isolation Ward
Exhaust fan (per Covid isolation cubicle)
Exhaust fan (staff change area)
Basic Care Ward
Exhaust fan (per Covid isolation cubicle)
Oxygen Concentrator (50% of beds)
BiPAP respirator (50% of beds)
CPAP respirator (50% of beds)
Infusion pump
Exhaust fan (staff change area)
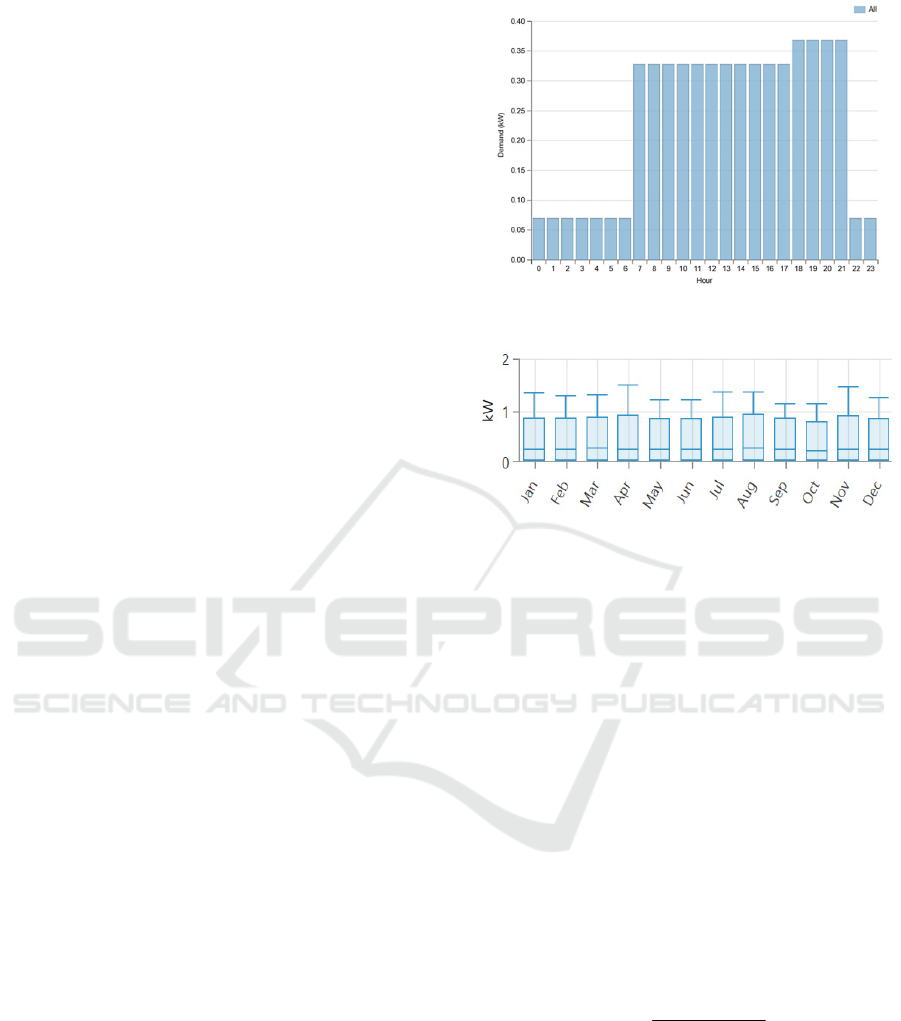
The daily electrical demand of health care facilities
is as shown in Figure 1. The average power of health
care facilities load is 0,24 kW with peak load is
1,49kW. The energy average of 5,68 kWh/day with
load factor is 16.
The monthly average load profile with a peak
demand in April and November in November is
illustrated in Figure 2.
Figure 1: Daily electrical demand of health care Facilities.
Figure 2: Annual electrical demand of health care
Facilities.
2.2 Homer based PV System Design
The HOMER Powering Health Tool uses the
proprietary optimization algorithm of the HOMER
(Hybrid Optimization Model for Multiple Energy
Resources). The tool can be used through link:
https://poweringhealth.homerenergy.com/ developed
by the National Renewable Energy Laboratory
(NREL) (NREL, 2020). The economic feasibility
study of the generation installation commonly uses
general business feasibility study criteria such as
CoE and net present cost (NPC) (Haghighat et al.,
2016). These criteria can be used to determine the
profitability of a project as an initial consideration
PV system installation.
The cost of energy can be calculated by using the
following equation (2):
Total
OutF
kWh
TInvest
CoE
×
=
(1)
where:
Invest = initial investment cost ($)
TOutF = Total Out Flow ($)
kWhTotal = Total PV energy generated (kWh)
The net present cost or life-cycle cost of a
component to be evaluated is the present value of all
the costs of installing and operating the component
during the life of the project, minus the present value
iCAST-ES 2021 - International Conference on Applied Science and Technology on Engineering Science
1416
of all revenue generated during the life of the
project. Homer calculates the net present cost of
each component in the system and the overall
system. The formula for determining NPV is as
follows (O. dan C. H. Thum, 2013).
=
−
+
=
m
t
t
t
Invest
k
CIF
NPV
0
)1(
(2)
where:
m = lifespan of the PV system in year
CIF = cash in flow ($)
k = Discount rate
The payback period can be calculated by using the
following equation (3):
)(12*)(
1
month
F
F
yearyPP
D
i
i
+=
−
(3)
where:
PP = payback period
yi = year at full recovery or net cash flow equal to
zero
Fi-1 = unrecovered cost at the beginning of last
year
FD = cash flow during the year
The annual maintenance and operational costs
for the PV system generally accounted as 1 - 2% of
the total initial investment cost (R. G. J.Lee, B.
Chang, 2016). The large percentage of annual
maintenance and operational expenses in the PV
power plant covering costs for solar panel cleaning
work, maintenance and inspection costs of
equipment and installations will be set at 1% of the
initial total investment because Indonesia only has
two seasons, i.e., the rainy season and the dry season
so that the cost of cleaning and maintaining the solar
panel is not as high as the country that has four
seasons in one year. Besides, the determination of
this percentage is also based on the level of wage
labor in Indonesia, which is cheaper than the wage
rate of labor in other countries.
3 DESCRIPTION OF TEST
SYSTEM STUDY
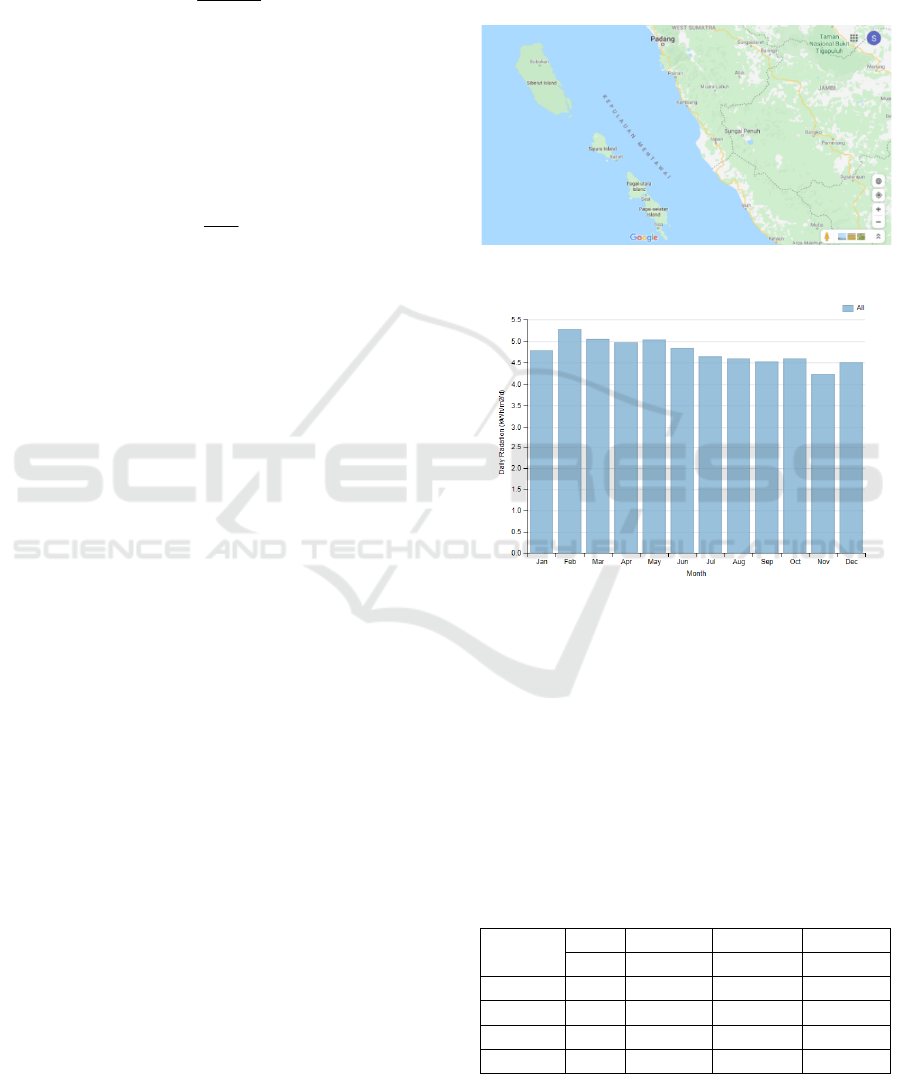
The feasibility study carries out for health care
facilities in Simatalu, West Siberut, Kepulauan
Mentawai, West Sumatra, Indonesia. The location
coordinate is 1 degree 25.56 minutes South for
latitude and 98 degrees 55.47 minutes East for
longitude.
The average solar radiation in kWh/m
2
/day is as
Figure 4 with the highest radiation in February.
The optimum design of a hybrid power system
for a small health clinic in Mentawai Island was
carried out using a free online Homer Powering
Health Tool and detailed analysis with different
tracking mechanisms using Homer Pro 3.13.
Figure 3: Mentawai Island, West Sumatra, Indonesia.
Figure 4: The average solar radiation of Mentawai Island.
4 RESULT AND DISCUSSION
The simulation results containing all of the system
configurations that meet the electrical needs of the
simulated health clinic are shown in Table 1. Where
D stands for Diesel, PV stand for photovoltaic and S
stands for Storage system. They are ranked in
ascending order with the lowest life-cycle cost at the
top.
Table 1: The capacity estimate of hybrid system installation.
Config
PV Diesel (D) Storage (S) Converte
r
(kW) (kW) (kW·h) (kW)
1. D/ PV /S 2 2 14 1
2. PV /S 7 — 11 2
3. D / S — 2 4 0
4. D — 2 — —
Design of Tracker based PV System for Health Care Facilities in Remote Islanded
1417
The simulation results for economic feasibility are
shown in Table 2.
Table 2: Economic feasibility result.
Configuration
Initial
Capital
TNPC
Operating
Cos
t
COE
($) ($) ($/yr) ($/kWh)
1. D / PV / S 8,073 11,415 191 0.314
2. PV / S 11,201 13,504 131 0.372
3. D / S 3,449 21,207 1,013 0.583
4. D 2,216 35,236 1,884 0.969
The optimum system design configuration with
minimum cost results, i.e., 0.314 $/kWh, can be
extracted from the first row of tables. Solar panels
require very little maintenance since there are no
moving parts and generally self cleaning, but in
mainly dry areas or where panel tilt is minimal, dust
and other substances such as bird droppings can
build up over time and impact on the amount
electricity generated by a module. Therefore, in this
study, the fixed cost for operation and maintenance
are chosen 1 % of the initial investment. The
degradation of the solar panel is also considered in
this study, and the PV system energy generated
decreases every year.
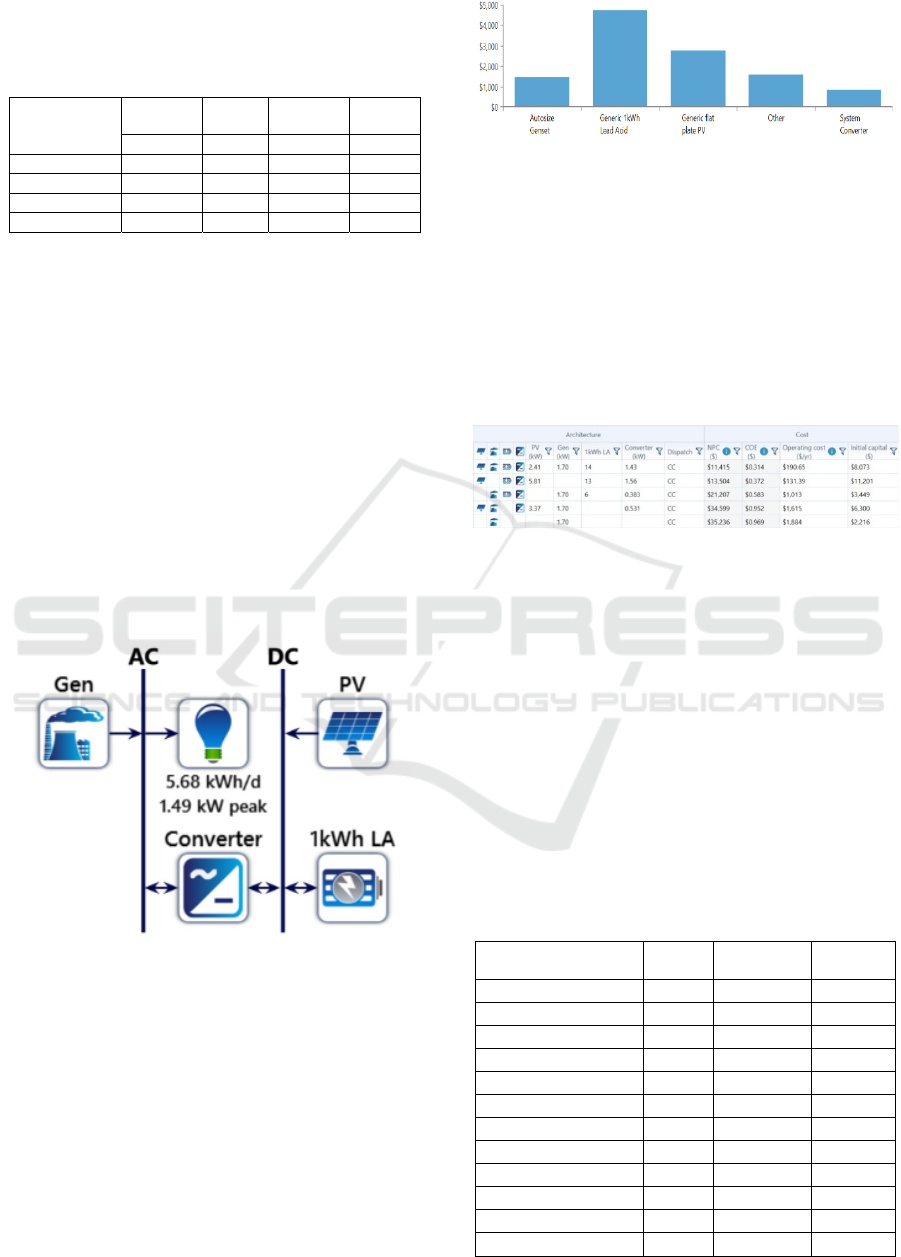
The schematic of the PV-Diesel and storage
system for further detail analysis is, as shown in
Figure 5.
Figure 5: Schematic of the PV-Diesel and storage system.
The 643 solutions were simulated with 473 were
feasible, and 170 were infeasible due to the capacity
storage constraint. 118 were omitted due to 33 for
lacking converter, 15 for having an unnecessary
converter, and 64 no source of power generation.
The detailed simulation result obtained, as shown in
Figure 6 for NPC result per component and the
categories optimization result shows in Table III.
Figure 6: Net present cost per components.
From Table 3, it is found that the optimal size of the
PV system is 2.41 kW, diesel generator 1.7 kW, and
14 units of lead-acid battery and a 1.43 kW power
converter. The payback period of PV installation for
household tariffs can also be calculated using
equation (3) based on Table III data. The payback
period from Homer Pro simulation is obtained three
years and four months.
Table 3: Categorized Optimization Result.
After the optimal configuration value is obtained,
then testing is done using a solar panel with a tracker
system. The three different PV structure installations
are fixed structures, single-axis tracking, and dual-
axis tracking mechanisms. The initial investment
cost for a single axis solar track is 10% -15% more,
and for a two-axis solar track is 25% more than a
fixed installation structure. Tracking settings require
periodic maintenance of rotating parts, and moving
parts may need to be changed from time to time.
Repairs and replacements can occur in the long run
with tracker settings. The optimum sizing and its
technical and economic parameter results are shown
in Table IV.
Table 4: The optimum sizing and its technical and
economic parameter results.
Parameter
without
Tracker
Tracker
(Single Axis)
Tracker
(Dual Axis)
P
V (kW) 2.41 2.43 2.25
D
iesel (kW) 1.7 1.7 1.7
B
a
t
tery 14 14 13
C
onverte
r
1.43 1.47 1.48
P
V Production (kWh/yr) 3341 3519 3931
R
enewable Fraction 90.9 91.0 89.8
F
uel 56.8 55.7 63
C
OE ($/kWh) 0.314 0.313 0.307
N
PC($) 11415 11363 11148
P
V Capital Cos
t
($) 2767 2784 2579
I
nitial Capital 8073 8107 7728
Simple payback (yr) 3.4 3.4 3.2
iCAST-ES 2021 - International Conference on Applied Science and Technology on Engineering Science
1418

From the simulation results of Table 4, it is
obtained that the smallest PV capacity and the
number of batteries occurs in cases where a two-axis
tracker system is used. The two-axis tracker system
has good implications for the investment cost of PV
systems to be 2,579 $. The use of a two-axis tracker
system has increased electricity production from
solar energy sources from 3,341 to 3,931 kWh/yr.
Apart from the increase in energy production 0f, PV
systems with two-axis solar tracking will need fewer
PV modules and batteries to supply the same load,
hence requiring less space.
From the economic point of view, a PV system
with a two-axis Tracker is more economical because
it produces the lowest COE of 0.307 $/kWh as well
as the payback period of this system is faster around
0.2 years. The payback period for the flat and single-
axis tracker PV system is 3.4 years; however, by
using the two-axis tracker PV system to be 3.2 years.
The analysis of environmental influence needs to
be considered and needs to be taken into account by
knowing the amount of energy that can be generated
from the installation of the PV system. The factor of
greenhouse gasses (GHG), as mention in Ref, can be
known large emissions that can be reduced if using
photovoltaic as a source of electrical energy.
5 CONCLUSION
The technical and economic analysis of tracker
based solar power system for remoted islanded has
been presented. The potential of the energy of the
PV system can be generated 3,341 kWh/year. The
test result using three different PV structure
installations - fixed structures, single-axis tracking,
and dual-axis tracking mechanisms, shows that the
two-axis tracking system has more profitable in
terms of PV electricity production 3,931 kWh in a
year and had the lowest COE of 0,307 $/kWh. This
system requires less PV module and battery storage,
as well as lowest PV system, cost 2,579 $, and less
space needed for system installation. The analysis of
environmental influence needs to be considered for
future research in order to reduce CO
2
emission.
ACKNOWLEDGEMENTS
The authors gratefully acknowledge the assistance
rendered by DRPM KemRistek/BRIN for the
financial support under Penelitian Terapan Research
Grant 2020 (Contract No. 163/SP2H/AMD/LT/
DRPM/2020).
REFERENCES
Kepmen-ESDM-No.1567 K/21/MEM/2018. (2019).
RUPTL 2018-2027.
Syafii, A. B. Pulungan, Wati, and R. Fahreza. (2020).
Techno-Economic Analysis of Tracker Based Rooftop
PV System Installation Under Tropical Climate. Int. J.
Adv. Trends Comput. Sci. Eng., vol.9, no. 4, p. [In
Press].
Syafii and R. Nazir. (2016). Performance and energy
saving analysis of grid connected photovoltaic in West
Sumatera. Int. J. Power Electron. Drive Syst., vol.7,
no.4,
Kunaifi. (2011). Desain Pembangkit Listrik Hybrid ( Plts /
Diesel ) Untuk Meningkatkan Pelayanan Kesehatan.
vol. 10, no. 1, pp. 15–21.
L. Olatomiwa. (2016). Optimal configuration assessments
of hybrid renewable power supply for rural healthcare
facilities. Energy Reports, vol. 2, pp. 141–146.
[H. A. Kazem, H. A. S. Al-Badi, A. S. Al Busaidi, and M.
T. Chaichan. (2017). Optimum design and evaluation
of hybrid solar/wind/diesel power system for Masirah
Island. Environ. Dev. Sustain., vol. 19, no. 5, pp.
1761–1778.
H. A. Kazem, S. Q. Ali, A. H. A. Alwaeli, K. Mani, and
M. Tariq. (2013). Life-cycle cost analysis and
optimization of health clinic PV system for a rural area
in Oman. Lect. Notes Eng. Comput. Sci., vol. 2
LNECS, pp. 1052–1056.
NREL. (2020). HOMER Powering Health Tool. [Online].
Available: https://poweringhealth.homerenergy.com/.
A. Haghighat Mamaghani, S. A. Avella Escandon, B.
Najafi, A. Shirazi, and F. Rinaldi. (2016). Techno-
economic feasibility of photovoltaic, wind, diesel and
hybrid electrification systems for off-grid rural
electrification in Colombia. Renew. Energy, vol. 97,
pp. 293–305.
T. S. O. dan C. H. Thum. (2013). Net Present Value and
Payback Period for Building Integrated Photovoltaic
Projects in Malaysias. Int. J. Acad. Res. Bus. Soc. Sci.
R. G. J.Lee, B. Chang, C. Aktas. (2016). Economic
feasibility of campus-wide photovoltaic systems in
New England, Renewable Energy,” vol. 99, pp. 452–
464.
D. and F. D. K. Elieser Tarigan. (2014) .Economic
Simulation of a Grid-Connected PV System Design as
Specifically Applied to Residential in Surabaya,” in
Indonesia, The 3rd Indo-EBTKE ConEx.
Design of Tracker based PV System for Health Care Facilities in Remote Islanded
1419
