
Solar Panel Energy Modeling by using Matlab Simulink
Tjerie Pangemanan
1
, Vecky C. Poekoel
2
, Alfrets Septy Wauran
1
and Arnold Robert Rondonuwu
1
1
Electrical Engineering Department, Manado State Polytechnic, Manado, Indonesia
2
Electrical Engineering Department, Sam Ratulangi University, Manado, Indonesia
Keywords: New Renewable Energy, Sunshine, Solar Panels, Matlab Simulink.
Abstract: New and renewable energy is one of the research priorities in Indonesia and even the world today. This is to
answer the limitations and the high cost of using conventional energy sources such as petroleum for
generators. By using new and renewable energy, we can save costs and also help governments and the world
to keep the air clean from the dangers of pollution. For Indonesia we have abundant natural resources
including constant and high intensity sunlight. This encourages us as researchers to make maximum use of
one of these renewable energy sources. Solar Panel, which is the application of new and renewable energy
technology that comes from solar insulation. In its use to the community, an analysis must be carried out in
advance of the intensity of sunlight in a certain area. This is to calculate the number of solar panels that will
be used to meet the energy needed by the community. Therefore, this study aims to create a solar panel model
with input in the form of light insulation data using Matlab Simulink. So that by modeling and analyzing the
amount of energy produced by a certain type of solar panel, it can determine how many solar panels are
needed for a certain area.
1 INTRODUCTION
Renewable energy is one of the most well-known
energy problems today. There are several potential
sources of renewable energy. One of the common and
simple renewable energies is solar energy. The big
problem with the current availability of energy is the
limited conventional energy sources such as fuel.
These all energy sources have a lot of problems
because they have a finite amount of energy. It is
important to create models and analyzes based on the
availability of energy sources. Solar energy is the
most preferred renewable energy in equatorial
countries today. It depends on the production of solar
energy in a particular area to have a good solar energy
design and analysis. To have a good analysis of that,
in this paper we make a predictive model of solar
energy based on solar irradiation data.
Solar Panel, which is the application of new and
renewable energy technology that comes from solar
insulation. In its use to the community, an analysis
must be carried out in advance of the intensity of
sunlight in a certain area. This is to calculate the
number of solar panels that will be used to meet the
energy needed by the community. Therefore, this
study aims to create a solar panel model with input in
the form of light insulation data using Matlab
Simulink. So that by modeling and analyzing the
amount of energy produced by a certain type of solar
panel, it can determine how many solar panels are
needed for a certain area.
2 RESEARCH LITERATURE
Modeling of Solar Panel/Photo voltaic Energy
System:
The output of PV-arrays is DC Power and this output
can be directly used to the DC load/appliances.
Hence, if the load is AC appliances, the DC power
has to be changed into AC form using power
electronic inverters (DC/AC). In the SOPRA HAN
system, the type of load is AC appliances. Hence, the
PV-arrays are connected to the battery pack via ESI
converter (AC-DC) which is a bi-directional DC/AC
converter. There are many mathematical models
developed to describe the behavior of PV. In this
project, the model reepresents the power output of
PV. Hourly power output from PV system with an
area Apv (m2) on an average day of jth month, when
total solar radiation of IT (kW h/m2) is incident on
PV surface, so the equation 1 of the system:
1410
Pangemanan, T., Poekoel, V., Wauran, A. and Rondonuwu, A.
Solar Panel Energy Modeling by using Matlab Simulink.
DOI: 10.5220/0010966300003260
In Proceedings of the 4th International Conference on Applied Science and Technology on Engineering Science (iCAST-ES 2021), pages 1410-1414
ISBN: 978-989-758-615-6; ISSN: 2975-8246
Copyright
c
2023 by SCITEPRESS – Science and Technology Publications, Lda. Under CC license (CC BY-NC-ND 4.0)
(1)
where system efficiency ƞ is given by
and, the module efficiency ( ) is given by
(2)
Where
IT = The total solar radiation is incident on PV
surface (W/m2)
Apv = Area of a single PV-panel (m2)
ƞ = System Efficiency
ƞm = module efficiency
ƞpc = Power converter efficiency
Pf = Packing Factor
ƞr = Module reference Efficiency
β = The array efficiency temperature coefficient
Tr = The reference temperature for the cell
efficiency (
0
C)
Ta = The instantaneous ambient temperature (0C)
NOCT = Normal operating cell temperature (
0
C)
IT,NOCT= The iradiation in NOCT (W/m2)
Ta,NOCT= The ambient Temperature in NOCT (
0
C)
There are 2 types of PV Panels (SI185N and FS225)
used the system and their parameter which are used
for the calculation of powers from a PV panel can be
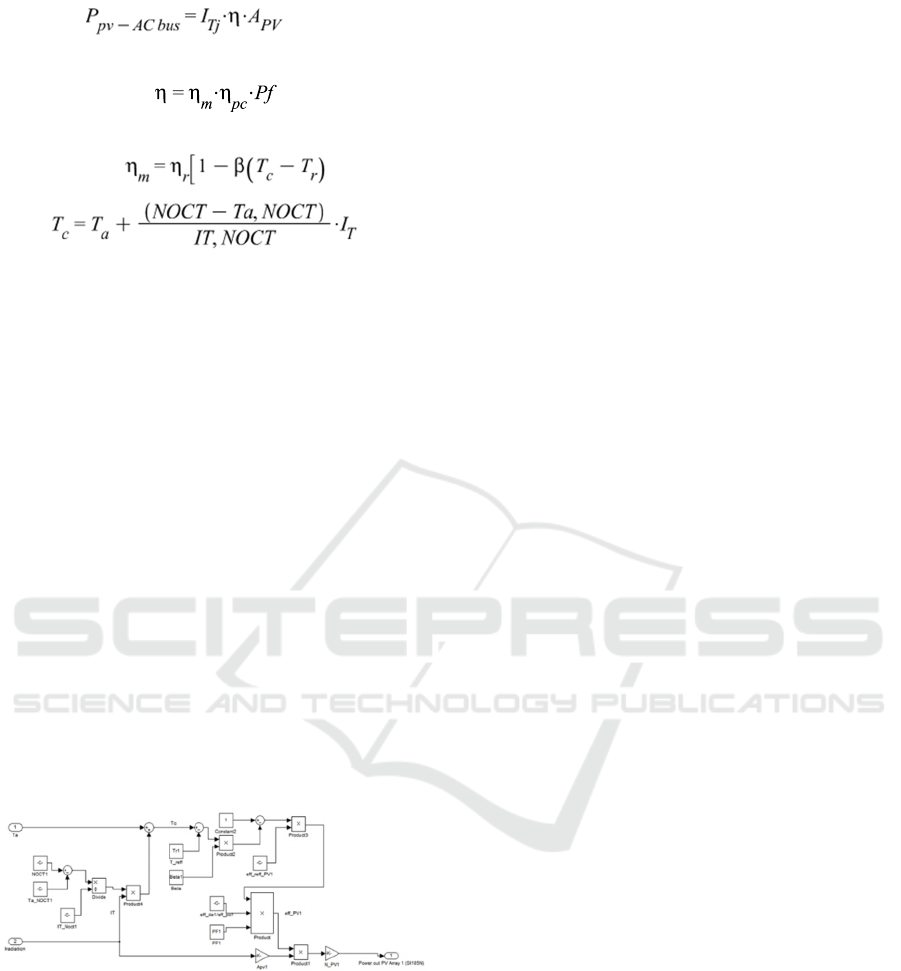
seen in the datasheets. Based on the equations, the
simulation model for the PV array is shown in fig 1
below:
Figure 1: Simulink Matlab model for output power of PV
Array SI185N.
3 RESEARCH METHODS
This study uses statistical modeling based on data on
wind speed, sunlight insulation and the amount of
electricity used. MATLAB application software is
used as a simulator to obtain the amount of power
generated by solar panels. Wind speed data is
obtained from secondary data in the form of data from
a certain area. Likewise, the type of solar panel used
is the type ES225 / SI185N. This statistical modeling
uses physical formulas based on mathematical and
physics models with the input of sunlight insulation
excel data. The variables and system equations will
be simulated in the MATLAB application software.
Solar panels are devices that consist of solar cells
that convert light into electricity. They are called solar
or sun or "sol" because the sun is the strongest light
source that can be utilized. Solar panels are often
called photovoltaic cells, photovoltaic can be
interpreted as "electric light". Solar cells rely on the
photovoltaic effect to absorb energy. In general, a
solar cell is a semi-conductor expanse that can absorb
photons from sunlight and convert it into electricity.
These solar cells are made of tiny pieces of silicon
coated with a special chemical to form the basis of the
solar cell. Solar cells generally have a minimum
thickness of 0.3 mm and are made of slices of
semiconductor material with positive and negative
poles. In a solar cell there is a connection (function)
between two thin layers made of semiconductor
material, known as "P" type semiconductors
(positive) and "N" type semiconductors (Negative),
respectively. P type silicon is a surface layer that is
made very thin so that sunlight can penetrate directly
to reach the junction.
This part P is given a ring-shaped nickel coating,
as the positive output terminal. Below the P section,
there is a type of N section coated with nickel as a
terminal. The process of converting or converting
sunlight to electricity is possible because the material
that makes up solar cells is a semiconductor. More
precisely, it consists of two types of semiconductors,
namely the n type and the p type. An n-type
semiconductor is a semiconductor that has an excess
of electrons, so that the excess is negative, (n =
negative). Meanwhile, p type semiconductors have
excess holes, so it is called p (p = positive) because of
the excess positive charge. Initially, the manufacture
of these two types of semiconductors was intended to
increase the level of conductivity or the electrical and
thermal conductivity of natural semiconductors. In
this natural semiconductor, the electrons and holes
have the same number. Excess electrons or holes can
increase the electrical and thermal conductivity of a
semicoductor. These two types of n and p
semiconductors, when put together, form a p-n
connection or p-n diode. negative output.
Solar energy is the most preferred renewable
energy in equatorial countries today. It depends on the
production of solar energy in a particular area to have
a good solar energy design and analysis. To have a
Solar Panel Energy Modeling by using Matlab Simulink
1411
good analysis of that, in this paper we make a
predictive model of solar energy based on solar
irradiation data. We are modeling solar energy using
Matlab and Simulink.
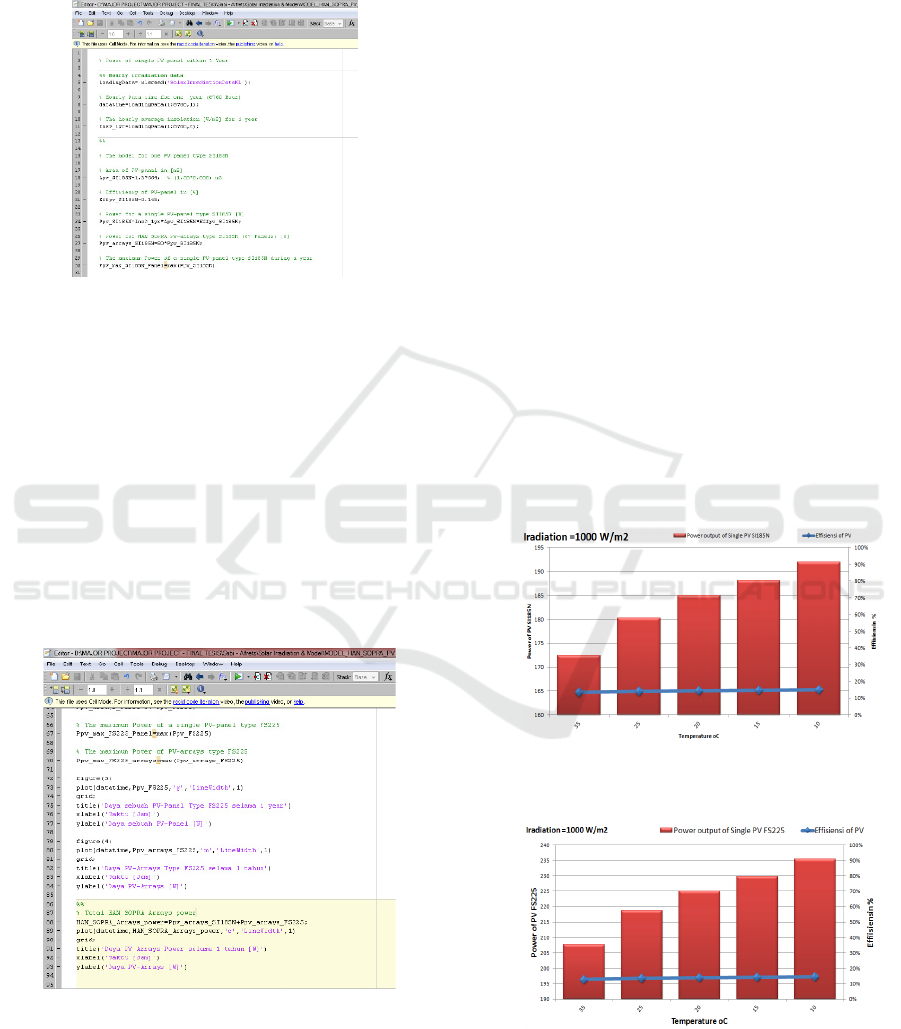
Figure 2: Solar Panel Power Matlab Script.
At the figure 2 we transform the mathematical
equations of the PV Model into matlab script. It is a
statistical model. So, we get the input from the excel
file consist of solar insulation data sheet as the input
of the model.
At the figure 3 we make a simulation based on the
time series excel input into the simulator. I will
display the power produced by the PV Array in the
system. So, the output of power produce the pattern
based on the various time series input of the solar
irradiation. All of the Matlab Script is written with the
explanation to have a good understanding for the
analiys for the power.
Figure 3: Solar Panel Energy Graph Matlab Script.
Validation of Power Output Model of Solar Panel/
Photo Voltaic
This section describes the procedure to validate or
verify the power output model of components of
SOPRA HAN. The first plan before the project will
be done, the validation will use the measurement data.
However, until this report is writen the SOPRA plant
still has some technical problem so that it is not
possible to validate with it. Hence, the verify or
validation the power output components are done by
comparing it with information or data from datasheet
components.
As explained in section 3.2.1, there are two
models of solar panel that represents two types of
Solar panel that used in SOPRA as model of PV
SI185N and FS225. To see the performance of the
model simulation of solar panel, we generate the
artificial dataset of weather input that represents the
normal operating condition of PV SI185N and FS225.
For the type PV SI185N, the max power output for a
single PV panel with the test condition with
temperature ambient (Ta) 20oC and the maximum
input iradiation 1000 W/m2 is 185 Watt with
efficiency module 14.5%. While the type PV FS225
the max power output for a single PV panel is
225Watt with efficiency module 14.5% in test
conditions with 20oC and the maximum input
iradiation 1000 W/m2. The figures below show the
simulation power output of a single PV panel for both
type of PV panel.
Figure 4: The output Power of a single of PV SI185N with
constant Iradiation 1000 W/m
2
.
Figure 5: The output Power of a single of PV FS225 with
constant Iradiation 1000 W/m
2
.
Figure 4 and Figure 5 show the simulation of PV
model with keep the iradiation in 1000 W/m2 and
iCAST-ES 2021 - International Conference on Applied Science and Technology on Engineering Science
1412
variance of temperature ambient (Ta). It can be seen
the output power of PV affected by Ta. It will affect
the temperature cell of PV which there is a decrease
of efficiency of PV if there is an increase Ta surround
the PV panel. Both of the simulation result of PV
SI185N and PV FS225 show that for the iradiation
1000 W/m2 and Ta 20
o
C, then the power output of
both PV are 185 W and 225 W respectively.
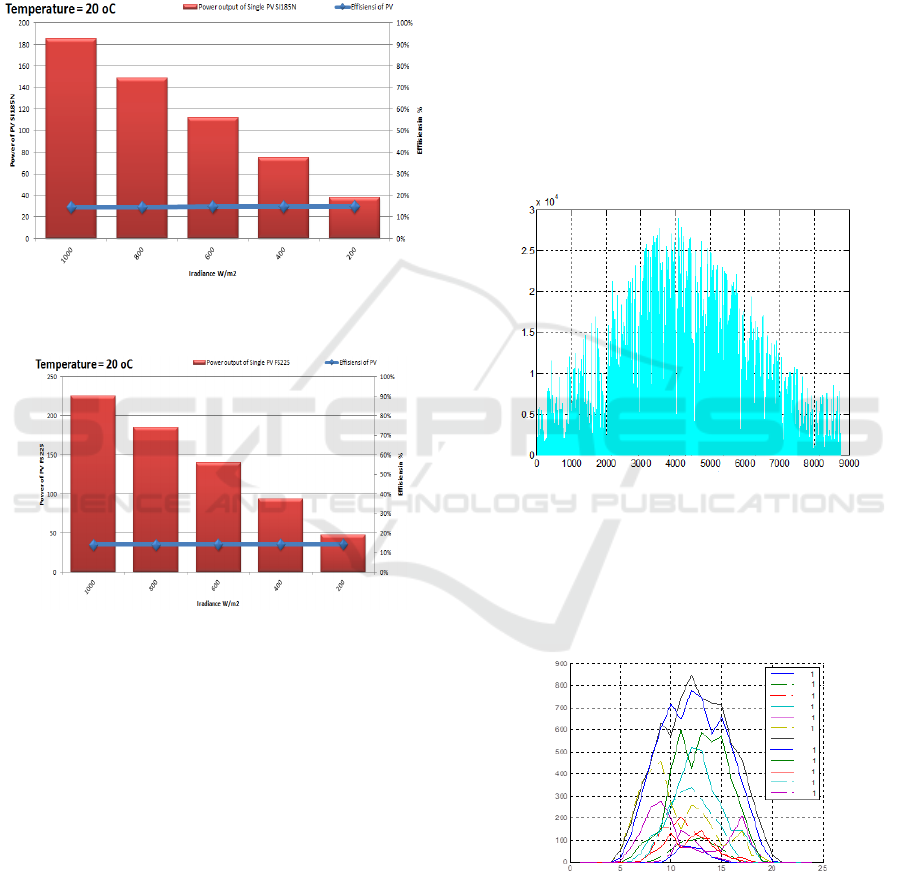
Figure 6 :The output Power of a single of PV SI185N with
constant Ta 20
o
C.
Figure 7: The output Power of a single of PV FS225 with
constant Ta 20
o
C.
Based on the figure 6 and Figure 7, it can be seen
the output power of both type PV depends on the solar
iradiation. The output of PV will decrease when the
amount of solar iradiation is become smaller. The
changing of amount of solar iradiation gives high
impact to the power output of PV. Otherwise, the
effect of temperature to the output power of PV is in
small amount.
All of the simulation result above is represented
to see the performance of the power output models of
a single PV panel of both type PV. And one of must
be considered that each region has typical weather.
For instance, in tropical region like thailand has a
high average solar iradiation and also high average
temperature where the last give decrease impact to the
power output. Otherwise the west region has the
opposite condition. The next chapter (chapter 4) will
shows the result of solar panel as a PV array and the
efect of this power output by teh real weather
condition.
4 RESULTS AND DISCUSSION
The simulation and analysis of the system design
above is to use statistical modeling based on wind
speed data, sunlight insulation and the load of a
certain area. The data is analyzed into the Matlab
application using the physical equations of the system
components. The following is modeling using the
Matlab Editor:
Figure 8: Power Produced in 1 Year.
Based on the Figure 8, the various output as the power
of PV Array in a year. It describe a maximum power
in the middle of the year. I caused by the solar
insulation has a pattern in every year.
Figure 9: Simulation of Sunlight Insulation per Month in 1
Year.
Based on the Figure 9, it describe the pattern of every
month power produced by the PV Array. I shows that
July is the maximum power produced every year.
PV Power for 1 year [W]
PV-Arrays Power (W)
Time [hour]
Solar Irradiation [W / m2]
Time [Hour]
Jan
Feb
Mar
Apr
May
Jun
Jul
Aug
Sep
Oct
Nov
Dec
Solar Panel Energy Modeling by using Matlab Simulink
1413
Because the position of the earth toward the sun
namely aphelium and perilium.
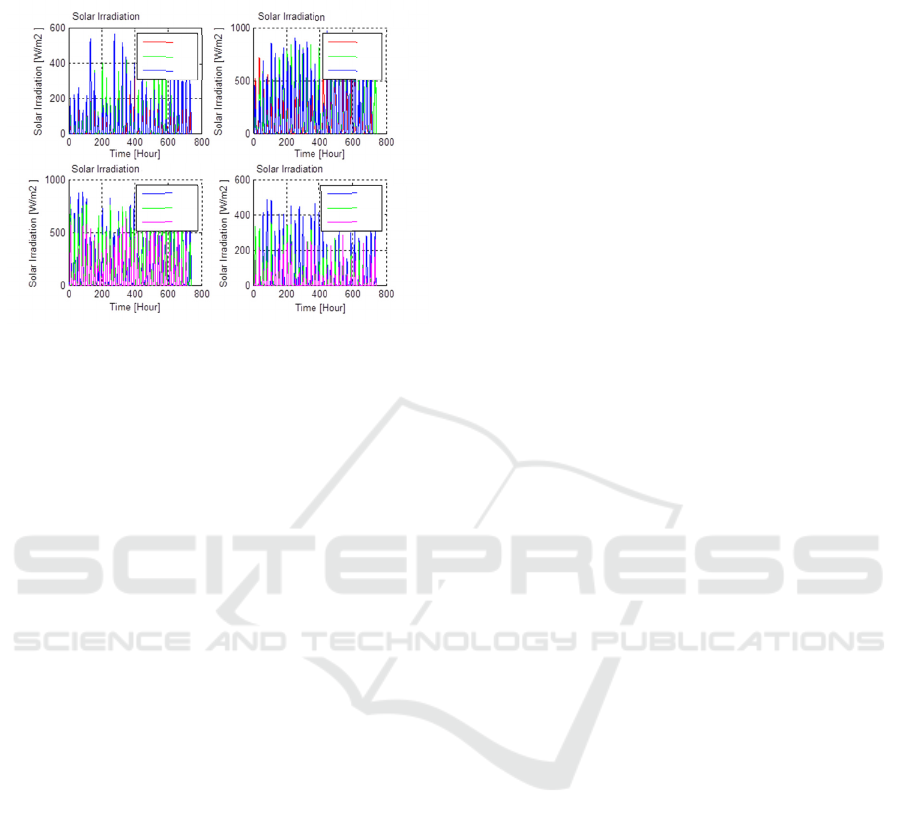
Figure 10: Irradiation in 1 Year.
From the figure 10 above, it describes the various
solar irradiation in 3 serial months. At the middle of
the year from July to September produced more
power because the distance between the sun and the
earth.
5 CONCLUSION
From these results it can be concluded that the value
of solar irradiation varies each month. This
determines the amount of energy produced by the
solar panels. The more renewable components
available, the greater the value of the power.
However, this will result in an even greater cost.
Therefore, it is necessary to find the ideal amount of
these components to produce energy as efficiently as
possible. Likewise, the graphs taken in this study look
too large, resulting in unstable power. The value of
the power generated to be efficient must be in
accordance with the amount of load and data on
sunlight insulation in the area.
REFERENCES
Anwar Ramadhan, Eri Diniardi, Sonny Mukti. (2016).
Analisis Disain Pembangkit Listrik Tenaga Surya
Kapasistas 50 WP E-Journal Teknik UNDIP.
Hardianto, H. E., Rinaldi, R. S. (2012). Perancangan
Prototype Penjejak Cahaya Matahari Pada Aplikasi
Pembangkit Listrik Tenaga Surya. Program Studi
Teknik Elektro,Universitas Bengkulu, Bengkulu.
Hasan, H. (2008). Perancangan Pembangkit Listrik Tenaga
Surya Di Pulau Saugi. Jurusan Teknik Perkapalan,
Fakultas Teknik Universitas Hasanudin, Makasar.
Lilia Trisyathia Quentara, Erma Suryani. (2017). The
Develompment of Photovaltaic Power Plant of
Electrricity Demand Fullfilment of Remote Regional of
Madura Island using Dinamic Model. Proceedings of
ISICO International Conference, Bali, Indonesia.
Siahaan, A. (2017) Implementasi Panel Surya yang
diterapkan Pada Daerah Terpencil Di Rumah Tinggal
Di Desa Teknik Elekro UMRAH.
Yuwono, B. (2005). Optimalisasi Panel Sel Surya Dengan
Menggunakan Sistem Pelacak Berbasis
Mikrokontroller AT89C51. Skripsi, Jurusan Fisika,
FakultasMatematika dan Ilmu Pengetahuan Alam
Universitas Sebelas Maret, Surakarta.
Jan-Feb-Mar
Apr-May-Jun
Jul-Aug-Sep Oct-Nov-Dec
J
an
F
A
pr
M
J
ul
A
O
ct
N
iCAST-ES 2021 - International Conference on Applied Science and Technology on Engineering Science
1414
