
Deaerator Tank Level Control using Direct Synthesis Tuning Method
Erik Tridianto, Prima Dewi Permatasari, Hendrik Elvian Gayuh Prasetya and Putri Febry Wulandari
Power Plant Engineering Electronic Engineering Polytechnic Institute of Surabaya, Surabaya, Indonesia
Keywords: Deaerator, Level, PI Controller, Feedback Feedforward, Direct Synthesis.
Abstract: The gases separation from the feedwater in the deaerator is done by heating process. When the temperature
inside the deaerator increases, the volume of the feedwater will decrease. Therefore, a level control system in
the deaerator is needed in order to maintain the stability of the boiler feedwater supply. However, to get a
good control performance, the controller tuning is required. In this study, the PI controller with feedback
feedforward structure is used. Tuning parameters are obtained by using the direct synthesis method where the
value of the proportional gain is 0.69 and the integral time is 28.95. Other than that, the feedforward tuning
parameters are obtained by the feedforward equation where the value of the feedforward gain is 0.0001, the
lead time constant is 28.95, and the lag time constant is 48.48. The controller performance is determined by
analyzing the dynamic response graph from the close loop test. Based on the ± 10% setpoint changes test
results, the IAE values are 0.000848% and 0.00059%, the maximum overshoot values are 1.52% and 1.86%,
and the settling time values are 7130 seconds and 7150 seconds. Furthermore, on the ± 10% disturbance
changes test results, the IAE values are 0.442% and 0.443%, the maximum overshoot values are 10.83% and
10.82%, and the settling time values are 6050 seconds and 6060 seconds.The abstract should summarize the
contents of the paper and should contain at least 70 and at most 200 words. It should be set in 9-point font
size, justified and should have a hanging indent of 2-centimenter. There should be a space before of 12-point
and after of 30-point.
1 INTRODUCTION
Deaerator is a mechanical device used in a power
plant to remove gases such as O2 and CO2 which are
dissolved in condensate water. Besides, the deaerator
also functions as a preheater boiler feedwater. The O2
and CO2 gases separation is carried out to prevent the
formation of oxides and carbonic acid compounds
that can contribute to the boiler pipes corrosion, so it
helps to reduce the operation and maintenance costs.
Deaerator works based on the nature of oxygen. As
an increase in the temperature, the solubility in the
water decreases. In that condition, the volume of
water decreases, so a water level control in the
deaerator is needed to maintain the supply of boiler
feedwater and optimize the gases release process. A
350MW coal fired power plant in Indonesia uses a PI
controller with a feedback feedforward control loop
as a level control in the deaerator. This control loop is
known to be more able to adjust load changes and
disturbances that affect the dynamics of the system
when compared to the feedback control loop. This is
because a closed-loop system that only has a feedback
structure may not necessarily have stability.
The PI controller requires an adjustment of the
gain parameters namely proportional gain ("K" _"p"
) and integral gain ("K" _"I" ). These parameters are
determined by the tuning process. There are several
tuning methods to get the PID controller parameters.
With the right tuning method, the performance of the
control system can be improved. Otherwise, improper
tuning methods will only worsen the performance of
the control system. The performance of the control
system will be known from the system response
specifications, including steady state, maximum
overshoot, settling time, peak time, and rise time.
Because this power plant is still using trial and
error as a tuning method, on this occasion tuning will
be done using the Direct Synthesis (DS) method by
modeling the system using Aspen HYSYS software.
2 PI CONTROLLER
PI controller is a form of feedback control that has
Tridianto, E., Permatasari, P., Prasetya, H. and Wulandari, P.
Deaerator Tank Level Control using Direct Synthesis Tuning Method.
DOI: 10.5220/0010965800003260
In Proceedings of the 4th International Conference on Applied Science and Technology on Engineering Science (iCAST-ES 2021), pages 1381-1386
ISBN: 978-989-758-615-6; ISSN: 2975-8246
Copyright
c
2023 by SCITEPRESS – Science and Technology Publications, Lda. Under CC license (CC BY-NC-ND 4.0)
1381
simple and easy to understand algorithm, it is often
applied to many plants in the industry. In a PI control
includes Proportional (P) and integral (I) as a basic
characters or parameters. Proportional control action
has the advantages of an advance and stable control
rise time while integral control action has the
advantage of minimizing errors. These parameters are
used to form a control by determining the transfer
function equation which is a representation of a
mathematical comparison between input and output
in a control system. The PI controller transfer
function in the Laplace domain is mentioned as
follows.
G
PI
s
= K
p
1 +
1
τ
if
s
(1)
G
PI
: PI controller gain
K
p
: proportional gain
τ
: integral time constant
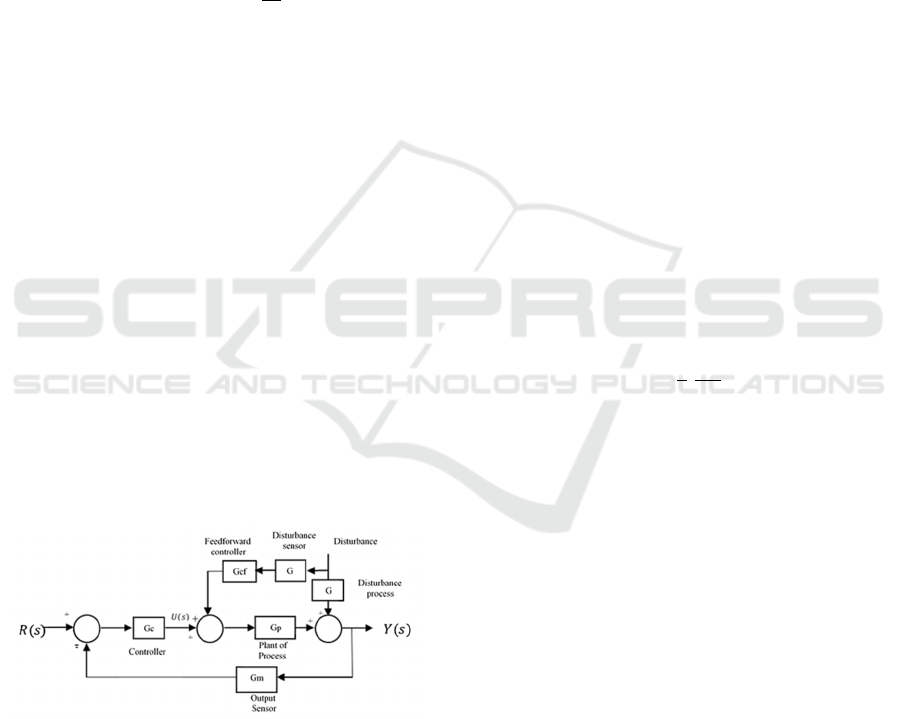
3 FEEDBACK FEEDFORWARD
CONTROL LOOP
A feedback control system is the process of
measuring the output of a system compared to a
certain standard. The feedback control loop works by
measuring the process variable, comparing it to the
desired value (setpoint), and the difference between
the two (error) is used as a manipulated variable to
reduce the difference. While a feedforward control
system detects the disturbance to anticipate or correct
the system before the output (process variable) got
affected by the disturbance. In general, a feedforward
controller cannot be used alone. The feedback
feedforward control system is shown by Figure 1.
Figure 1: Block Diagram of Feedback Feedforward Control.
Deaerator level control system aims to maintain the
level of boiler feedwater in the deaerator remains
stable around the setpoint value. Deaerator level
control system using feedback feedforward control
loop includes three measurement input values (three-
element:
a. Deaerator level
b. Boiler feedwater
c. Condensate water
The boiler feedwater and condensate water elements
act as feedforward control to prevent the rising
feedwater level in the deaerator. The feedforward
control will reduce or eliminate the effect of the
disturbance in the system, while the feedback control
is a simple close loop system that responds to changes
in the setpoint. A feedback feedforward control gives
a flexibility to the control instruments in determining
the required control action. Besides, this method also
makes the actuator work effortless.
4 DIRECT SYNTHESIS TUNING
The direct synthesis method is used to determine the
parameters of PI controllers. The method gives
significant load disturbance rejection performance.
This method can be used for the wide variety control
processes, including the delay time with a first-order
system, a second-order system, an integrator system,
and a non-minimum phase system. DS-based
controller can be tuned in continuous or discrete time,
avoid ringing, eliminate offset, and provide a high
level of performance for set-point changes. The direct
synthesis method has a simple equation for the
controller tuning as shown in equation (2) and (3).
K
p
=
1
K
τ
τc+θ
(2)
τ
i
τ
(3)
τ : process time constant
K: static process gain
θ : dead time
5 PROCESS MODELING
The first step before simulating a level control is by
modeling the behavior of the operating unit deaerator.
Aspen HYSYS software is used as a media for
modeling and simulating the control system.
Steady-state modeling is the initial step of the
simulation before adding control. Modeling begins
with the selection of deaerator as an operating unit
and placement of input and output streams to regulate
system connectivity. The process model is obtained
by the actual plant conditions, P&ID and operational
data required. So that the modeling is shown in Figure
2.
iCAST-ES 2021 - International Conference on Applied Science and Technology on Engineering Science
1382
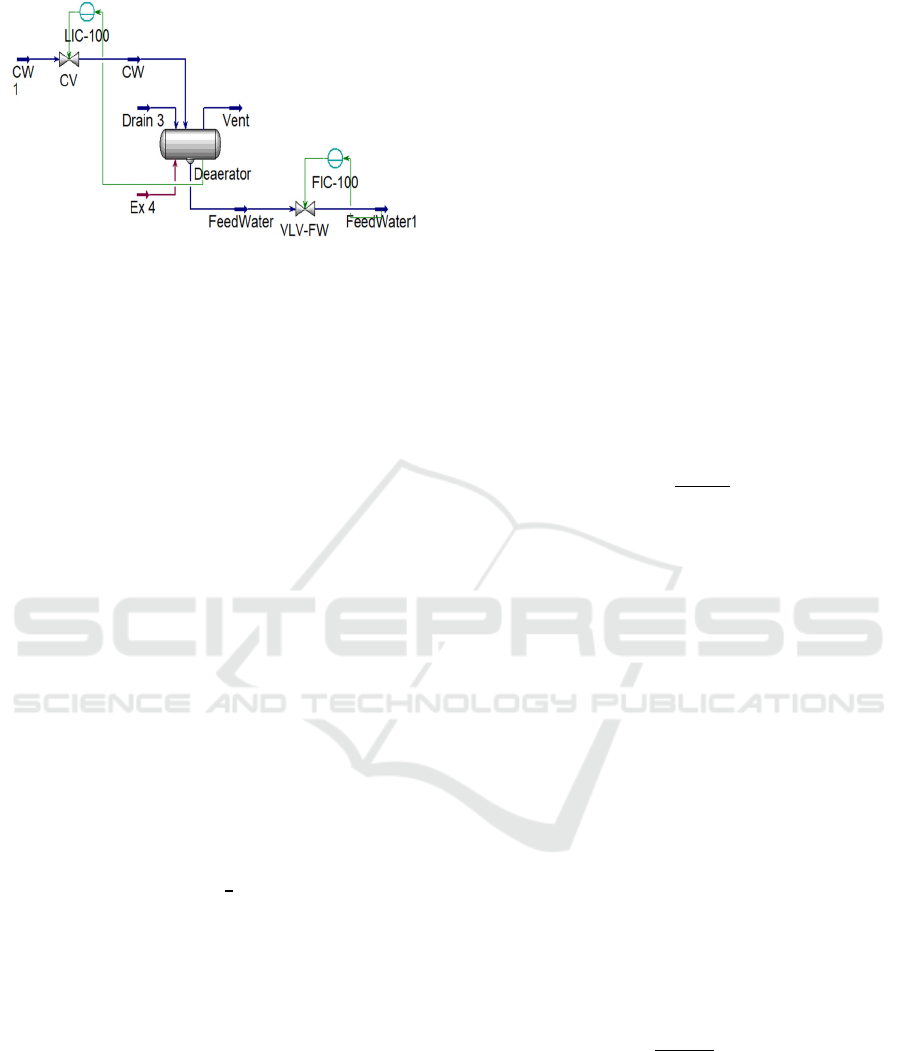
Figure 2: Deaerator Level Control P&ID.
6 CONTROL SYSTEM
SIMULATION
Simulation of the control system is necessary to
determine the tuning parameters and the performance
of level control, by simulating an open loop and close
loop system.
6.1 Open Loop
The control system is simulated at a certain time to
represent the achievement of steady conditions after
changes of manipulated variable occur. An analysis is
performed by determining the parameters of FOPDT
(First Orde Plus Dead Time) approach K, τ, and θ
after an open-loop response graph from the control
system obtained. FOPDT is a mathematical model for
obtaining a transfer function of a process which is
then used to determine the PI tuning parameters "K"
_"p" and "τ" _"i" (Ariyanto, 2011). To obtain the
transfer function, it is approximated by the PRC
equation of Cecil L. Smith shown in the following
equation (4), (5), and (6) (Smith and Armando, 1985)
K =
∆
δ
(4)
τ = 1,5 (t
63%
- t
28%
) (5)
θ = t
63%
- τ (6)
K : gain steady state
∆ : output variable changes
δ : input variable changes
t63% : response time to reach 63% of the output
variable
t 28%: response time to reach 28% of the output
variable
τ : time constant
Determination of K_p and τ_i using the Direct
Synthesis tuning method can be done through the
following steps.
a. Modelling the system to obtain the
characteristics of a process
b. Create an open-loop system response by
changing the controller mode to manual. And
change the value of the controller output of ± 5%
of the specified value
c. Analyze the open-loop response graph to get the
FOPDT parameters in the form of K, τ, and "θ"
value
d. Determine the Direct Synthesis tuning
parameters in the form of value Kp and τ if .
Because of the feedforward structure in the feedback
feedforward control loop, so that feedforward tuning
required. Determination of feedforward tuning
parameters in the form of value where K
f
, τ
1
, and τ
2
is shown in equation (7), (8), and (9).
K
f
=
K
d
K
t
K
v
K
p
(7)
τ
1
= τ
p
(8)
τ
2
= τ
d
(9)
K
f
: feedforward gain
τ
1
: lead time constant
τ
2
: lag time constant
6.2 Close Loop
The control system is simulated to get the control
performance from the response graph towards
setpoint and disturbance changes by analyzing three
parameters below (Ogata, 2010).
a. Settling Time
The settling time (t
) is the time required for the
step response to enter the criteria area of 2% or
5% of the final value.
b. Maximum Overshoot
Maximum overshoot (MO is the peak value of
the response curve that can be determined by
following equation.
%MO =
c
t
P
-c(∞)
c(∞)
x 100% (10)
c. Integral Absolute Error
Integral Absolute Error (IAE) is the sum of the
error value of the response curve by conditioning
the error to an absolute value. IAE can be
determined by following equation (Singh, 2009).
IAE =
|
SP
t
- CV(t)
|
dt
∞
0
(11)
Deaerator Tank Level Control using Direct Synthesis Tuning Method
1383
7 RESULTS AND DISCUSSION
CONTROL SYSTEM
SIMULATION
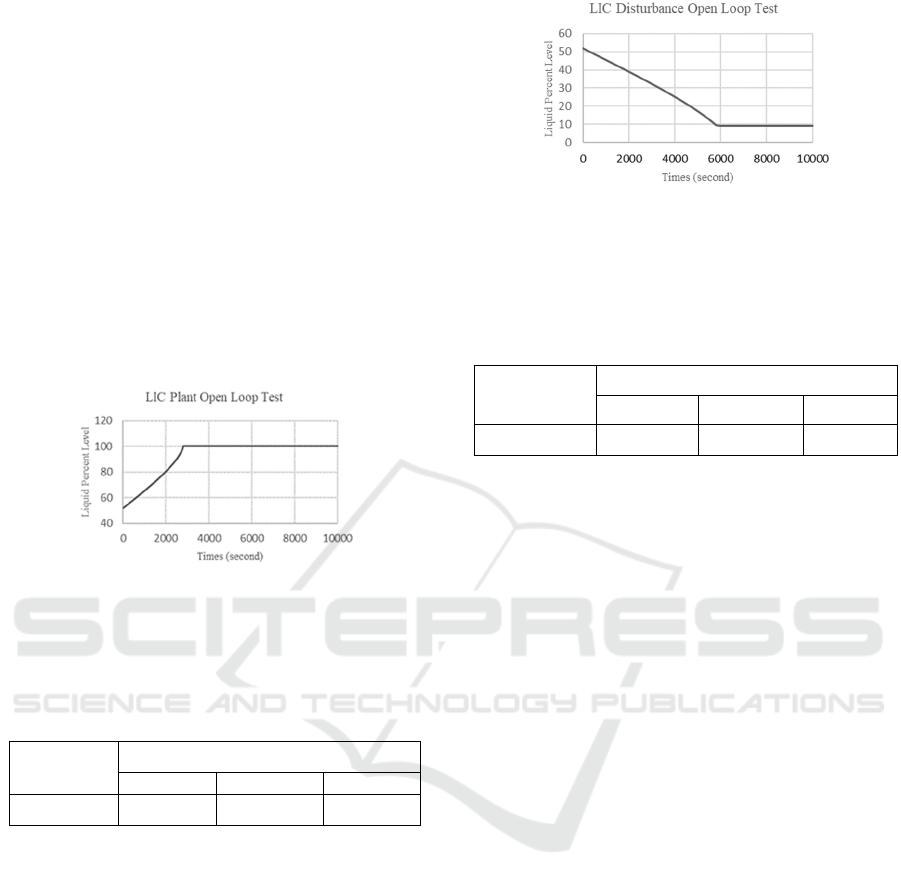
7.1 Open Loop Test based on Control
Valve Changes
Open-loop simulation aims to find the transfer
function of the process. Response graph is obtained
by changing 5% of the valve position in 1020 minutes
duration shown in Fig. 3. The controller involved is
the level indicator control (LIC) as a feedback
feedforward control. Where liquid percent level is a
process variable and inlet condensate water valve is a
controller output which operates as a control valve.
Figure 3: Open Loop Response Graph to 5% CV Changes.
Furthermore, with an approach through equation (2),
(3), and (4), the value of FOPDT parameters are
shown in table 1.
Table 1: FOPDT Plant Parameters.
Instrument
Parameter
K
τ (min) θ (min)
LIC 10 28.95 0
Feedback tuning parameters are obtained through
equation (5) and (6) where K
p
is 0.69 and τ
I
is 28.95.
7.2 Open Loop Test based on
Disturbance Changes
FOPDT parameters from disturbance changes are
needed to determine the feedforward tuning
parameters. Response graph is obtained by changing
5% of the outlet feedwater flowrate in 1020 minutes
duration shown in Fig. 4. The changes made from FIC
as an additional instrument for disturbance utility
which controls the value of the disturbance.
Figure 4: Open Loop Response Graph to 5% DV Changes.
Furthermore, with an approach through equation (2),
(3), and (4), the value of FOPDT parameters are
shown in table 2.
Table 2: FOPDT Disturbance Parameters.
Instrument
Parameter
K τ (min) θ (min)
LIC 0.0007 48.48 0
Feedforward tuning parameters are obtained through
equation (7), (8), and (9) where K
f
is 0.0001, τ
1
is
28.95, and τ
2
is 48.48.
7.3 Close Loop Test based on Setpoint
Changes
Close loop simulation aims to specify the control
performance based on setpoint changes refers to the
use of known tuning parameters. Analysis of LIC
feedback feedforward control responses based on
±10% setpoint changes are respectively shown in
Figure 5 and Figure 6.
Based on Figure 5 and Figure 6 it can be seen that
the feedback feedforward level control can respond to
the setpoint changes. The process variable value
tracks the setpoint changes which start at 50% to 55%
and 45% level. In achieving setpoint value, the
control process took a certain time. The performance
of feedback feedforward level control with Direct
Synthesis tuning can be assessed by calculating
settling time, maximum overshoot (MO), and integral
absolute error (IAE). These three parameters of
quantitative response analysis are shown in table 3.
iCAST-ES 2021 - International Conference on Applied Science and Technology on Engineering Science
1384
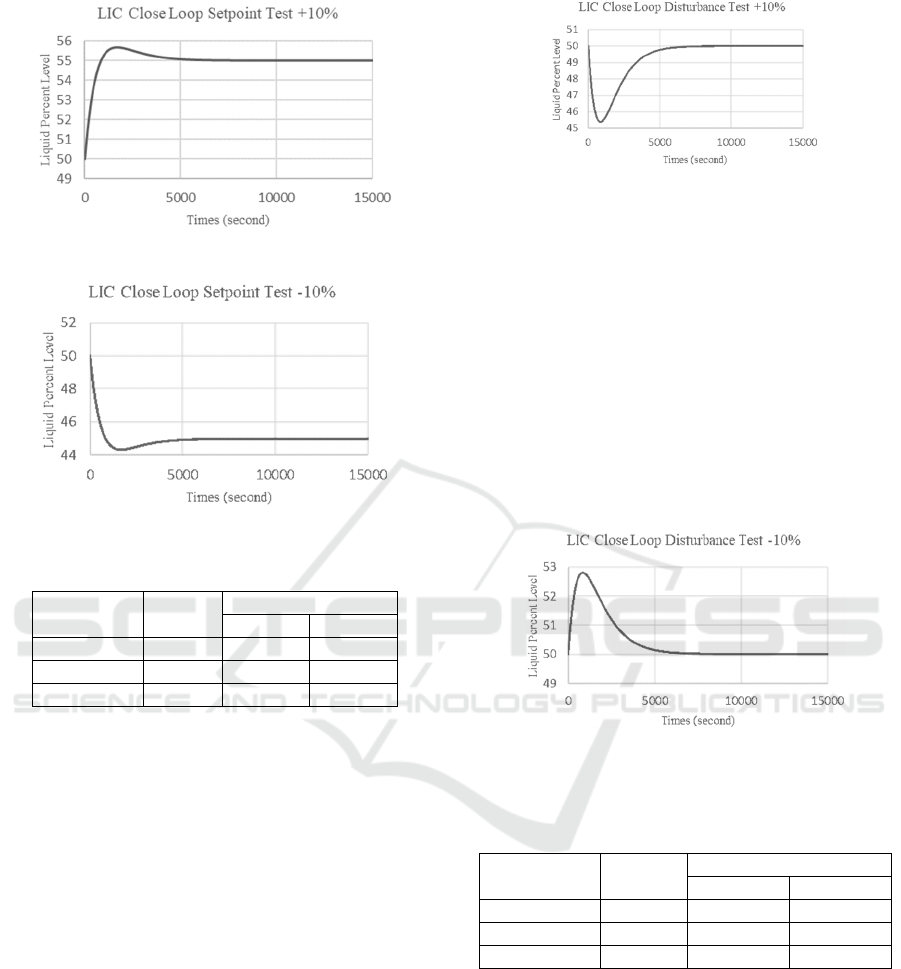
Figure 5: Close Loop Response Graph to +10% SP Changes.
Figure 6: Close Loop Response Graph to -10% Changes.
Table 3: Close Loop Test based on ±10% Setpoint changes.
Parameters Units
Setpoint Changes
+10% -10%
t
seconds 7130 7150
MO % 1.52 1.86
IAE % 0.000848 0.000591
Based on table 3. the feedback feedforward level
control had a certain time to achieve the given
setpoint. In this close loop test the time required for a
process variable to reach the setpoint is nearly close,
respectively 7130 seconds and 7150 seconds on
+10% and -10% setpoint changes. It also showed that
the control response remains stable based on a low
maximum overshoot value.
7.4 Close Loop Test based on
Disturbance Changes
Close loop simulation aims to specify the control
performance based on disturbance changes refers to
the use of known tuning parameters. Analysis of LIC
feedback feedforward control responses based on
10% disturbance changes are respectively shown in
Figure 7 and Figure 8.
Figure 7: Close Loop Response Graph to +10% DV
changes.
Based on Fig. 7 and Fig. 8 it can be seen that the
feedback feedforward level control can respond to the
disturbance changes. The process variable value
tracks the level setpoint while the disturbance was
given to the control process. In achieving setpoint
value, the control process took a certain time. The
performance of feedback feedforward level control
with Direct Synthesis tuning can be assessed by
calculating settling time, maximum overshoot (MO),
and integral absolute error (IAE). These three
parameters of quantitative response analysis are
shown in table 4.
Figure 8: Close Loop Response Graph to -10% DV
Changes.
Table 4: Close Loop Test based on ±10% Disturbance
changes.
Parameters Units
Disturbance Changes
+10% -10%
t
seconds 6050 6060
MO % 10.82 10.82
IAE % 0.442 0.443
Based on table 4. the feedback feedforward level
control had a high maximum overshoot value in
overcoming the given disturbance. When the outlet
feedwater flow rate increased, the level value will
immediately drop. However, the controller returns
the process variable value to the desired setpoint. In
this close loop test the time required for the process
variable to reach the setpoint is nearly close,
respectively 6050 seconds and 6060 seconds on
+10% and -10% disturbance changes.
Deaerator Tank Level Control using Direct Synthesis Tuning Method
1385

8 CONCLUSIONS
After analyzing the deaerator level control response,
it can be concluded that using the direct synthesis as
a tuning method for the feedback feedforward control
can produce a control that able to track the setpoint
changes and handle the disturbance in the system.
ACKNOWLEDGEMENTS
The author's grateful to the support of Power Plant
Engineering of Electronic Engineering Polytechnic
Institute of Surabaya.
REFERENCES
G. Sathiyamoorthy. (2015). Deaerator Storage Tank Level
& Deaerator Pressure Control Using Soft Computing.
IJSART.
Ariyanto (2011). Design of Deaerator Level Control
System Using Fuzzy Gain Scheduling-PI at PT
Petrowidada. ITS Library, Surabaya.
Llorente R.M. (2020). Practical Control of Electric
Machines: Model-based Design and Simulation.
Springer.
B. Bequette. (2003). Process control modeling, design and
simulation. PHI, New Delhi.
A. Seshagiri Rao, V. S. Rao, and M. Chidambaram. (2009).
Direct synthesis-based controller design for integrating
processes with time delay. Journal of the Franklin
Institute.
D. E. Seborg. (2004). Process Dynamics and Control. USA.
John Wiley Sons. Inc.
Dan Chen, D. E. Seborg. (2002). PI/PID Controller Design
Based on Direct Synthesis and Disturbance Rejection.
Ind. Eng. Chem. Res,
Smith C A, Armando C B. (1985). Principles and Practice
of Automatic Process Control John Wiley & Sons Inc.
Ogata, Katsuhiko. (2010). Modern Control Engineering,
Fifth Edition, pp. 169-170.
S. K. Singh. (2009). Process Control: Concepts Dynamics
and Applications. PHI, New Delhi.
iCAST-ES 2021 - International Conference on Applied Science and Technology on Engineering Science
1386
