
Assessment of Positional Error CNC Machine Tools using
Laser Interferometer
Herman Budi Harja
a
and Addonis Candra
b
Manufacturing Department, Politeknik Manufaktur Bandung, Jl. Kanayakan No.21 Dago, Bandung, West Java, Indonesia
Keywords: Positional Error, Measurement Standard, Accuracy, Repeatability, Error Compensation.
Abstract: The geometric error of machine tools significantly contributes to the machined workpiece’s dimensional and
geometric error. This study aims to show a method for assessment of the positional error of the machine axes
movement. It is worthwhile since its information outcome could be a reference for obtaining error
compensation parameters of machine tools and G-code program correction nowadays. Data collection of
positional error was conducted by measuring method using a laser interferometer based on ISO 230-2 as a
measurement standard of positioning accuracy and repeatability. The positional error parameters are analysed
for getting mean deviation, systematic position deviation, repeatability, and accuracy. Then, machine tools’
assessment status is obtained by comparing measurement results with ISO 10791-4 tolerance standard. The
machine object tested of this study are CNC machine tools with a measurement distance travelled of X, Y and
Z-axis are about 500 mm, 200 mm and 350 mm. Finally, the linear positional errors on each machine tools
axis could be identified. The X-axis and Z-axis of machine tool exceed the tolerance range of the standard
systematic position deviation, because the systematic position deviation value occurred on X, Y and Z axes
are approximately 31.8 μm, 12.9 μm and 33.3 μm. The X and Z machine axes are out of tolerance in accuracy
standard because the accuracy value in X, Y and Z axes are 34.2 μm, 14.4 μm, and 35.8 μm. And the X, Y
and Z axes are still within tolerance in repeatability standards because the X, Y and Z axes repeatability values
are 4.2 μm, 33.3 μm and 6.3 μm. The compensation error values of the X and Z axes have been generated
based on their linear position errors. It will be further utilized as the main data for setting back error
compensation parameters on CNC controller and developing G-Code correction modelling.
1 INTRODUCTION
More than 50% of total machining errors are caused
by error sources of machine tools, such as geometric
errors, servo errors, and thermal errors (Bryan, 1990)
(Weck et al., 1995) (Chen et al., 1997). Geometric
error is the greatest effect on machine tools’ accuracy
and precision (Chen et al., 1997) (Schwenke et al.,
2008) (Tian et al., 2014). Hence, the machine tools’
geometric errors significantly contribute to the
dimensional and geometric errors of machined
workpieces.
The geometric error of machine tools could be
reduced in two ways, (i) design and manufacture
precision machine tools, and (ii)set the compensation
error parameters (Tian et al., 2014). The first way
necessitated highly cost exponentially, but the second
a
https://orcid.org/0000-0001-9746-2647
b
https://orcid.org/0000-0002-3372-4318
one was highly cost-effective to improve the
geometric error of machine tools (Yang et al., 2004).
The second one is performed by assessment and
setting the error compensation parameters of machine
tools.
Figure 1 shows that there are 6 components of
geometric error in a single axis. Those are positional
error δ
x
(X), two straightness error motions, which are
called horizontal straightness error motion δ
z
(X) and
vertical straightness error motion ε
y
(X), and three
angular error motions that consist of roll error motion
and two tilt error motions. Two tilt error motions are
yaw and pitch error motion (Okafor and Ertekin,
2000).
1352
Harja, H. and Candra, A.
Assessment of Positional Error CNC Machine Tools using Laser Interferometer.
DOI: 10.5220/0010965300003260
In Proceedings of the 4th International Conference on Applied Science and Technology on Engineering Science (iCAST-ES 2021), pages 1352-1358
ISBN: 978-989-758-615-6; ISSN: 2975-8246
Copyright
c
2023 by SCITEPRESS – Science and Technology Publications, Lda. Under CC license (CC BY-NC-ND 4.0)
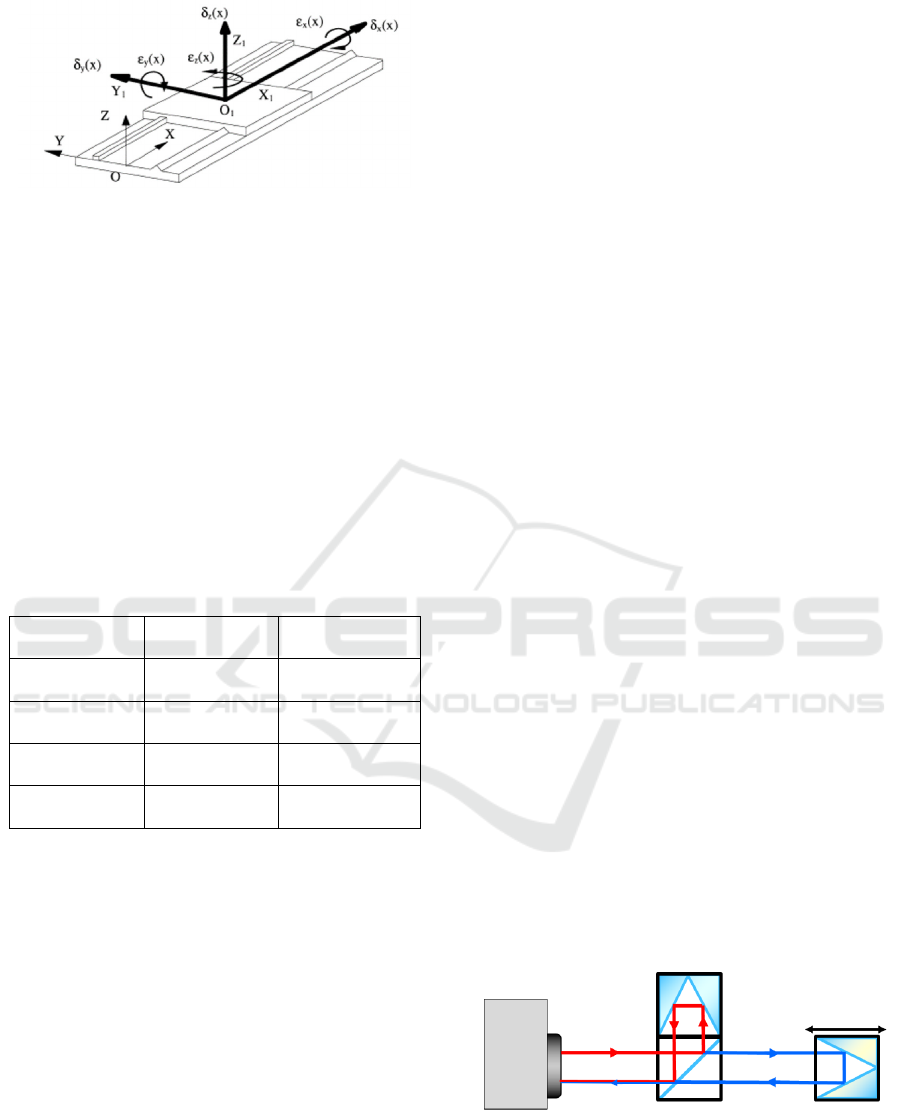
Figure 1: Component geometric error in single axis (Okafor
and Ertekin, 2000).
The geometric error in three-axis machine tools
has 21 geometric error components, which are three
linear positional errors, six straightness error motions,
nine angular error motions, and squareness error.
Twenty-one geometric error types in three-axis
machine tools are shown in Table 1. There are (i)
linear straightness horizontal and vertical error of
each axis, (ii) linear positional error of each axis, (iii)
pitch angular error of each axis, (iv)yaw angular error
of each axis, (v)roll angular error of each axis, (vi)
and squareness error between XY axis, XZ axis and
YZ axis.
Table 1: Components of geometric error in three-axis
machine tools (Okafor and Ertekin, 2000).
Geometric error
component
Linear position
erro
r
Angular error
(roll, pitch, yaw)
X-axis
δ
x
(X), δ
y
(X),
δ
z
(X)
ε
x
(X), ε
x
(X),
ε
x
(X)
Y-axis
δ
x
(Y), δ
y
(Y),
δ
z
(
Y
)
ε
x
(Y), ε
x
(Y),
ε
x
(
Y
)
Z-axis
δ
x
(Z), δ
y
(Z),
δ
z
(
Z
)
ε
x
(Z), ε
x
(Z),
ε
x
(
Z
)
Squareness
erro
r
φ
xy,
φ
xz,
φ
zy,
This paper focuses on the assessment of the linear
positional error of three-axis CNC machine tools.
Measurement and analyzing data were performed
based on ISO standards. Measuring on machine
object tested was conducted using a calibrated laser
interferometer.
The research has the aim to show an assessment
method for measuring the linear position error of
machine tools axes. Its outcome could be used for
determining the compensation error value of the
machine parameter.
2 MATERIAL AND METHOD
2.1 Material
The machine object tested of this study is CNC
machine tools with measurement travel of X, Y and
Z-axis are about 500 mm, 200 mm and 350 mm.
There are differences between axis travel and
measurement travel. Axis travel on the machine axis
is maximum travel in a linear movement where the
moving parts can be move under controller, but the
measured travel is part of the selected axis travel and
is used to capture data. Hence the first and the last
target positions can be approached in both directions.
2.2 Method
There are several stages for assessment of positional
error of machine tools: measuring the geometric error
data, Analyzing measuring data results, evaluating
the assessment status of tested machine tools by
comparing the information value of positional error
parameters with ISO standard tolerance of geometric
error and calculating compensation error value.
Data collection of positional error was conducted
by measuring methods based on ISO 230-2 as a
measurement standard of positioning accuracy and
repeatability. Its measurement uses a laser
interferometer (International Organization for
Standardization, 2006). Environment condition and
machine tools thermal are two factors that should be
considered in its measurement operation.
Environmental condition factors are like air
temperature, air pressure, and relative humidity
(Wang et al., 2002). Hence laser interferometer
system should be equipped by the environmental
compensation unit. Its unit has three functions:
(i)measuring environmental conditions,
(ii)compensates the wavelength of the laser beam,
which is influenced by these distraction variations,
and (iii)virtually eliminating any measurement errors.
Figure 2: Configuration of positional error measurement
using laser interferometer (Renishaw, 2008).
Assessment of Positional Error CNC Machine Tools using Laser Interferometer
1353

Figure 3: Set up the laser interferometer equipment for
linear positional error measurement (Renishaw, 2008).
The configuration of linear positional error
measurement was shown in Figure 2. Figure 3 shows
the set up for linear positional error measurement
using laser interferometer equipment. Linear
positional error value was obtained by comparing a
target position data and actual position data. A target
position is displayed on the axis read-out of machine
tools, and the laser measures the factual position as an
actual position. A retroreflector is mounted to a beam
splitter in linear measurement. It is to form a fixed-
length reference arm of an interferometer. Another
retroreflector is moved relative to the beam splitter to
form a variable-length measurement arm. Then, the
laser is used to track any changes in separation
between the measurement arm retroreflector and a
beam splitter (Renishaw, 2008).
The stages of testing or measuring the linear
positional error, and calculation stages for obtaining
the positioning accuracy value of CNC machine tools
axes and also its reliability value has been explained
clearly on ISO 230-2. Measurement operation
directly measures to each axis on the machine tools.
ISO 230-2 explains detailly about (i)definition and
symbols which is used in measurements such as axis
travel, measurement travel, positional deviation,
mean positional deviation, systemic positional
deviation, repeatability, and accuracy, (ii)testing
condition for the environment and tested machine
tools, (iii)testing program guidance that focuses
describe target measurement, measurement setup,
(iv)evaluation of measurement result and result
presentation. ISO 230-2 states information about the
minimum requirement of total position target and
complete capture data of each target position. The
axis travel up to 2000 mm, the minimum total
position target should be selected and measured five
target positions per meter. Each target position in
positive and negative directions should be fully
measured five times (International Organization for
Standardization, 2006).
Measurement can be made unidirectional or bi-
directional. Unidirectional measurement is series
measuring of target positions that are always done in
the same direction along the axis. The symbol ↑
signifies a parameter of measurement direction in a
positive direction and ↓ one in the negative direction.
e.g., 𝑋
↑ or 𝑋
↓. Bidirectional measurement is a
series of measurements that approach the target
position, taken in either direction along the axis.
Measurement results are analyzed to estimate
linear positional error parameters value such as
positional deviation, mean deviation, systematic
position deviation, repeatability, and accuracy.
Positional deviation [𝑋
] is calculated result from
subtracting actual position value [ 𝑃
] by target
position value [𝑃
].
𝑋
= 𝑃
−𝑃
(1
)
Target position [ 𝑃
] is the coordinate of the
programmed position and must be reached, where i=
1 to m. Actual position [𝑃
] with i= 1 to m and j= 1
to n. It is the measured position reached by the
moving part on the jth approach to the ith target
position.
The calculation can be continued for obtaining
mean unidirectional ( 𝑋
↑and 𝑋
↓
) or mean
bidirectional 𝑋
.
𝑥
↑=
1
𝑛
𝑋𝑖𝑗 ↑
(2
)
𝑥
↓=
1
𝑛
𝑋𝑖𝑗 ↓
(3
)
Mean unidirectional positional deviation on a
position xi↑ (positive direction) or xi↓ (negative
direction) is an arithmetic mean of the positional
deviations obtained by a series of n approaches the
position Pi in one direction.
𝑥
=
𝑥
↑ + 𝑥
↓
2
(4
)
Mean bidirectional positional deviation on a
position is an arithmetic mean of the mean
unidirectional positional deviations xi↑ (positive
direction) and xi↓ (negative direction). It is obtained
from position Pi in the two measurement directions.
Systematic positional deviation of an axis (E, E↑
, E ↓ ) is the difference between the algebraic
iCAST-ES 2021 - International Conference on Applied Science and Technology on Engineering Science
1354

maximum and minimum of the mean unidirectional
positional deviations in an approach direction
(positive xi ↑ or negative xi ↓direction) at any
position Pi along the axis.
E ↑ =max.
𝑥
↑
]
−min.
𝑥
↑
]
(5)
E ↓=max.
𝑥
↑
]
−min.
𝑥
↑
]
(6)
E=max.
[
𝑥
↑; 𝑥
↓
]
−min.
[
𝑥
↑; 𝑥
↓
]
(7)
The symbols E ↑ and E ↓ are used in
unidirectional measurement, and the E one is used in
the bidirectional measurement.
The mean bidirectional position deviation of an
axis (M) is the difference between the algebraic
maximum and minimum of the average bidirectional
positional deviations x
i
at any position P
i
along the
axis.
M=max.
[
𝑥
]
−min.
[
𝑥
]
(8)
Reversal value at a position (Bi) is the difference
between the average unidirectional positional
deviations obtained from the two approach directions
at a position Pi.
Bi = 𝑥
↑−𝑥
↓ (9)
The reversal value of an axis (B) is the maximum
of the absolute reversal values ⎜Bi⎜ at all target
positions along the axis.
𝐵= 𝑚𝑎𝑥.
[
|
𝐵𝑖
|
]
(10)
The mean reversal value of an axis ( B
) is
arithmetic average of the reversal values B
i at all
target positions along the axis.
𝐵
=
1
𝑚
𝐵𝑖
(11)
si↑ or si↓ is the repeatability estimator of
unidirectional axis positioning at a specific position.
It is an estimator of the standard uncertainty of the
positional deviations obtained by a series of n
unidirectional methods on a position Pi.
𝑆𝑖↑ =
1
𝑛−1
(
𝑋𝑖𝑗↑−𝑥
↑)
(12)
𝑆𝑖↑ =
1
𝑛−1
(
𝑋𝑖𝑗↑−𝑥
↑)
(13)
𝑆𝑖↓ =
1
𝑛−1
(
𝑋𝑖𝑗↓−𝑥
↓)
(14
)
Unidirectional positioning repeatability of the Ri↑
or Ri↓ position is a range of the unidirectional axis
positioning repeatability on the position Pi obtained
from the estimator using a coverage factor 2.
Ri ↑ =4𝑆𝑖↑
(15
)
Ri ↓=4𝑆𝑖↓
(16
)
Rimax.
[
2𝑆𝑖↑+2Si ↓+
|
𝐵𝑖
|
;Ri ↑;Ri ↓
(17
)
Ri ↑=max.
[
Ri ↑
]
(18
)
Ri ↓=max.
[
Ri ↓
]
(19
)
Ri = max.
[
Ri
]
(20
)
Ri ↑ or Ri ↓ is the unidirectional positioning
repeatability of a specific position. Ri is the
bidirectional positioning repeatability of a particular
position.
A ↑ or A ↓ is unidirectional positioning accuracy
of an axis. It is range derived from the combination of
unidirectional system deviation and the bidirectional
positioning axis repeatability estimator using a
coverage factor of 2.
A ↑=max.
[
𝑋𝑖↑+2Si ↑
]
−𝑚𝑖𝑛.
[
𝑋𝑖↑− 2Si ↑
]
(21
)
A ↓=max.
[
𝑋𝑖↓+2Si ↓
]
−𝑚𝑖𝑛.
[
𝑋𝑖↓− 2Si ↓
]
(22
)
A is bidirectional positioning accuracy of an axis.
It is range derived from the combination of the
bidirectional system deviation and the bidirectional
positioning axis repeatability estimator using a
coverage factor of 2.
𝐴
=max.
[
𝑋𝑖↑+2Si ↑; 𝑋𝑖↓+2Si ↓
]
−𝑚𝑖𝑛.
[
𝑋𝑖↑− 2Si ↑; 𝑋𝑖↓− 2Si ↓
]
(23
)
3 DISCUSSION AND RESULT
Figure 4 shows the measurement data of positional
error on the X-axis. The highest mean deviation value
of position error occurred in X-axis with a negative
value of 29.7 µm in the measurement position of 475
mm or the absolute machine coordinate of 106 mm.
Assessment of Positional Error CNC Machine Tools using Laser Interferometer
1355
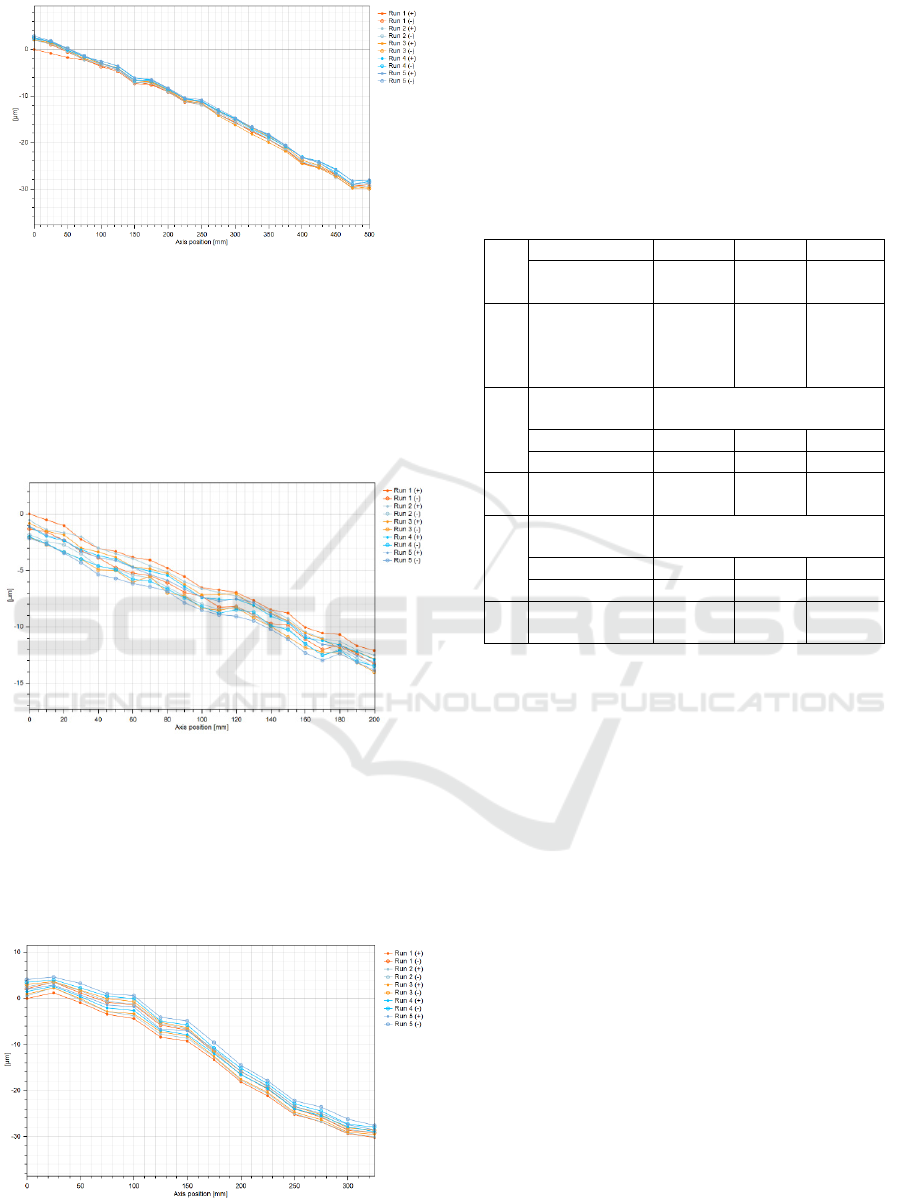
Figure 4: Measurement data of positional error on X-axis in
500 mm.
The measurement data of the positional error on Y-
axis is shown in Figure 5. The highest mean deviation
value of position error occurred in Y-axis with a
negative value of 13.6 µm in the measurement
position of 200 mm or the absolute machine
coordinate of 70 mm.
Figure 5: Measurement data of positional error on Y-axis in
200 mm.
Figure 6 shows the measurement data of
positional error on the Z-axis. The highest mean
deviation value of position error is negative 29.4 µm
in the measurement position of 325 mm or the
absolute machine coordinate of 70 mm.
Figure 6: Measurement data of positional error on Z-axis in
300 mm.
There are several positional error values on each
axis. Those are systematic position deviation, mean
reversal, unidirectional repeatability forward and
reverse, bidirectional repeatability, unidirectional
accuracy in forward and reverse, and bidirectional
accuracy. Equation (1) until number (23) are used to
calculate its positional error values. Table 2 shows the
information about positional error measurement.
Table 2: The information of positioning measurement.
No
Ite
m
X-axis Y-axis Z-axis
Measurement
travel
500
m
m
200
m
m
350
m
m
1
Bidirectional
Systemic
position
deviation
31.8
µm
12.9
µm
33.3
µm
2
Unidirectional
repeatabilit
y
forwar
d
4.2 µ
m
2.3 µ
m
3.9 µ
m
reverse 2.6 µ
m
2.2 µ
m
4.0 µ
m
3
Bidirectional
repeatabilit
y
4.2 µm 3.3 µm 6.3 µm
4
Unidirectional
accurac
y
forwar
d
34.1 µ
m
13.7 µ
m
34.5 µ
m
reverse 33.4 µ
m
13.0 µ
m
34.7 µ
m
5
Bidirectional
accurrac
y
34.2 µm 14.4 µm 35.8 µm
The assessment status of tested machine tools was
identified by comparing the information value of
positional error parameters with ISO 10791-4
(International Organization for Standardization,
1998).
The systematic position deviation value that
occurred in X is about 31.8 µm, and its value is out of
tolerance in standard systematic position deviation.
The accuracy value in the X machine axis is 34.2 µm.
The X machine axis is out of tolerance in accuracy
standard. The repeatability value in X-axis is 4.2 µm.
The repeatability of X-axis is still in tolerance in
repeatability standard.
The systematic position deviation value that
occurred in Y is about 12.9 µm, and its value is still
in tolerance in standard systematic position deviation.
The accuracy value in the Y machine axis is 14.4 µm.
The Y machine axis is still in tolerance in accuracy
standard. The repeatability value in Y-axis is 3.3 µm.
It is still in tolerance in repeatability standard.
The systematic position deviation value that
occurred in Z is about 12.9 µm, and its value is still
in tolerance in standard systematic position deviation.
The Z machine axis’s accuracy value is 33.3 µm, and
its value is out of tolerance in accuracy standard. The
iCAST-ES 2021 - International Conference on Applied Science and Technology on Engineering Science
1356
repeatability value in the Z-axis is 6.3 µm. The
repeatability of the Z-axis is still in tolerance in
repeatability standard.
The machine tools case study’s assessment status
is found by comparing positional error values with
ISO 10791-4 tolerance standard. The X and Z
machine axis is out of tolerance in standard
systematic position deviation and accuracy standard.
The repeatability of the X, Y and Z-axis are still in
tolerance in repeatability standard. The X and Z
machine axis’s positional error should be improved
by setting the error compensation parameters of
machine tools on CNC controller.
Table 3: Compensation error of X-axis.
Index Position
(mm)
Forward direction
(scale:1)
Reverse direction
(scale:1)
1 0 0 -0.716
2 25 0.751 1.014
3 50 1.488 1.512
4 75 1.467 1.668
5 100 0.962 1.44
6 125 1.056 1.132
7 150 2.622 2.605
8 175 0.352 0.133
9 200 1.726 1.75
10 225 2.162 2.112
11 250 0.514 0.621
12 275 2.227 2.058
13 300 1.786 1.723
14 325 2.099 1.718
15 350 1.688 1.848
16 375 2.104 2.137
17 400 2.634 2.787
18 425 0.904 1.085
19 450 1.715 2.087
20 475 2.486 2.394
21 500 -0.245 -0.251
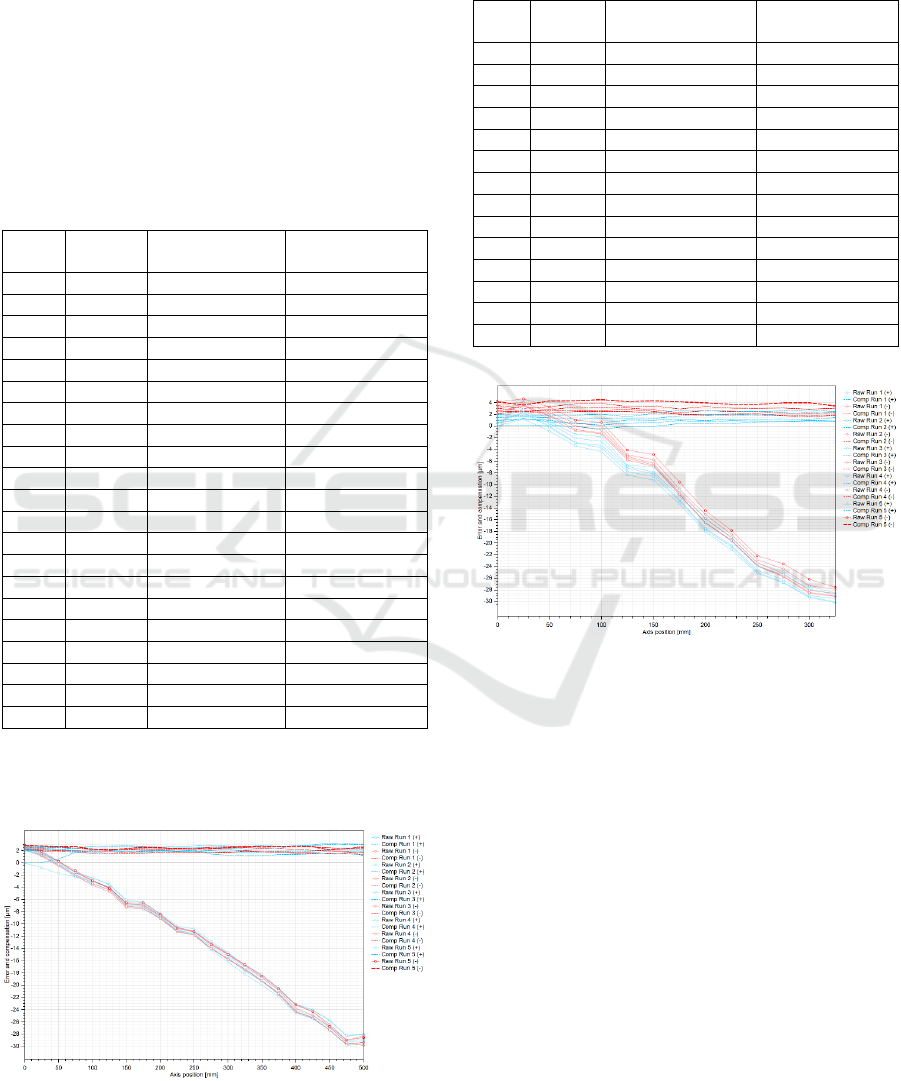
Table 3 and Figure 7 show the compensation error
value with an interval coordinate position interval in
25 mm along the X-axis.
Figure 7: Compensation error value of X machine axis.
The compensation error value with interval
coordinate position interval in 25 mm along the Z-
axis is shown in Table 4 and Figure 8.
Table 4: Compensation error of X-axis.
Index Position
(
mm
)
Forward direction
(
scale:1
)
Reverse direction
(
scale:1
)
1 0 0 -2.079
2 25 -1.281 -0.801
3 50 2.286 1.827
4 75 2.52 2.029
5 100 0.642 0.547
6 125 4.234 4.558
7 150 0.781 1.02
8 175 4.135 4.912
9 200 4.808 4.693
10 225 3.009 3.214
11 250 4.32 4.313
12 275 1.578 1.698
13 300 2.525 2.784
14 325 0.878 0.737
Figure 8: Compensation error value of Z machine axis.
Their compensation error values could be a
reference to set back error compensation parameters
on the machine controller to improve the linear
positional geometric error of the machine tool X and
Z axis.
4 CONCLUSIONS
Their linear positional error of the machine axes
movement could be identified using the measuring
method. Measuring was conducted based on ISO
measurement standards and the calibrated laser
interferometer. It resulted in the information about the
highest positional deviation, systematic position
value, accuracy, and repeatability of each machine
axis.
Assessment of Positional Error CNC Machine Tools using Laser Interferometer
1357

The X-axis and Z-axis of machine tool exceed the
tolerance range of the standard systematic position
deviation, because the systematic position deviation
value occurred on X, Y and Z axes are approximately
31.8 μm, 12.9 μm and 33.3μm. The X and Z machine
axes are out of tolerance in accuracy standard because
the accuracy value in X, Y and Z axes are 34.2 μm,
14.4 μm, and 35.8 μm. And the X, Y and Z axes are
still within tolerance in repeatability standards
because the X, Y and Z axes repeatability values are
4.2 μm, 33.3 μm and 6.3 μm.
The compensation error values of the X and Z
axes have been generated based on their linear
positional errors. It will be further utilized as the
primary data for setting back error compensation
parameters on CNC controller and developing G-
Code correction modelling.
REFERENCES
Barman, S., & Sen, R. (2010). Enhancement of accuracy of
multi-axis machine tools through error measurement
and compensation of errors using laser interferometry
technique. Mapan - Journal of Metrology Society of
India, 25(2), 79–87.
Bryan, J. (1990). International Status of Thermal Error
Research (1990). Journal of Manufacturing Systems,
39(2), 645–656.
Chen, X. B., Geddam, A., & Yuan, Z. U. (1997). Accuracy
Improvement of Three-Axis CNC Machining Centers
by Quasi-Static Error Compensation. Journal of
Manufacturing Systems, 16(5).
International Organization for Standardization. (1998). ISO
10791-4: Test Conditions for Machining Centres-
Accuracy and Repeatability of Positioning of Linear
and Rotary Axes. International Organization for
Standardization.
International Organization for Standardization. (2006). ISO
230-2 Test code for machine tools- Part 2:
Determination of accuracy and repeatability of
positioning numerically controlled axes (Third).
Okafor, A. C., & Ertekin, Y. M. (2000). Vertical machining
center accuracy characterization using laser
interferometer Part 1. Linear positional errors. Journal
of Materials Processing Technology, 105(3), 394–406.
Renishaw. (2008). XL-80 laser system training course
manual (Nomor Part 1). Renishaw plc.
Schwenke, H., Knapp, W., Haitjema, H., Weckenmann, A.,
Schmitt, R., & Delbressine, F. (2008). Geometric error
measurement and compensation of machines-An
update. CIRP Annals - Manufacturing Technology,
57(2), 660–675.
Tian, W., Gao, W., Zhang, D., & Huang, T. (2014). A
general approach for error modeling of machine tools.
International Journal of Machine Tools and
Manufacture, 79, 17–23.
Wang, S. M., Liu, Y. L., & Kang, Y. (2002). An efficient
error compensation system for CNC multi-axis
machines. International Journal of Machine Tools and
Manufacture, 42(11), 1235–1245.
Weck, M., McKeown, P., Bonse, R., & Herbst, U. (1995).
Reduction and Compensation of Thermal Errors in
Machine Tools. CIRP Annals - Manufacturing
Technology, 44(2), 589–598.
Yang, S. H., Kim, K. H., Park, Y. K., & Lee, S. G. (2004).
Error analysis and compensation for the volumetric
errors of a vertical machining centre using a
hemispherical helix ball bar test. International Journal
of Advanced Manufacturing Technology, 23(7–8), 495–
500.
iCAST-ES 2021 - International Conference on Applied Science and Technology on Engineering Science
1358
