
Static Web Workload Distribution Test on Cluster-based Web Server
System with Locality-based Least Connection Algorithm
Nongki Angsar, Petrisia W. Sudarmadji and Lita A. Ndoeloe
Electrical Engineering Department, State Polytechnic of Kupang, Kupang, Indonesia
Keywords: Distribution Test, Web Server, Cluster.
Abstract: The growth of web traffic and network bandwidth which is quicker than the growth of microprocessor these
days cause single server platform no longger be adequate to fulfill the requirement of web server system
scalability. Plural server platform is the answer. One of solutions which have been recognized is cluster-based
web server system. This research did some static web workload distribution tests on a cluster-based web server
system by generating HTTP workloads staticly (with constant HTTP request rate) from client to web server
system pool. In this research, result of staticly testing with constant HTTP request rate 990.7 requests per
second (rps) shows that HTTP requests were well-distributed to web server system pool by Locality- Based
Least Connection Algorithm. HTTP reply rates were average at 988.8 replies per second. Response time was
35.7 miliseconds (ms). Throughput was 0.29 Mega bit per second (Mbps). TCP connection rate was 99.3
connections per second (cps). Error was nearly 0.
1
INTRODUCTION
Along with the complexity of web service and
application in so many areas, hence web service
request from user become progressively high.
Example of popular web services and applications are
business service and application (e-business),
education (e-learning), news (e-news), and others.
Also with the growth of network infrastructure
and computer communication become progressively
good in recent years. Application of optical fibre on
cables (Freeman, 1998), Gigabit Ethernet on LAN
(William, 2000), broadband- ISDN on WAN
(William, 2000), xDSL digital transmission on
telephone line (William, 2000), and cable modem
make network bandwidth become bigger. Even a
prediction which is made by George Gilder in 1995
said that the growth of network bandwidth will be
multiply thrice every year (Gray, 2000). This
prediction still go into effect, special for the optical
fibre, refers to article made in 2008 (Gilder, 2008).
On the other side, computer growth (sum of
transistors in a microprocessor chip), according to the
prediction of Intel founder, Gordon Moore in 1960
will only be multiply twice every 18 months (Intel,
2003). This prediction have been proven through
years untill now, and usually referred as Moore’s
Law.
According to these two predictions, the network
bandwidth growth will be multiply twice than
computer growth, and the possible bottle-neck will
lay in server side.
2
LITERATURE REVIEW
According to Cardellini et al (Valeria, 2001), there
are two efforts which can be done: (1) scale-up
effort (single platform server and (2) scale-out effort
(plural platform server). First effort is good enough,
however having some weakness. First, requiring big
expense to keep pace with recent technology.
Second, can not eliminate the fact that single point
of failure (SPOF) is on server itself. Third,
availability and continuity will be disturbed at the
time of server scalability improvement. Fourth,
replacement to new hardware cause old hardware
tends to be useless in system. While second effort,
on the contrary, cheaper and do not own SPOF. One
of the popular plural web server system is cluster-
based web server system.
Angsar, N., Sudarmadji, P. and Ndoeloe, L.
Static Web Workload Distribution Test on Cluster-based Web Server System with Locality-based Least Connection Algorithm.
DOI: 10.5220/0010963900003260
In Proceedings of the 4th International Conference on Applied Science and Technology on Engineering Science (iCAST-ES 2021), pages 1287-1292
ISBN: 978-989-758-615-6; ISSN: 2975-8246
Copyright
c
2023 by SCITEPRESS – Science and Technology Publications, Lda. Under CC license (CC BY-NC-ND 4.0)
1287
3
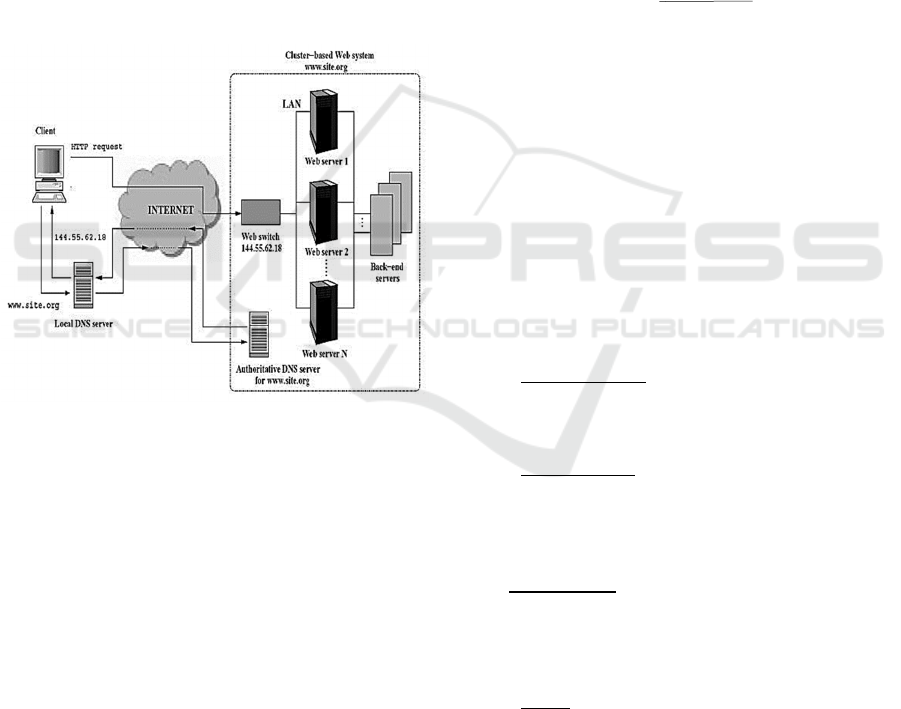
BASIC THEORY
A cluster-based web server system is a set of
heterogeneous web server that work under
coordination of load balancer to serve HTTP request
from client. Web server cluster is visible from client
as one single system with one domain name and IP
address. This system consist of (Valeria, 2001):
a.
Load Balancer, is a digital device which
intentionally be placed at 7
th
or 4
th
layer of
ISO/OSI to share workload among servers.
b.
Server Pool, is a cluster of real-servers which
doing real service, such as: web, ftp, e-mail.
c.
Back-end Server, is backside system which
save service data and content from server, such
as: database and NFS.
Figure 1: Cluster-based Web Server System Architecture.
There are two main function of load balancer in
cluster-based web server system, those are: routing
function (which realized in routing mechanism) and
delivery function (which realized in dispatching
algorithm.
A.
Routing Mechanism
Routing mechanism functioning to package and
direct client request to a real-server. Routing
mechanism which is used in this paper is Network
Address Translation (NAT).
B.
Dispatching Algorithm
Dispatching algorithm functioning to choose a real-
server to reply client request (Shivaratri, 1992).
Dispatching algorithm which is used in this paper is
Locality- Based Least Connection Algorithm.
C.
Weight Determination
Weight determination influenced by web content type
provided by web server. If web content type is static
hence the weight will only be influenced by
storage
media speed factor, P
m
. If web content type is
dynamic hence the weight will only be influenced by
processor speed factor, P
p
. If web content type is a
mix between static and dynamic, hence its formula
will become
w=α
P
p + (1−α)
P
m
(1)
α is a ratio which determine contribution of
P
m and
P
p to the weight w.
α =
N
d
(N
d
+ N
s
)
(2)
with N
d
and N
s
are number of dynamic and static
web content access statistic.
4
RESEARCH METHODS
Methodology which is used in this paper covers tools
and materials, the way of research, system design, and
analysis.
A.
Tools and Materials
Tools specification which are used in this paper are:
1.
Load Balancer: Intel
®
Celeron
®
Dual-Core
N3060 1,6 GHz x 2, DDR3 SDRAM 2 GB,
HD Toshiba
®
SATA 500 GB x 1, NIC Realtek
PCI Fast Ethernet, Linux 4.8.6-300
2.
Real-server 1: AMD
®
A4-1200 APU with
Radeon
®
HD Graphics 1GHz x 2, DDR3
SDRAM 2 GB, HD Seagate
®
Barracuda
®
ATA 500 GB x 1, NIC Realtek PCI Fast
Ethernet, Windows 8 Pro, Apache 2.2.25.
3.
Real-server 2: AMD
®
Dual Core Processor C-
50 1 GHz x 2, DDR3 SDRAM 2GB, HD
Hitachi
®
ATA 320GB x 1, NIC Atheros
Family PCI, Windows 7 Ultimate, Apache
2.2.25.
4.
Client: Intel
®
Celeron
®
M CPU 430 1,73 GHz,
DDR2 SDRAM Visipro
®
512 MB, HD
Seagate
®
Barracuda
®
60 GB 5400 rpm x 1,
NIC Broadcom 440x 10/100 Mbps, Linux
2.6.25-14
5.
Switch: SMC
®
5-port 10/100Mbps Auto-MDIX
Switch - SMC-EZ6505TX (store-and-forward
transmission)
iCAST-ES 2021 - International Conference on Applied Science and Technology on Engineering Science
1288
6.
UTP cable (Cat 5) 15 meters.
Materials which will be researched is the
average HTTP reply rate of cluster-based web
server system if HTTP request rate from client
are dynamic.
B.
The Way of Research
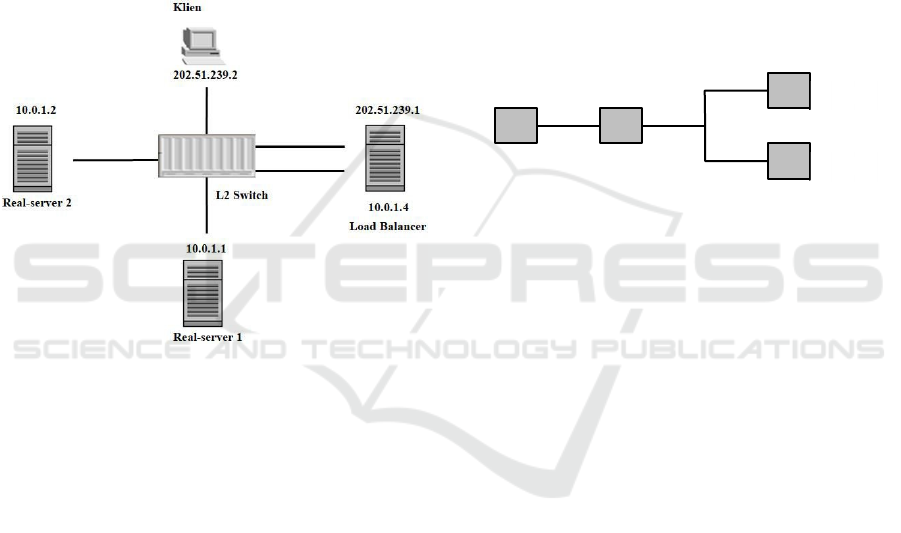
1.
Hardware configuration.
In this research, there were only two real-servers
that being used, because it was hard to find real-
servers with different specification in
laboratorium. Real-servers with different
specification was more suitable with real world
condition.
Figure 2: Hardware configuration.
2.
Software configuration.
a.
Load Balancer (LB)
•
Network interface configuration and
masking (NAT)
•
Load Balancer software configuration
•
Define dispatching algorithm
•
Load Balancer to Real-server 1 and 2
Address and Port Mapping
•
Weight configuration
b.
Real-server
•
Network interface configuration and
web server configuration on Real-
server 1
•
Network interface configuration and
web server configuration on Real-
server 2
c.
Client
•
Network interface configuration
•
Web workload testing software
configuration on client
•
3.
Doing static web workload distribution test on
cluster-based web server system. On this test,
HTTP request rate produced was as big as 1,000
request per second, and distributed to both real-
server in the cluster-based web server system
with Locality-Based Least Connection
Algorithm. The number 1,000 HTTP request
per second was achieved by trial and error
mechanism. From trial and error process, we
got this number 1,000 HTTP request per
second. At this number of HTTP request rate,
HTTP reply rate from server began to stable or
saturated, not fluctuated. By the end of the test
there will be a data recording.
C.
System Design
System which is designed in this paper is:
Figure 3: Network of cluster-based web server system.
D.
Analysis
Web server system in this paper is evaluated
according to five test parameters, those are: HTTP
reply rate, response time, throughput, TCP
connection rate, and error. Those five test parameters
are tested for Locality-Based Least Connection
Algorithm. The test is done by producing HTTP
request rate from client staticly, and then record
HTTP reply rate, response time, throughput, TCP
connection rate and error between load balancer and
real-servers.
The data recording are presented in text.
Presentation of those five parameters is done by
presenting text data recording of Locality-Based
Least Connection Algorithm result test. There will be
a text consist of HTTP reply rate, response time,
throughput, TCP connection rate, error, etc.
5
RESULTS AND DISCUSSION
After hardware and software configurations on
cluster-based web server system are finished, the next
step is staticly web workload distribution test (with
single TCP connection rate).
RS
1
Clie
LB
RS
2
Static Web Workload Distribution Test on Cluster-based Web Server System with Locality-based Least Connection Algorithm
1289

A. Results of Static Web Workload Test
In this test, HTTP request rate which is produced is
990.7 HTTP request per second, then distributed to
real-server with Locality-Based Least Connection
Algorithm.
The data recording of static web workload test
results for Locality-Based Least Connection
Algorithm are:
Connection rate: 99.3 conn/s (10.1
ms/conn, <=80 concurrent connections)
Connection time [ms]: min 63.7 avg
388.1 max 799.2 median 395.5 stddev
200.5
Connection time [ms]: connect 30.7
Connection length [replies/conn]:
10.000
Request rate: 990.7 req/s (1.0 ms/req)
Request size [B]: 75.0
Reply rate [replies/s]: min 962.5 avg
988.8 max 1029.5 stddev 17.1 (10 samples)
Reply time [ms]: response 35.7
transfer 0.0
Reply size [B]: header 241.0 content
44.0 footer 0.0 (total 285.0)
Reply status: 1xx=0 2xx=49900 3xx=0
4xx=0 5xx=0
CPU time [s]: user 4.10 system 43.60
(user 8.1% system 86.6% total 94.7%)
Net I/O: 348.3 KB/s (2.9*10^6 bps)
Errors: total 10 client-timo 10
socket-timo 0 connrefused 0 connreset 0
Errors: fd-unavail 0 addrunavail 0
ftab-full 0 other 0
Explanation line by line are:
TCP connection rate and total TCP connection
were together appear in Linux text mode line as
below.
Connection rate: 99.3 conn/s (10.1
ms/conn, <=80 concurrent connections)
The line above shows connection rate as big as
99.3 connection per second (10.1
miliseconds/connection), and at least, there were 80
connections opened together to the web server cluster
at the same time.
One full TCP connection life time statistic were
appear in Linux text mode line as below.
Connection time [ms]: min 63.7 avg
388.1 max 799.2 median 395.5 stddev 200.5
The line above shows successful connection life
time statistic. Connection life time is time which
counted from TCP connection was established until
TCP connection was closed. One TCP connection
would be said success if it has at least one HTTP
request that was replied by web server cluster. From
the line of data recording above we can see that
minimum connection life time is 63.7 miliseconds,
average 388.1 miliseconds, maximum 799.2
miliseconds, median 395.5 miliseconds and standard
deviation was 200.5 miliseconds.
Average time which needed to form one TCP
connection to server, including success TCP
connection, fail TCP connection and non replied TCP
connection, was appear in Linux text mode line as
below.
Connection time [ms]: connect 30.7
The line above shows that, at least, it needs time
around 30.7 miliseconds to build a TCP connection
with server.
Average HTTP reply per TCP connection was
appear in the Linux text mode line as below.
Connection length [replies/conn]:
10.000
The line above shows that average HTTP replies
per one TCP connection was 10 HTTP replies per
TCP connection.
HTTP request rate was appear in Linux text mode
line as below.
Request rate: 990.7 req/s (1.0 ms/req)
The line above shows that HTTP request rate
from client to server were 990.7 HTTP request per
second.
Average size of HTTP request in byte order was
appear as below.
Request size [B]: 75.0
The line above shows that average size of HTTP
request was 75 Byte.
HTTP reply rate statistic were appear in Linux
text mode line as below.
Reply rate [replies/s]: min 962.5 avg
988.8 max 1029.5 stddev 17.1 (10 samples)
The line above shows that minimum HTTP reply
rate was 962.5 replies/second, average 988.8
replies/second, maximum 1029.5 replies/second and
standard deviation was 17.1 replies/second.
Response and transfer time of the server were
appear in Linux text mode line as below.
iCAST-ES 2021 - International Conference on Applied Science and Technology on Engineering Science
1290

Reply time [ms]: response 35.7
transfer 0.0
The line above gives information about how long
the server takes to response client request and how
long the client needs to read server’s reply. Response
time was counted since the first byte of HTTP request
was sent until the first byte of HTTP reply was
received by client. Transfer time was the time needed
to read whole reply.
From the line above we can see that response time
was 35.7 miliseconds and transfer time was 0
miliseconds.
Size of HTTP reply header, HTTP reply content,
HTTP reply footer, and HTTP reply total were appear
in Linux text mode line as below.
Reply size [B]: header 241.0 content
44.0 footer 0.0 (total 285.0)
The line above shows that the size of reply head
was 241 Byte, the size of reply content was 44 Byte,
the size of reply footer was 0 Byte and the size of total
reply was 285 Byte.
HTTP reply status was appear in Linux text mode
line as below.
Reply status: 1xx=0 2xx=49900 3xx=0
4xx=0 5xx=0
The line above shows that there were 49,900 reply
with status 2xx, which means that replies were
successfully transmit.
CPU utilization time were appear in Linux text
mode line as below.
CPU time [s]: user 4.10 system 43.60
(user 8.1% system 86.6% total 94.7%)
The line above shows that, it needs 4.10 seconds
(8.1%) in user mode and 43.60 seconds (86.6%) in
system mode to execute the program.
Network throughput value was appear in Linux
text mode line as below.
Net I/O: 348.3 KB/s (2.9*10^6 bps)
The line above shows the value of network
throughput which counted from total byte transmitted
and received in a TCP connection. From the line
above we can see that network throughput was 348.3
kilo bytes per second which is around 0.29 mega bits
per second.
Error statistic were appear in Linux text mode line
as below.
Errors: total 10 client-timo 10
socket-timo 0 connrefused 0 connreset
0
The line above shows that, there were 10 errors,
which all caused by the missed of time limit (client-
timo = 10).
Other error were appear in Linux text mode line
as below.
Errors: fd-unavail 0 addrunavail 0
ftab-full 0 other 0
The line above show that client never produce
load over the limit in the file descriptor, client always
get port number, file descriptor table was never full
and there was no other error.
Result of staticly testing with constant HTTP
request rate 990.7 rps in the data recording above
shows that HTTP requests were well-distributed to
web server system pool by Locality-Based Least
Connection Algorithm. HTTP reply rates was 988.8
replies/s. It means that almost all of HTTP requests
were replied by web server cluster. Web server cluster
working together to reply almost all of the request in
certain sequence, according to Locality-Based Least
Connection Algorithm. Locality-Based Least
Connection was working to assigns jobs (directing
HTTP requests from client) destined for the same IP
address to the same server if the server is not
overloaded and available; otherwise assign jobs to
servers with fewer jobs, and keep it for future
assignment.
Response time was 35.7 ms. Throughput was 0.29
Mbps. TCP connection rate was 99.3 cps. Errors was
nearly 0.
6
CONCLUSION
Conclusion which can be taken from this research is:
Result of staticly web workload testing with constant
HTTP request rate 990.7 rps shows that HTTP
requests were well-distributed to web server system
pool by Locality-Based Least Connection Algorithm.
Static Web Workload Distribution Test on Cluster-based Web Server System with Locality-based Least Connection Algorithm
1291

REFERENCES
Roger L. Freeman. (1998). Telecommunication
Transmission Handbook, 4th edition. Canada: John
Wiley & Sons, Inc.
William Stallings. (2000). Data and Computer
Communication, 6th edition. Upper Saddle River, New
Jersey: Prentice-Hall.
J. Gray, P. Shenoy. (2000). Rules of Thumb in Data
Engineering. In IEEE 16th International Conference on
Data Engineering. San Diego, California: IEEE, 2000.
IA-32 Intel® Architecture Software Developer’s Manual
Vol. 1: Basic Architecture, Order Number 24547-012.
Illionis: Intel Corporation, 2003.
Valeria Cardellini, Emiliano Casalicchio, Michele
Colajanni, Philip S. Yu. (2001).The State of the Art in
Locally Distributed Web-server Systems.IBM Research
Report.
G. Gilder. (2008).The Coming Creativity Boom. October
23
rd
. http://www.forbes.com/forbes/2008/1110/036.
html
N. G. Shivaratri, P. Krueger, M. Singhal. (1992). Load
Distributing for Locally Distributed Systems. IEEE
Computer.
iCAST-ES 2021 - International Conference on Applied Science and Technology on Engineering Science
1292
