
Prediction of Mining Corporation Stock Index based on Gold Price
Index and Exchange Rate of Currency
Prajna Deshanta Ibnugraha
a
and Moch Fahru Rizal
School of Applied Science, Telkom University, Bandung, Indonesia
Keywords: Stock Prediction, Naïve Bayes, Mining Corporation, Gold Price, Currency Exchange.
Abstract: The stock prediction is essential part for stock trader. It is able to reduce potential risk of financial loss. The
stock prediction model can be built using time series algorithm in machine learning such as Naïve Bayes. This
algorithm is utilized by this study for forecasting stock price of mining corporation PT Antam. Two features
involved in forecasting are gold price and currency exchange of Indonesian Rupiah (IDR) to US Dollar (USD).
The dataset is obtained from Stock Exchange of Indonesia in 2018-2019 period. Splitting of dataset and cross-
validation are used to compute the accuracy of the model. The model produces 51%-52% of accuracy. It
means that features are not reliable to predict the stock price of mining corporation in Indonesia.
1 INTRODUCTION
Part of ownership in corporation can be represented
in form of stocks capital. The stock owners have right
to corporation earning. In order to achieve profit from
corporation stocks, investors must consider stocks
price when they want to invest their money in
corporation stocks. In stock trading, investors do not
only take profit from corporation earning, but they
also make profit from selling margin. The investors
must create strategy to make decision related to buy,
hold, or sell the stocks. However, the movement of
stocks price is a problem because stocks price change
dynamically where it can be affected by many factors.
The mistakes in choosing strategy cause impact to
investor such as financial loss. Therefore, investors
must understand the movement pattern of stocks price
so they can predict stock price.
In stocks market analysis, there are two types of
analysis, namely fundamental analysis and technical
analysis (Peachavanish, 2016). Fundamental analysis
uses corporation condition to determine stocks price.
Generally, it uses variables such as financial report,
income balance, etc. Meanwhile, technical analysis is
more likely to analyse stocks price based on historical
prices and trends. In order to use fundamental
analysis, investors can refer to stock exchange
recommendation related to corporations having good
a
https://orcid.org/0000-0002-8362-370X
fundamental. The problem arises when investors want
to implement technical analysis where they must
involve a lot of information related to historical prices
and trends to make decision. The Proper prediction
model is needed by investors to determine stocks
price from that information.
In this study, we propose prediction model for
stocks price in Indonesian stock exchange. However,
we do not predict all of stocks price because the
difference types of corporation stocks have different
factors affecting stock price. We decide to use PT.
Antam Tbk as a case study. PT Antam Tbk is
corporation that produces mining commodities such
as gold, nickel, coal, and silver. However, gold is the
main commodities from these corporation.
2 RELATED WORKS
In order to predict stocks price, there are many factors
and methods that must be considered. PT Antam Tbk
as mining corporation, has stock price where it has
relationship with external factors such as gold price
and the exchange rates of currency from the
Indonesian Rupiah (IDR) against the US Dollar
(USD) (Sinay, Tihurua, & Rahakbauw, 2018). Both
factors affect Antam stock price in short and long
term. Those relationship has been evaluated using
1276
Ibnugraha, P. and Rizal, M.
Prediction of Mining Corporation Stock Index based on Gold Price Index and Exchange Rate of Currency.
DOI: 10.5220/0010963700003260
In Proceedings of the 4th Inter national Conference on Applied Science and Technology on Engineering Science (iCAST-ES 2021), pages 1276-1280
ISBN: 978-989-758-615-6; ISSN: 2975-8246
Copyright
c
2023 by SCITEPRESS – Science and Technology Publications, Lda. Under CC license (CC BY-NC-ND 4.0)

Autoregressive Distributed Lag (ARDL) method by
placing PT Antam stock price as dependent variable
and gold price and the exchange rate of the IDR
against the Dollar as independent variables. Those
forms of relationship are also reinforced by previous
study. Those previous study stated that stocks market
prices were affected by gold price and exchange rate
of currency (Arfaoui & Ben Rejeb, 2017). Stocks
price is linked with gold price and both factors have
significant influence to each other in short and long
term. Exchange rate of currency is also able to
influence stocks price and movement of exchange
rate of currency can be used to predict stocks price.
In stocks market prediction, stocks price has time
series trend (Wen, Li, Zhang, & Chen, 2019). There
are several approaches to predict stocks price in time
series trend, such as statistical approach and machine
learning (Shah, Isah, & Zulkernine, 2019). Methods
using statistical approach are Smooth Transition
Autoregressive (STAR), Auto-Regressive Moving
Average (ARMA), Generalized Autoregressive
Conditional Heteroskedastic (GARCH), and Auto-
Regressive Integrated Moving Average (ARIMA).
Anaghi built stock prediction model using ARMA
and involving filtering, interpolation, and smoothing
(Anaghi & Norouzi, 2012). The model had best
performance when it used 2 poles and zeros. In
previous study, ARIMA was also used in predicting
stock price. Adebiyi utilized ARIMA for forecasting
stock price in Nigeria Stock Exchange (NSE) and
New York Stock Exchange (NYSE) (Adebiyi,
Adewumi, & Ayo, 2014). According to the output of
Adebiyi research, ARIMA has good performance in
short-term prediction.
Meanwhile, techniques in machine learning can
be classified in supervised learning and unsupervised
learning. In unsupervised learning, dataset is trained
using specific algorithm to result pattern of data such
as clusters, so it does not require label. Otherwise,
supervised learning requires label to determine
expected output. Therefore, supervised learning is
suitable in prediction involving several factors.
Algorithms used in supervised learning are Naïve
Bayes, Neural Network, Random Forest, and etc. In
previous study, Loke built prediction stock model
with Random Forest based on financial ratio and
technical analysis (Loke, 2017). Loke used dataset
from Hong Kong Stock Exchange in 2011-2014 and
divided each annual data becoming quarters. The
testing result of Loke research stated that financial
ratio was not reliable to predict the stock price.
Ravikumar also compared several algorithms in
classification using Apple stock dataset where it was
obtained from Yahoo Finance dataset. The compared
algorithms were Support Vector Machine (SVM),
Naïve Bayes, K-Nearest Neighbours (KNN),
Decision Tree Classification, Logistic Regression,
and Random Forest Classification. The result stated
that Logistic Regression had better accuracy among
the others. However, the accuracy is 68,622% so it
has not been adequate as prediction model. In other
case, Chaigusin also utilized Neural Network
algorithm to forecasting stock price in Stock
Exchange of Thailand (SET) (Chaigusin,
Chirathamjaree, & Clayden, 2008). Dataset was
obtained from SET in 2003-2004 period. Chaigusin
research produced conclusion that stock market in
SET was affected by Nikkei index, Dow Jones index,
Hang Seng index, exchange rates of Thai Baht to US
dollar, Minimum Loan Rate (MLR), and the price of
gold.
In previous explanation, there are two focuses, i.e.
variables affected stock market price and prediction
algorithms of stock price. We utilize these two
focuses to result new analysis related to prediction
algorithm in stock market price scope using gold
price index and exchange rate of currency as
variables.
3 METHODOLOGY
In this study, we propose six steps of work to solve
the problem. The steps is defined from previous
research (Kumar, Dogra, Utreja, & Yadav, 2018) and
it is adjusted with the problems in this study. The
sequence from steps of work can be shown in figure
1.
Figure 1: The six steps of work to build and evaluate the
stock prediction model.
Prediction of Mining Corporation Stock Index based on Gold Price Index and Exchange Rate of Currency
1277
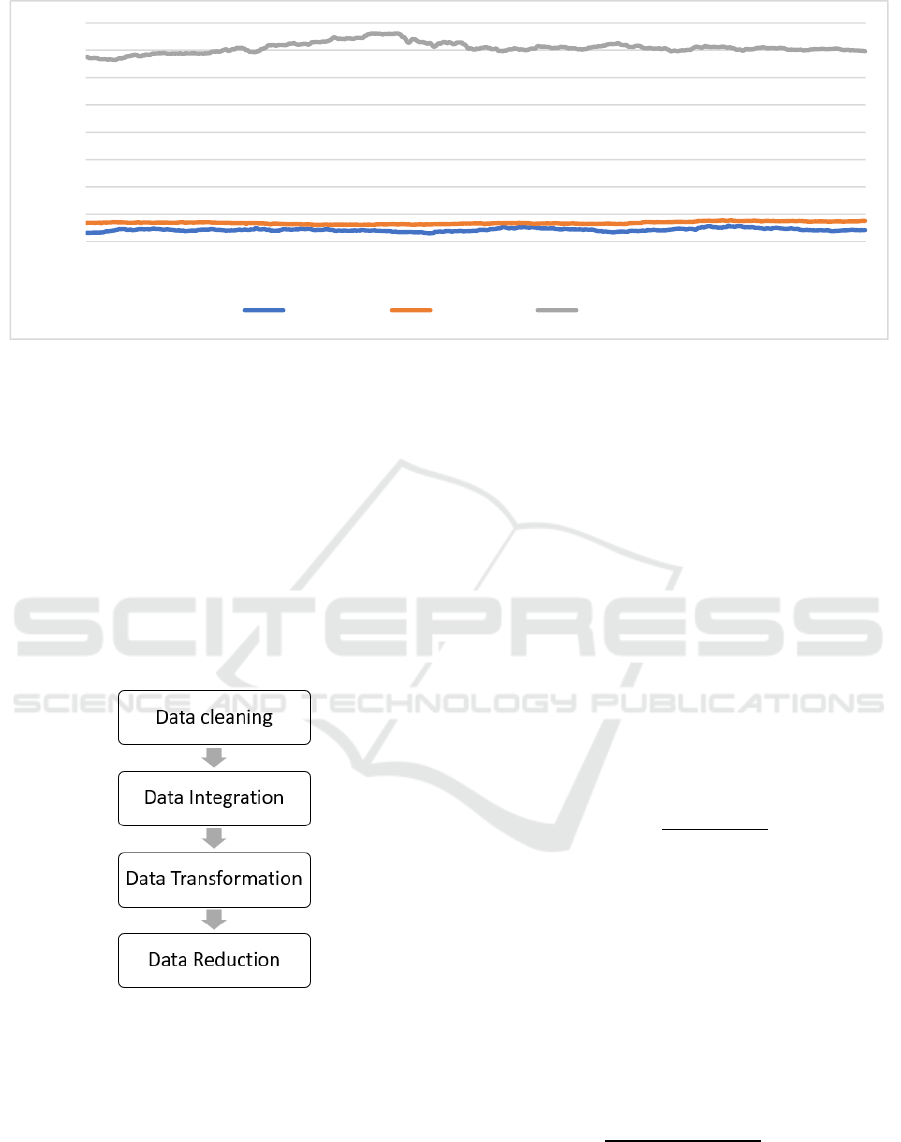
Figure 2: The data of Antam stock index, gold price index, and currency exchange rate from US Dollar (USD) to Indonesian
Rupiah (IDR).
In order to obtain dataset, we use the daily data in
2018-2019 with amount of data about 474 data from
Indonesian stock exchange institution. The data
distribution of Antam stock price, gold price index,
and exchange rates of currency from US Dollar (USD)
to Indonesian Rupiah (IDR) in early 2018 until last
2019 can be shown in figure 2.
The dataset is through pre-processing steps before
it is inputted in the predictor algorithm. The pre-
processing of dataset consists of four steps shown in
figure 3 (Nti, Adekoya, & Weyori, 2020).
Figure 3: The pre-processing steps for converting data
source to dataset.
The dataset in this study is structured data, so data
cleaning step is not necessary in this case. Data
cleaning usually is needed by unstructured data to
reduce inconsistent form of data. In data integration
step, we integrate three types of data, namely stock
movement data, gold price movement data, and
exchange rates of currency from IDR to USD. In data
transformation, we equalize the movement of stock
price, gold price, and exchange rate of currency to be
three levels, i.e., up, down, and fixed. Furthermore,
the suitable information from dataset is selected in
data reduction step. It aims to decrease the volume of
dataset.
In method selection, we involve Naïve Bayes
algorithm to predict stock market price of mining
corporation. This algorithm is selected based on
characteristics of stock market movement where it is
time series trend. We also have several reasons to
select this algorithm such as having good accuracy,
able to work in less of data, able to handle quantitative
and discrete data. The Naïve Bayes uses probabilistic
approach to result output. This classifier involves
Bayes Theorem in its algorithm where it can be
shown in equation (1).
(
|
)
=
(
|
)
.
(
y
)
(
)
(1)
y represents class variable, while x is features. If
the features consist of several factors, then it can be
represented by equation (2).
=
(
,
,
,…
)
(2)
Therefore, this classifier also has form like equation
(3).
(
|
,
,
,…
)
=
(
|
)
=
∏
(
|
)
.()
∏
(
)
(3)
In order to conduct supervised classification in
training and testing, we use two conditions. First
condition use splitting process of dataset and second
0
2000
4000
6000
8000
10000
12000
14000
16000
1
15
29
43
57
71
85
99
113
127
141
155
169
183
197
211
225
239
253
267
281
295
309
323
337
351
365
379
393
407
421
435
449
463
Stock Price Gold Index USD to IDR
iCAST-ES 2021 - International Conference on Applied Science and Technology on Engineering Science
1278

condition use cross validation process. Algorithm 1 is
the flow of dataset process in Naïve Bayes.
Algorithm 1.
Var:
x
k
:= data of feature, (x
1
, x
2
, x
3
,….x
n
)
v
k
:= data of feature, (v
1
, v
2
, v
3
,….v
n
)
y
k
:= data of class variable, (y
1
, y
2
, y
3
,….y
n
)
k := label (up, fixed, down)
x
t
:= x transform of k condition
v
t
:= v transform of k condition
y
t
:= y transform of k condition
Pred := model output
Begin
x
t
←φ , v
t
←φ , y
t
←φ , Pred ←φ
count := 1
while count ≤ n do
if (x
k
– x
k-1
)>0 then
x
t
← “up”
else if (x
k
– x
k-1
)=0 then
x
t
← “fixed”
else if (x
k
– x
k-1
)<0 then
x
t
← “down”
end if
if (v
k
– v
k-1
)>0 then
v
t
← “up”
else if (v
k
– v
k-1
)=0 then
x
t
← “fixed”
else if (v
k
– v
k-1
)<0 then
v
t
← “down”
end if
if (y
k
– y
k-1
)>0 then
y
t
← “up”
else if (y
k
– y
k-1
)=0 then
y
t
← “fixed”
else if (y
k
– y
k-1
)<0 then
y
t
← “down”
end if
count +=1
end while
(
|
)
=
(
|
)
.
(
)
(
)
Pred ←
(
,
|
)
End
Meanwhile, result evaluation is conducted by
involving two variables, namely Correctly Classified
Instances (CCI) and Root Mean Square Error
(RMSE). RMSE is index of error from the prediction
output where the predictor has good performance if
the value of index is low. RMSE can be computed by
equation (4).
=
1
(
−
)
(4)
n is the total number of data, x
i
is actual value of stock
level, and y
i
is predicted value of stock level.
4 RESULT AND DISCUSSION
In order to predict stock price based on the data, we
use two conditions. First, we use splitting process of
dataset to be 80% of data as training set and 20% of
data testing set. Previous research used proportion 7:3
for training set and testing set (Long, Lu, & Cui,
2019). Second, we use cross validation with k-folds
for generating model. These condition changes
dataset becoming random subset, namely fold. This
study uses 10-folds where it uses 10 folds as testing
set and rest of folds as training set. Results of these
condition with Naïve Bayes are shown in table 1.
Table 1: Result of Naïve Bayes algorithm on dataset.
Condition Variables Value
Splitting
process
Correctly Classified
Instances
51.5789 %
Incorrectly Classified
Instances
48.4211 %
Root mean squared
error
0.4424
Cross-
validation
Correctly Classified
Instances
52.1097 %
Incorrectly Classified
Instances
47.8903 %
Root mean squared
error
0.4385
Both conditions result almost similar value of
Correctly Classified Instances (CCI). These variables
is used to state number of data classified correctly
with Naïve Bayes algorithm. Condition with splitting
dataset 8:2 results CCI=51.5789 % and
RMSE=0.4424, whereas condition with cross-
validation 10-folds results CCI=52.1097 % and
RMSE=0.4385. Even though cross-validation 10-
Prediction of Mining Corporation Stock Index based on Gold Price Index and Exchange Rate of Currency
1279

folds produces better result than 8:2 portion, both
results have not filled as adequate output in prediction
model. The prediction output is feasible if it has
accuracy 80% or higher (Lin et al., 2019).
5 CONCLUSION
In previous research, the stock price of mining
corporation has relation with gold price and exchange
rates of currency. Therefore, this study wants to build
prediction model using those variables. In order to
handle time series characteristic of stock prices,
Naïve Bayes algorithm is involved to build prediction
model. Dataset was obtained from Indonesian stock
exchange institution in period 2018-2019. In order to
build prediction model, this study uses two
conditions, i.e., splitting dataset and cross-validation
10-folds. However, the result of both conditions has
not been feasible because it has accuracy less than
80%. The splitting dataset only produces
CCI=51.5789% with RMSE=0.4424 whereas cross-
validation results CCI=52.1097% with
RMSE=0.4385.
REFERENCES
Adebiyi, A. A., Adewumi, A. O., & Ayo, C. K. (2014).
Stock price prediction using the ARIMA model.
Proceedings - UKSim-AMSS 16th International
Conference on Computer Modelling and Simulation,
UKSim 2014, 106–112. https://doi.org/10.1109/
UKSim.2014.67
Anaghi, M. F., & Norouzi, Y. (2012). A model for stock
price forecasting based on ARMA systems. 2012 2nd
International Conference on Advances in
Computational Tools for Engineering Applications,
ACTEA 2012, 265–268. https://doi.org/10.1109/
ICTEA.2012.6462880
Arfaoui, M., & Ben Rejeb, A. (2017). Oil, gold, US dollar
and stock market interdependencies: a global analytical
insight. European Journal of Management and
Business Economics, 26(3), 278–293.
https://doi.org/10.1108/EJMBE-10-2017-016
Chaigusin, S., Chirathamjaree, C., & Clayden, J. (2008).
The use of neural networks in the prediction of the stock
exchange of Thailand (SET) index. 2008 International
Conference on Computational Intelligence for
Modelling Control and Automation, CIMCA 2008,
670–673. https://doi.org/10.1109/CIMCA.2008.83
Kumar, I., Dogra, K., Utreja, C., & Yadav, P. (2018). A
Comparative Study of Supervised Machine Learning
Algorithms for Stock Market Trend Prediction.
Proceedings of the International Conference on
Inventive Communication and Computational
Technologies, ICICCT 2018, (Icicct), 1003–1007.
https://doi.org/10.1109/ICICCT.2018.8473214
Lin, Y. T., Lee, M. T. S., Huang, Y. C., Liu, C. K., Li, Y.
T., & Chen, M. (2019). Prediction of recurrence-
associated death from localized prostate cancer with a
charlson comorbidity index-reinforced machine
learning model. Open Medicine (Poland), 14(1), 593–
606. https://doi.org/10.1515/med-2019-0067
Loke, K. S. (2017). Impact of financial ratios and technical
analysis on stock price prediction using random forests.
1st International Conference on Computer and Drone
Applications: Ethical Integration of Computer and
Drone Technology for Humanity Sustainability,
IConDA 2017, 2018-Janua, 38–42.
https://doi.org/10.1109/ICONDA.2017.8270396
Long, W., Lu, Z., & Cui, L. (2019). Deep learning-based
feature engineering for stock price movement
prediction. Knowledge-Based Systems, 164, 163–173.
https://doi.org/10.1016/j.knosys.2018.10.034
Nti, I. K., Adekoya, A. F., & Weyori, B. A. (2020). A
systematic review of fundamental and technical
analysis of stock market predictions. Artificial
Intelligence Review (Vol. 53). Springer Netherlands.
https://doi.org/10.1007/s10462-019-09754-z
Peachavanish, R. (2016). Stock selection and trading based
on cluster analysis of trend and momentum indicators.
In International MultiConference of Engineers and
Computer Scientists (Vol. 1, pp. 317–326).
Shah, D., Isah, H., & Zulkernine, F. (2019). Stock market
analysis: A review and taxonomy of prediction
techniques. International Journal of Financial Studies,
7(2). https://doi.org/10.3390/ijfs7020026
Sinay, L. J., Tihurua, F. R. N., & Rahakbauw, D. L. (2018).
Analisis Harga Saham Pt. Antam Tbk Berdasarkan
Harga Emas Dan Nilai Tukar Rupiah Terhadap Dolar
Menggunakan Model Autoregressive Distributed Lag.
Barekeng: Jurnal Ilmu Matematika Dan Terapan,
12(1), 53. https://doi.org/10.30598/vol12iss1pp53-
62ar364
Wen, M., Li, P., Zhang, L., & Chen, Y. (2019). Stock
market trend prediction using high-order information of
time series. IEEE Access, 7, 28299–28308.
https://doi.org/10.1109/ACCESS.2019.2901842
iCAST-ES 2021 - International Conference on Applied Science and Technology on Engineering Science
1280
