
Performance Evaluation using FLC to
Optimize the Output Power PV
Indhana Sudiharto, Farid Dwi Murdianto and Eni Wulandari
Department of Electrical Engineering, Electronic Engineering Polytechnic Institute of Surabaya, Surabaya, Indonesia
Keywords: Fuzzy Logic Controller, Solar Cell, Zeta Converter.
Abstract: The role of renewable energy is needed to support the necessity of electricity. One of the renewable energy is
solar power. Solar power is converted into electrical energy using a solar panel that produces DC electrical
energy. The unstable of the power is cause by the intensity of the sun and temperature on the surface that
fluctuate. The solution to the problem is needed a system to stabilize the power of the solar cell. A converter
with a controller in the circuit of a power stabilizer. In this paper, the selection of the converter is based on
the load requirements. The load requires a converter like a buck-boost converter. Zeta converter is the
converter that’s chosen in this paper. Zeta converter is a DC-DC converter that can produce increasing and
decreasing output voltage. But, the output voltage of zeta converter is unstable. Thus, the zeta converter
requires good control. In this paper is using Fuzzy Logic Controller. When the system is controlled by a fuzzy
logic controller the average error obtained from the system is 0.05% with the average efficiency is 99.44%
and the average time to achieve a steady state is 0.234 s. in addition to the test, this paper is comparing the
performance of the fuzzy controller with the PI controller. The error that’s obtained when the system is
controlled using a PI controller the average error of the system is 0.0026% with an average efficiency is
93.86% and the average time to achieve a steady state is 0.593s.
1 INTRODUCTION
Along with the times, electronic technology is
growing rapidly. But in reality, the more sophisticated
technology causes the consumption of electrical
energy that’s needed also increasingly large. The
increase in electricity consumption is not comparable
to the availability of fossil fuels. So, it needs
renewable energy to support the electrical energy.
Renewable energy has a lot of advantages. One of
them is friendly to the environment. Renewable
energy can also reduce waste. There are many types
of renewable energy. One of them is solar power
(Sudiharto I, 2018). A component that’s used to
convert solar power into electrical power is the solar
panel. Solar panel changes solar power into DC
electrical power. Factors that influence the power of
solar panels include the irradiation of the sun and the
temperature of the solar panel. Because the output
power is produced depends on the magnitude of the
sun’s intensity, so when the intensity of the sun
fluctuates the power that’s produced also fluctuates
(Farid Dwi Murdianto, 2018). So from the problem is
needed a system to stabilize the output power. The
converter with the controller is a circuit of a power
stabilizer. The converter is used based on the type of
load. The load requires a converter like a buck-boost
converter. Zeta converter is the converter that’s
chosen in this paper. A zeta converter is a converter
that converts electrical energy DC into electrical
energy DC with the value of the output voltage can be
higher or lower than the input voltage. This zeta
converter will transfer and stabilize the output power
of the PV (Soedibyo, 2015).
Figure 1: Block diagram system.
Figure 1 shows the overall system that is going to
be discussed in this paper. From the block diagram, it
can be seen that the zeta converter is controlled by the
Fuzzy Logic Controller. The fuzzy logic controller is
used to stabilize the output voltage of the zeta
Sudiharto, I., Murdianto, F. and Wulandari, E.
Performance Evaluation using FLC to Optimize the Output Power PV.
DOI: 10.5220/0010963500003260
In Proceedings of the 4th International Conference on Applied Science and Technology on Engineering Science (iCAST-ES 2021), pages 1267-1275
ISBN: 978-989-758-615-6; ISSN: 2975-8246
Copyright
c
2023 by SCITEPRESS – Science and Technology Publications, Lda. Under CC license (CC BY-NC-ND 4.0)
1267

converter. This paper is comparing the performance
of the Fuzzy controller with the PI controller. When
the system is controlled by the fuzzy logic controller
the average error obtained from the system is 0.05%
with the average efficiency is 99.44%. then, when the
system is controlled using a PI controller of 0..26%
with an average efficiency is 93.68% (Indhana
Sudiharto, 2019).
2 SYSTEM MODELLING
2.1 Photovoltaic Module
The solar panel is a semiconductor component that
changes solar energy into DC electrical energy. The
solar panel has a working principle which is when the
sunlight hits the surface of the solar panel, electrons,
and holes will emerge (M. Z. Efendi, 2017). Electrons
and holes that arise around the p-n junction move
towards the n layer and towards the p layer. So that
the movement of electrons and holes arise potential
differences in the load and also arise an electric
current that flows through the load (S. Islam, 2014; S.
Siddiqua, 2016). When the solar panel gets the sun’s
light the electricity that’s generated from the ability
of the solar panel device to produce voltage when it
is given a load and current through the load. Factors
that influence the output voltage of the solar panels
other than sunlight are solar radiation and the angle of
incidence of sunlight (Sattianadan D., 2017).
In this paper is using solar panel 100 WP. So we
should know the specification solar panel 100 WP.
Here are the specifications of the solar panel 100 WP
that will be used
Voltage at Maximum Power : 17.8V
Open Circuit Voltage (V
OC
) : 21.8V
Current at Maximum Power (I
mp
) : 5.62A
Short Circuit Current (I
SC
) : 6.05A
Maximum Power (P
max
) : 100WP
From the specification, it can be calculated the
component of the zeta converter.
2.2 Topology Zeta Converter
Zeta converter is one of the isolated DC to DC
converter that’s operated in CCM. Zeta converter has
a positive output voltage that operates like a buck-
boost converter (Falin, 2018). The following is a
picture of the working principle of zeta converter
when MOSFET is in “On” and “Off” conditions.
Figure 2: When MOSFET is “On State”.
Figure 2 shows that the MOSFET is in “On state”.
When the MOSFET “On state” diode is open, the
output voltage that’s connected in series with inductor
L
1b
will charge the capacitor coupling. The value of
the voltage across the inductor is +V
IN
, and the
voltage across the diode is V
IN
+ V
OUT
(Ahana
Malhotra, 2016).
Figure 3: When MOSFET is “Off State”.
Figure 3 shows that the MOSFET is in “Off state”.
When the MOSFET is in “Off state”, the diode will
be closed, so the voltage that passes through the
inductor L
1b
is the output voltage that’s connected in
parallel with the output capacitor. When the output
voltage fills the output capacitor, the voltage that will
pass through the MOSFET at “Off” condition is V
IN
+ V
OUT
. The voltage that’s through in the inductor L
1a
is the relative output voltage of the negative drain’s
MOSFET (Antonio M.S.S. Andrade, 2015).
From the circumstances which are when the
MOSFET “On state” and “Off state” can be obtained
equations that are used to determine the value of duty
and component values on the converter. Following is
the equation for calculating the duty value and
converter component value (Ashvini Admane, 2018;
U. Jayashree, 2017).
VV
V
D
outin
out
(1)
inppL IKI
)(
(2)
iCAST-ES 2021 - International Conference on Applied Science and Technology on Engineering Science
1268

swppL
in
ba
fI
DV
LL
)(
(min)1(min)1
2
1
(3
)
swinC
in
in
fVV
I
D
C
in
(min)
(4
)
swoutC
in
c
fVV
I
D
C
c
(5
)
swo
out
fV
D
C
8
(min)
(6
)
D : Duty cycle (%)
V
in
: Input voltage (v)
V
out
: Output voltage (v)
ΔI
L
: inductor current ripple (A)
f
sw
: switching frequency (kHz)
I
in
: input current (A)
L
1a (min)
: inductor 1 (uH)
L
1b (min)
: inductor 2 (uH)
C
in
: input capacitor (uF)
ΔV
cin
: input capacitor voltage ripple (V)
C
in
: input capacitor (uF)
ΔV
cc
: voltage ripple capacitor coupling (V)
C
C
: coupling capacitor (uF)
ΔV
o
: output voltage ripple (V)
C
OUT
: output capacitor (uF)
From equation 1 until 6 can be calculated the
value of the component zeta converter. Here’s the
calculation component of the zeta converter.
Input Voltage (V
IN
) : 78 V
Switching Frequency (f
SW
) : 100 kHz
Input Capacitor (C
IN
) : 42.57 uF
Inductor Current Ripple (ΔIL
(PP)
) : 6 A
Inductor 1 (L
1a
) : 47.97 uH
Coupling Capacitor (C
C
) : 22 uF
Inductor 2 (L
1b
) : 47.97uH
Output Voltage Ripple (ΔV
OUT
) : 0.025 V
Output Capacitor (C
OUT
) : 36.9 uF
Output Voltage (V
OUT
) : 204.9
2.3 Modelling of Fuzzy Controller
There are several methods in the fuzzy logic
controller. In this paper is using Sugeno’s method.
The output of the fuzzy logic controller is a linear
equation (Indhana Sudiharto S. F., 2018).
Figure 4: Block diagram fuzzy logic controller.
Figure 4 shows a block diagram of the fuzzy logic
controller. There is a process tabulation of data in the
fuzzy logic controller. In the process of fuzzy, there
are stages in the planning consisting of fuzzification,
rule base, and defuzzification (Narendiran S., 2016).
The first stage determines the membership function
using 2 inputs, namely error, and delta error.
Figure 5: Design of membership function input “error”.
Figure 5 shows the design of membership
function input “error” using 7 membership functions.
Figure 6: Design of membership function input “delta
error”.
Figure 6 shows the design of membership
function input “delta error” using 7 membership
functions.
Figure 7: Design membership function output fuzzy
controller.
Figure 7 is the design of the membership function
output fuzzy controller which will be used to
determine the results of the IF-THEN rules structure.
After designing the membership function input
error, delta error, and output the next is designing a
Performance Evaluation using FLC to Optimize the Output Power PV
1269
rule base. This rule usually uses a statement if then
that describes as action in response to various fuzzy
inputs. The rules are written in the membership
function linguistic table pattern. The table consists of
two inputs is error and delta error as well as one
output (Epyk Sunarno, 2019). These rules can be
written in the form of a matrix as shown in Table 1.
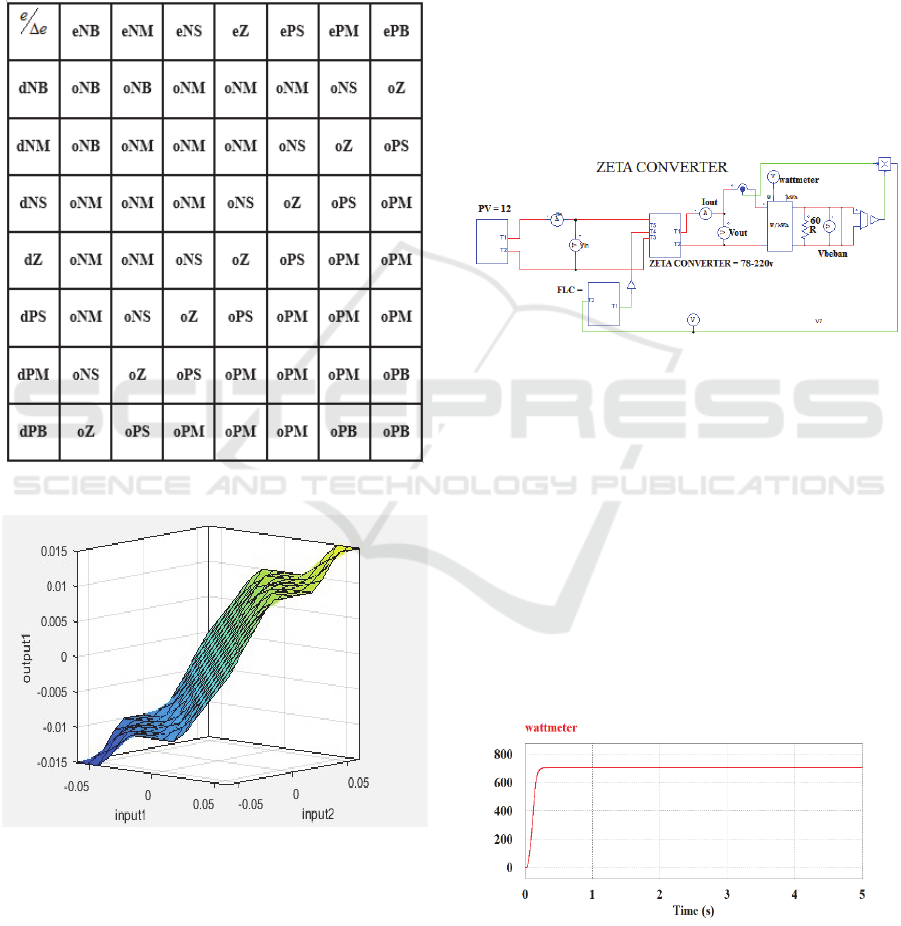
Table 1: Design of rule base fuzzy.
Table 1 shows the design results of the rule base
Figure 8: The surface of the results rule base fuzzy.
Figure 8 shows the surface that gets f/rom the
design rule base fuzzy logic controller.
3 SIMULATION AND
DISCUSSION
The performance of the Fuzzy Logic Controller is
tested using simulation. The simulation of the zeta
converter with a fuzzy logic controller is shown in
Figure 9.
In this paper, the zeta converter is simulated using
Powersim Simulation (PSIM) software.
This simulation uses a solar cell as a source of
converter. Each solar cell has a power of 100WP. This
system requires 12 solar panels with 4 solar panels is
connected in series and 3 solar panels is connected in
parallel. So the amount of the input power is 1.2 kW
with the output voltage 78 V.
Figure 9: Simulation of zeta converter with Fuzzy Logic
Controller.
Figure 9 shows the zeta converter that has been
simulated with a fuzzy controller using 12 solar
panels. In the sub-circuit, there are 3 solar panels
which is 1 solar panel represents 4 solar panels that
are connected in series. The voltage at maximum
power (V
mp
) is 17.8 V and the maximum power (P
max
)
is 100 Watts. After being simulated it can be seen the
response of the system when using controls without
disturbance or with disturbance. Besides that, it can
also be seen the comparison of responses to the
system when it is controlled using a fuzzy controller
and PI controller. In this paper, the load uses the
power setting. So, it uses the set point of power.
Figure 10: Response system when without control or using
duty manual 72.4%.
iCAST-ES 2021 - International Conference on Applied Science and Technology on Engineering Science
1270

Figure 10 is the response when without control or
using duty according to the calculation that is 72.4%.
it can be seen that at 72.4% duty, the output power is
707.49 watts. So it must be set manually according to
the set point that’s used. Figure 10 has been simulated
with the output power is 301.5 watts, 397.6 watts, and
501.3 watts. The results of this simulation can be seen
in the Table 2.
Table 2: The results of the simulation open loop system.
Table 2 is the results of the simulation when the
system is in an open-loop or without control. This
open-loop condition was initially carried out by
calculating the amount of duty when the output power
was 300 watts, 400 watts, and 500 watts. After
knowing the value of duty through the design, then it
is simulated to validate whether the value of the duty
is according to the output power. If it is not
appropriate the value of duty is changed manually by
estimating the value.
Table 2 also presents efficiency without control.
The resulting average efficiency value is 88.97% and
the average time to achieve steady-state is 0.3 s. The
resulting efficient value is not optimal so that the
control is needed to be more optimal.
Because the output power in the simulation value
is greater than the desired design, control is needed.
This paper uses a fuzzy logic controller.
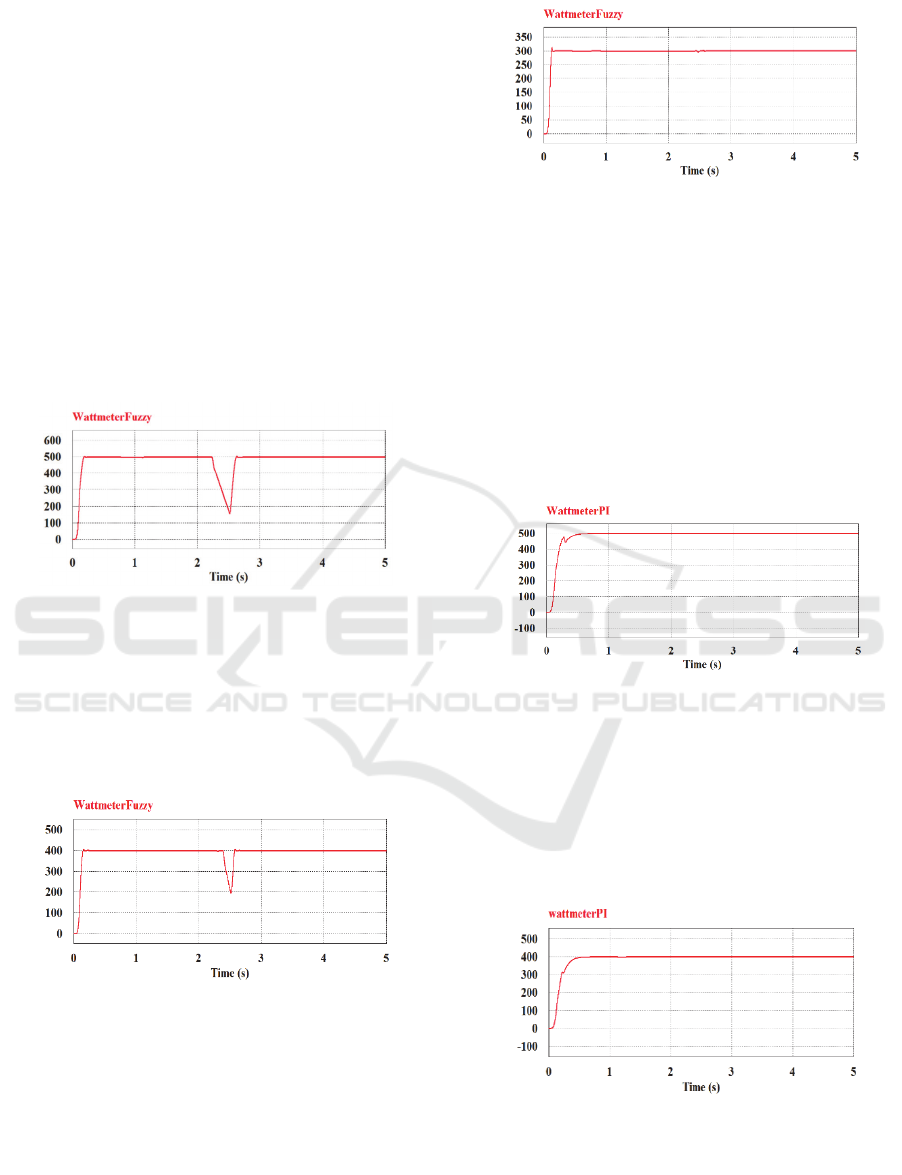
Figure 11: Response system is controlled by fuzzy at set
point 500 watts.
Figure 11 is the response when the system is
controlled by a fuzzy controller with the set point 500
watts. At the set point 500 watts, it turns out that the
value of duty obtained is smaller than the value of
design duty. So the output power on the system is
according to the set point that’s wanted.
Figure 12: Response system is controlled by fuzzy at set
point 400 watts.
Figure 12 is the response when the system is
controlled by a fuzzy controller with a set point of 400
watts. It can be seen that the wattmeter shows the
power is according to the set point that’s wanted.
Figure 13: Response system is controlled by fuzzy at set
point 300 watts.
Figure 13 is the response of the system when the
system is controlled by a fuzzy controller with a set
point of 300 watts. It can be seen the value of the
response is according to the set point value that’s
given.
The results of the simulation from figure 11,
figure 12, figure 13 can be seen in Table 3.
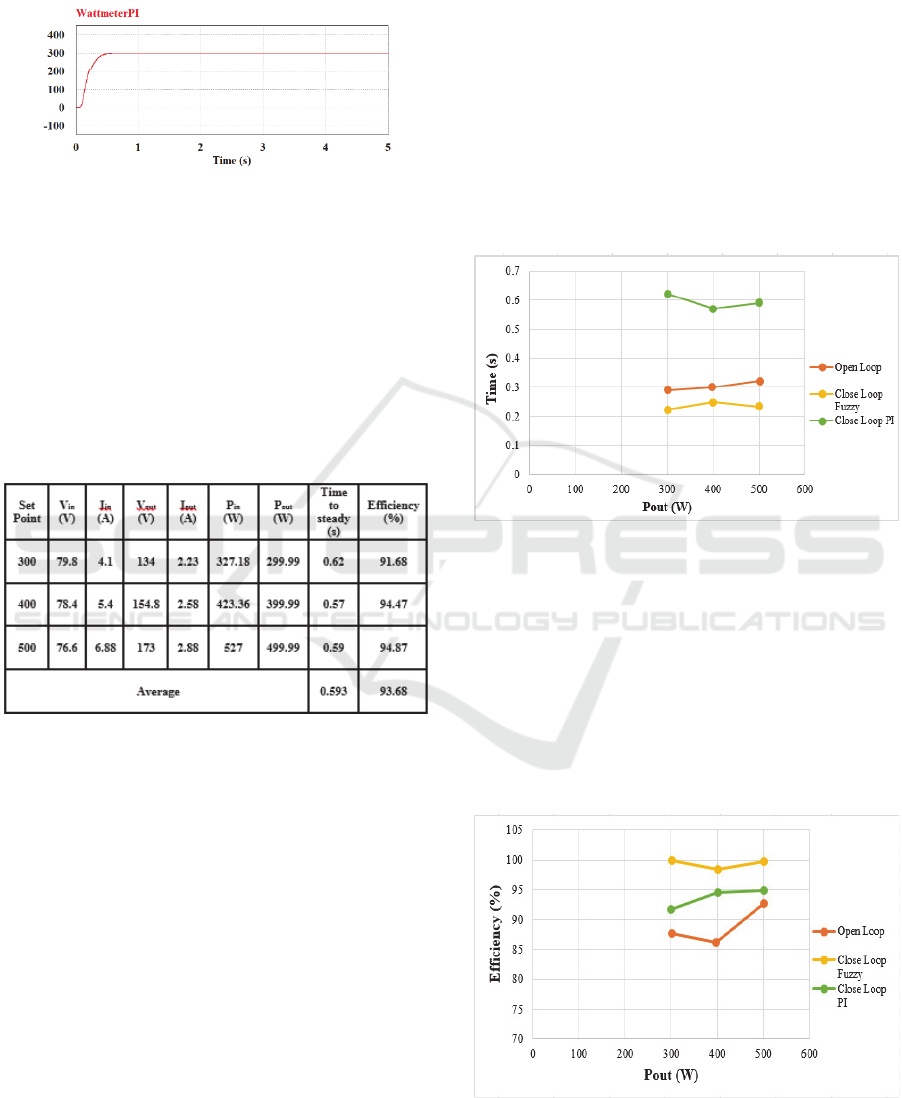
Table 3: Results of the simulation when closed-loop system
or using fuzzy logic controller.
Table 3 is the results of the simulation using a
fuzzy logic controller. The working principle of this
fuzzy controller is increasing duty if the power of the
converter is smaller than the set point. And will
reduce the duty cycle if the power of the converter is
Performance Evaluation using FLC to Optimize the Output Power PV
1271
greater than the set point. In this case, the fuzzy
controller is expected to optimize the output power so
that the resulting efficiency is better than the open-
loop system. It can be seen in the table the average
efficiency values when using this fuzzy controller are
99.37%.
In the table 3, shows the time that’s needed to
achieve a steady-state. The average time to achieve a
steady-state on this control is 0.234 seconds.
After the system is given control so that the value
of the output system is according to the set point.
Then the system is given a disturbance on the input
side. Disturbance in the form of changes in solar
irradiation. The purpose is to test the reliability of the
control that’s used. Reliability can be seen whether
when the disturbance complete, the system can return
to the initial set point.
Figure 14: Response system is controlled by fuzzy when
there’s disturbance with set point 500 watts.
Figure 14 shows the response of the system with
fuzzy control when there is disturbance. The set point
of the system is 500 watts. Disturbance is given in
seconds 2 to 2.5. So that after 2.5 seconds the system
will return to the initial set point.
Figure 15: Response system is controlled by fuzzy when
there’s disturbance with set point 400 watts.
Figure 15 shows the response when it is controlled
by a fuzzy controller when there is a disturbance. The
set point of the system is 400 watts. At the set point
400 watts, the disturbance is smaller than the
disturbance at the set point 500 watts.
Figure 16: Response system is controlled by fuzzy when
there’s disturbance with set point 300 watts.
Figure 16 is the response of the system that’s
controlled by a fuzzy controller when there is a
disturbance. The set point of the system is 300 watts.
The resulting response is not so visible because the
value of the input power system is greater than the
desired output power.
In addition to testing the reliability of control by
giving disturbance, the control that’s used in this
paper can also be tested by comparing when the
system uses the PI controller.
Figure 17: Response system when it’s controlled by PI
controller at set point 500 watts.
Figure 17 shows the response system when the
system is controlled by the PI controller. The set point
of the system is 500 watts. It can be seen in the
response that the output power is stable at a value of
500 watts. And even though it's already stable, there's
still an error.
Figure 18: Response system when it’s controlled by PI
controller at set point 400 watts.
Figure 18 shows the response of the system when
controlled by the PI controller. The second set point
of the system is 400 watts. The set point is used to
iCAST-ES 2021 - International Conference on Applied Science and Technology on Engineering Science
1272
control the power to be stable. It can be seen the
response system is stable at a value of 400 watts.
Nevertheless, there is still an error.
Figure 19: Response system when it’s controlled by PI
controller at set point 300 watts.
Figure 19 shows the response of the system when
the system is controlled by the PI controller. The last
set point of the system is 300 watts. From the set
point, it can be seen that the output power is more
stable at values close to 300 watts.
The results of the simulation from figure 17,
figure 18, figure 19 can be seen in Table 4.
Table 4: Results of the simulation close loop system PI
controller.
Table 4 is the results of the simulation when the
close loop system. This close loop system is
controlled by the PI controller. From the table can be
seen the output power is according to the set point.
Where the working principle of the PI controller is the
same as the Fuzzy Logic Controller. When the output
power is smaller than the set point, the control will
automatically increase the duty cycle. And if the
output power is greater than the set point, the control
will automatically reduce the duty cycle. So that the
output power is according to the set point and it is
expected that the error value between the set point and
the reference is small. From this small error, the
average efficiency on the system is better than the
average efficiency of the system in the open-loop
condition but this efficiency of the system is smaller
than the average efficiency in the close loop system
using a fuzzy logic controller. The average efficiency
of the close loop system that is controlled by the PI
controller is 93.68%.
Table 4 can also be seen that the average time the
control to achieve a steady-state is 0.593 seconds. So
for optimizing efficiency and also speed up time to
achieve a steady-state, on the system need the control
to be improved by using a controller that can produce
smaller errors.
From table 2, table 3 and table 4 can be compared
that the fuzzy controller can optimize output power
and produce greater efficiency than the PI controller.
And the time to achieve a steady-state on the fuzzy
controller is faster than the PI controller. The
comparison can be seen in the graphic.
Figure 20: The graph of the comparison time to achieve
steady-state when open-loop system, close loop system
using FLC, and close loop system using the PI controller.
Figure 20 shows the comparison time to achieve
steady-state when the open-loop system, close loop
system using a PI controller, and close loop system
using FLC. That graphic. From that picture, it can be
seen that the fastest time to achieve a steady-state is a
close loop system using FLC. And the longest time to
achieve a steady-state is a close loop system using PI
Controller.
Figure 21: The graph of the comparison efficiency when
open-loop system, close loop system using FLC, and close
loop system using the PI controller.
Performance Evaluation using FLC to Optimize the Output Power PV
1273

Figure 21 shows the comparison efficiency when
the open-loop system, close loop system using a PI
controller, and close loop system using FLC. From
that picture, it can be seen that the value of the biggest
efficiency is a close loop system using FLC. And the
value of the smallest efficiency is an open-loop
system.
4 CONCLUSION
In this paper, the Fuzzy Logic Controller controls the
zeta converter with the set points of 300 watts, 400
watts, and 500 watts. The results of the simulation
indicate that the system is controlled by fuzzy works
well. This can be compared when the system is
without control. The value of the output power is not
according to the calculation of output power. So the
system is controlled to the output power is stable.
When the system is controlled, it is necessary to test
the reliability of the control. Control reliability testing
is done by giving disturbance in seconds 2 to 2.5 s.
After 2.5 s, the system will return to the initial set
point. From the results of the simulation, it is shown
that the fuzzy controller requires an average time to
achieve the set point of 0.234 s. While in the PI
controller, the time that’s needed to achieve the set
point was 0.593 s and the results of the simulation
when the system without control requires an average
time to achieve the set point of 0.3 s. The average
error of the system that is controlled by fuzzy is
0.05% with the efficiency obtained by 99.37%. While
the average error of PI is 0.002% with an efficiency
obtained of 93.68%. And the last, the average error
without control is 0.453% with an efficiency obtained
of 88.97%. So the time is needed for the fuzzy
controller to achieve a steady is faster than the time
needed for the PI controller to achieve steady-state
(Anjaly DAS, 2018)Also, it can be said that Fuzzy
control is suitable for increasing the efficiency of the
zeta converter.
REFERENCES
Sudiharto, Indhana; Sunarno, Epyk; Farid Dwi; Kurniasari,
Desy Nanda (2018). Robustness Analysis of PI
Controller to Constant Output Power with Dynamic
Load Condition in DC Nanogrid System. IEEE 2018
3rd International Conference on Information
Technology, 402-405.
Farid Dwi Murdianto; Moh. Zaenal Efendi; Kukuh
Widarsono; Miftahul Azizi (2018). Robustness
Analysis of PID Controller Bidirectional SEPIC/ZETA
for Energy Management in DC Nanogrid Isolated
System, IEEE 2018 3rd International Conference on
Information Technology, Information and Electrical
Engineering, 406-411.
Soedibyo; Budi Amri; Mochamad Ashari (2015). The
Comparative Study of Buck-Boost, CUK, Sepic, and
Zeta Converters for Maximum Power Point Tracking
Photovoltaic Using P&O Method, IEEE 2015 2nd
International Journal of Int. Conference on Information
Technology, Computer and Electrical Engineering,
327-332.
Indhana Sudiharto; Epyk Sunarno; Farid Dwi Murdianto;
Eni Wulandari (2019). Robustness Analysis of PI
Controller to Optimizing the Output Power for Energy
Management in DC Microgrid System, IEEE 2019 2nd
International Conference on Applied Information
Technology and Innovation, 105-110.
M. Z. Efendi, F. D. Murdianto, and R. E. Setiawan (2017).
Modelling and Simulation of MPPT Sepic Converter
using Modified PSO to Overcome Partial Shading
Impact on DC Microgrid System, IEEE 2017
International Electronics Symposium on Engineering
Technology and Application, 27-32.
S. Islam, S. B. Azad, H. Fakir and R. Rahman, A. Azad
(2014). Development of Electric Stove for the Smart
Use of Solar Photovoltaic Energy, IEEE 2014
International Journal of Region 10 Humanitarian
Technology Conference, 94-98.
S. Siddiqua, S. Firuz, B. M. Nur, R. J. Shaon, S. J.
Chowdhury, and A. Azad (2016). Development of
Double Burner Smart Electric Stove Powered by Solar
Photovoltaic Energy, IEEE 2016 International Journal
of Global Humanitarian Technology Conference, 451-
458.
Sattianadan D., Roopam Jha, Deepak Kumar Nayak (2017).
Maximum Power Point Tracking for a Grid Connected
Photovoltaic System using Sliding Mode Control, IAES
Core International Journal of Power Electronics and
Drive Systems, Vol. 8, 1785-1792.
Jeff Falin (2014). Designing DC/DC Converter based on
Zeta Topology, analog application Journal Texas, 121-
128.
Ahana Malhotra, Shitiz Vij, Dr. Prerna Gaur, Charvi
Malhotra (2016). Design, Analysis and Performance of
Zeta Converter in Renewable Energy Systems, IEEE
2016 International Conference on Computing for
Sustainable Global Development.
Antonio M.S.S. Andrade, Luciano Schuch, Mario L. da S.
Martins (2015). Photovoltaic Battery Charger based on
Zeta Converter : Analysis, Design and Experimental
Results, IEEE 2015 24th International Symposium on
Industrial Electronics, 379-384.
Ashvini Admane, Dr. Harikumar Naidu (2018). Analysis
and Design Of Zeta Converter, International Journal
for Innovative Research in Multidisciplinary Field,
Vol. 4, 161-167.
U. Jayashree, R. H. Pearl Nightingale, S. Divya (2017).
Implementation of basic MPPT techniques for zeta
converter, IEEE 2017 3rd International Conference on
iCAST-ES 2021 - International Conference on Applied Science and Technology on Engineering Science
1274

Science Technology Engineering & Management, 601-
604.
Indhana Sudiharto, Sutedjo, Farid Dwi Murdianto, Epyk
Sunarno, Syechu Dwitya Nugraha, Ony Asrarul Qudsi
(2018). Design and Implementation Unipolar SPWM
FullBridge Inverter Using Fuzzy Sugeno in DC
Microgrid Isolated System, IEEE 2018 3rd
International Conference on Information Technology,
Information Systems and Electrical Engineering, 368-
373.
Narendiran S., Sarat Kumar Sahoo, Raa Das, Ashwin
Kumar Sahoo (2016). Fuzzy Logic Controller based
Maximum Power Point Tracking for PV System, IEEE
2016 3rd International Conference on Electrical
Energy System, 29-34.
Epyk Sunarno, Indhana Sudiharto, Syechu Dwitya
Nugraha, Farid Dwi Murdianto, Suryono, Ony Asrarul
Qudsi (2019). Design and Implementation
Bidirectional SEPIC/ZETA Converter using Fuzzy
Logic Controller in DC Microgrid Application,
IOPscience 2019 International Converence on
Engineering, Technology and Innovative Researches,
1-7.
Anjaly DAS, Khrisnakumari T. (2018). Comparison of PI
Controller and Fuzzy Logic Controller for The
Improvement of Power Factor In Smps, IEEE 2018 2nd
International Conference on Inventive Communication
and Computational Technologies, 1597-1602.
Performance Evaluation using FLC to Optimize the Output Power PV
1275
