
Feature Extraction Performance on Classified Methods for Text
Sentiment Analysis
P. M. Prihatini
a
, K. A. T. Indah
b
, G. N. A. Sukerti,
c
, I N. E. Indrayana
d
and I K. G. Sudiartha
e
Electrical Engineering, Politeknik Negeri Bali, Badung, Indonesia
Keywords: Extraction Feature, Classification Technique, Sentiment Analysis, Travel Review Text.
Abstract: The travellers reviews for hotel services displayed by the online travel agent application have drawbacks
because the text must be read one by one from all the existing reviews, and then the reader must conclude his
own impression of the hotel. Through the Sentiment Analysis technique, each review text can be classified as
a positive or negative impression automatically, where the impression can be taken into consideration by
tourist in choosing hotel and for hotel manager in improving services improvement. To produce an appropriate
classification, sentiment analysis relies on the feature extraction method and the classification technique used.
This paper evaluates the performance of Term Frequency Inverse Document Frequency as feature extraction
method in the five classification techniques: Support Vector Machine, Decision Tree, Random Forest, K-
Nearest Neighbors, and Multi-Layer Perceptron, to find out which classification technique are better
implemented to the dataset so it can produce the right impression. The evaluation results show that the
performance of Term Frequency Inverse Document Frequency is best implemented in Support Vector
Machine with a Precision value of 0.93, Recall of 1.00, and P-Score of 0.96.
1 INTRODUCTION
In order to increase the number of tourist arrivals, tour
operators make various efforts to improve the quality
of facilities and services. One of the facilities that is
of primary concern to tourists is the choice of a
comfortable and safe hotel, especially for tourists
traveling with children or the elderly. Today, tourists
can easily choose their desired hotel through an
online travel agent (OTA) application that can be
accessed via a mobile device. In the OTA application,
before deciding to stay at one of the hotels, tourists
can get information related to existing hotels. The
information provided by the application is not only
related to facilities owned by the hotel, but also
related to the experiences of previous tourists who
stayed at the hotel. This experience is displayed in the
form of asterisks, or, numeric values in a certain
range, and even, review text in narrative form. If the
a
https://orcid.org/0000-0001-7538-3235
b
https://orcid.org/0000-0003-3496-4484
c
https://orcid.org/0000-0003-4999-3368
d
https://orcid.org/0000-0001-5350-9474
e
https://orcid.org/0000-0001-7225-3259
asterisks and number values are considered not able
to fully describe the impression felt by a tourist, it is
different from the review text which is able to
describe the experience of a tourist during a vacation.
Through the review text, a tourist can tell positive or
negative things related to the facilities and services of
the hotel where he is staying. This review text can be
used as a consideration for other tourists to choose a
hotel as a place to stay.
Although the review texts available on the OTA
application are able to be taken into consideration for
tourists in choosing a hotel, but this ability still leaves
shortcomings, where a tourist must read the text of the
review one by one from all the existing reviews just
for one hotel only. Imagine if a hotel has more than
50 reviews, with the contents of the reviews having
positive and negative impressions, then how much
time should be spent to read all the reviews. In fact,
after reading all the reviews, tourists must conclude
Prihatini, P., Indah, K., Sukerti, G., Indrayana, I. and Sudiartha, I.
Feature Extraction Performance on Classified Methods for Text Sentiment Analysis.
DOI: 10.5220/0010962900003260
In Proceedings of the 4th International Conference on Applied Science and Technology on Engineering Science (iCAST-ES 2021), pages 1235-1243
ISBN: 978-989-758-615-6; ISSN: 2975-8246
Copyright
c
2023 by SCITEPRESS – Science and Technology Publications, Lda. Under CC license (CC BY-NC-ND 4.0)
1235

their own impression of the hotel. This must be done
for several hotel choices before they choose a hotel
that is considered comfortable and safe. This activity
is for some people, especially those who have a little
free time considered very boring and ineffective. As
a result, after tired of reading so many reviews, hotel
selection was done improvised and certainly risked
the desired comfort during the stay.
The development of science and technology has
resulted in a solution to the above problems in the
form of Sentiment Analysis technique. Sentiment
analysis aims to find a person's opinion expressed in
text form, where the term sentiment refers to
something that is felt by someone either based on
personal experience or his own opinion (Farhadloo
& Rolland, 2016). Through this technique, each
review text written by tourists is classified as a
positive or negative impression automatically.
Furthermore, this positive and negative impressions
become display choices for application users. For
tourists, of course, positive and negative impressions
are taken into consideration in choosing a hotel. In
addition, the impression can also be taken into
consideration for hotel managers to the quality of
facilities and services so as to increase the number of
tourists staying.
Reviews written by tourists take the form of text
in natural language, or can be said to be unstructured
text. The obstacle in analysing text like this is how to
change this text into a structured form so that it is
easily understood by computer. Therefore, this
analysis requires a text processing that is able to
produce feature values that represent the meaning of
each part of the text to the whole text. The process of
determining the value of features is called feature
extraction which is carried out after the pre-
processing process. Feature extraction is an important
process because the relevance of the feature
determines the success of the classification process in
sentiment analysis (Kumar & Bhatia, 2014). Pre-
processing text processes unstructured review text to
produce a list of structured tokens. Feature extraction
method is implemented in this token list to get the
right features in representing the unique
characteristics of positive and negative impressions.
There are many feature extraction methods available,
such as Term Frequency-Inverse Document
Frequency (TF-IDF), which commonly used in
sentiment analysis, and proven had good performance
in extracting features from dataset. Then, this features
values used in classifying process by using one or
some classifying techniques. Selecting the feature
extraction method and classifying technique that is
suitable to the input being processed must be done
carefully. Based on these, so this paper will compare
the performance of TF-IDF as feature extraction
method for five classification techniques, in order to
know which technique will achieve the best
performance in determining the right impression of
the hotels review displayed by the OTA application.
This paper uses hotels review in Indonesian taken
from several hotels in the island of Bali, considering
that Bali is an internationally known as tourism
object. The feature extraction method TF-IDF in this
paper is applied to the five classification techniques,
such as Support Vector Machine (SVM), Decision
Tree (DT), Random Forest (RF), K-Nearest
Neighbors (KNN), and Multilayer Perception (MLP).
The contribution expected to be achieved through the
results of this research is, for academics, become a
reference in conducting further research on Sentiment
Analysis; while in general, the results of this research
can be considered in adding existing facilities to the
OTA application.
2 RELATED STUDIES
TF-IDF was used as feature extraction method on
SVM and Naive Bayes (NB) for sentiment analysis in
Indonesian (Lutfi et al., 2018). There were 3,177
reviews gathered for the research, consist of 1,521
negative reviews and 1,656 positive reviews. The
results showed that SVM with linear kernel provided
higher accuracy than NB.
LDA and TF-IDF were also compared as feature
extraction methods on K-Means to extracts
representative keywords from the abstracts of each
paper and topics in English (Kim & Gil, 2019). The
results showed that K-Means and LDA had better
clustering performance and higher F-Score values
rather than TF-IDF.
LDA, TF-IDF, and Paragraph Vector were
compared as feature extraction methods on SVM for
document classification in English and Chinese
(Chen et al., 2016). The results showed that TF-IDF
and SVM achieved the best performance.
LDA as a topic-based feature extraction method
were used in classification techniques, one of them by
combining it with the SVM method (Luo & Li, 2014).
This research had classified data from 20 Newsgroups
and Reuters-21578 datasets in English. The results
showed the classification based on LDA and SVM
achieved high performance model in terms of
precision, recall and F1 measure.
Sentiment analysis was done by using four
different sentiment lexicons (Botchway et al., 2020).
This research performed sentiment analysis of 7,730
iCAST-ES 2021 - International Conference on Applied Science and Technology on Engineering Science
1236

English tweets using VADER, SentiWordNet,
AFINN, and TextBlob. The sentiment scores were
classified into three groups namely: positive,
negative, and neutral. The results showed the
VADER lexicon produced the best performance in
terms of accuracy and computational efficiency.
Deep sentiment analysis was done by
collaborating an unsupervised topic model and deep
learning model based on Long Short-Term Memory
(LSTM) Recurrent Neural Network (RNN) (Jelodar
et al., 2020). The data gathered from sub-reddits to
analyses 563,079 COVID-19–related comments in
English. This research used LDA Topic model and
Gibbs sampling for semantic extraction and latent
topic discovery. The results showed those methods
achieved 81.15% accuracy, which was higher than
traditional machine learning algorithms.
Sentiment analysis was done by combining the
supervised and unsupervised machine learning
methods (El Rahman et al., 2019). This research used
data in English from Twitter for two subjects: 7,000
tweets for McDonald's and 7,000 tweets for KFC. The
unsupervised algorithm was used to label data. The
supervised algorithm: NB, SVM, Maximum Entropy
(MaxEnt), DT, RF, and Bagging, were used to
classify data. The results showed that the MaxEnt had
the highest accuracy.
The performances of five supervised
classification methods were compared for sentiment
analysis (Renault, 2020). These methods include NB,
MaxEnt, Linear Support Vector Classifier, RF, and
MLP. This research used two datasets in English: one
balanced dataset containing 500,000 positive
messages and 500,000 negative messages, and one
unbalanced dataset containing 800,000 positive
messages and 200,000 negative messages. The results
showed that more complex algorithms were not
increase the classification accuracy, where the simple
algorithms like NB and MaxEnt might be sufficient
to derive sentiment indicators.
Sentiment analysis was done using NB and the
Lexicon dictionary for Twitter (Rasool et al., 2019).
The data used were 99,850 tweets by using the
apparel brand's name: "Nike" and "Adidas" in
English. The results showed that Adidas had more
positive sentiment than the Nike.
Sentiment analysis was used to predict and
analyse the Presidential election in Indonesia used
Twitter AP (Budiharto & Meiliana, 2018). Data
gathered from four survey institutes in Indonesia.
This research used the training set with 250 tweets,
and the test set 100 tweets. The results showed that
this method was a way simpler than other methods yet
proved to be sufficient to produce a reliable result.
The performances of five supervised
classification methods were compared for sentiment
analysis (Al-Amrani et al., 2017). These methods
include PART, DT, NB, Logistic Regression, and
SVM. Data was taken from the "SMS Spam
Collection Data Set" which contained 5,574 SMS
divided into two types: positive and negative in
English. The results showed that Logistic Regression
had the highest number of correctly classified
instances followed by SVM, NB, PART and DT.
Sentiment analysis was done using TF-IDF and
some functions in R (Widyaningrum et al., 2019). The
data used were 2,352 tweets in English. The score
process resulted in negative sentiment was 323 and
positive was 1,543. The comparison ratio between the
positive and negative opinions on the overall
approach was 4.78.
Sentiment analysis was done by comparing word
embedding and TF-IDF as the feature extraction
methods for three classification models: deep neural
networks (DNN), Convolutional Neural Networks
(CNN), and Recurrent Neural Networks (RNN)
(Dang et al., 2020). The data used was eight datasets
contained tweets in English. The results showed that
DNN technique with word embedding better than
with TF-IDF, and CNN outperformed other models,
presenting a good balance between accuracy and CPU
runtime.
Research related to hotel sentiment analysis was
done with the Naïve Bayes Multinomial method
(Farisi et al., 2019). The research data was taken from
the Business Data Database consisting of 5,000
sentences in English divided into 3,946 sentences
labelled 1 (positive) and 1,053 sentences labelled 0
(negative). The results showed the accuracy value
achieved was F1-Score an average of 91.4%.
Research related to travel agent sentiment analysis
was done with the KNN, NB and SVM (Poernomo &
Suharjito, 2019). The research data was taken from
the OTA application: Traveloka, Agoda, and Tiket,
with 70% of training data and 30% of test data in
Indonesian. The results showed the KNN method had
the best accuracy of 96.32%.
From the description above, it can be concluded
that TF-IDF were implemented on SVM have the best
performance compared to other techniques. However,
that was carried out on English texts. As for the text
in Indonesian, the performance of SVM and TF-IDF
was stated to be good too, but it was not compared to
other classifying techniques. Therefore, in this paper,
the performance of TF-IDF on classifying process
was compared on five classifying techniques for the
analysis of text sentiments in Indonesian.
Feature Extraction Performance on Classified Methods for Text Sentiment Analysis
1237
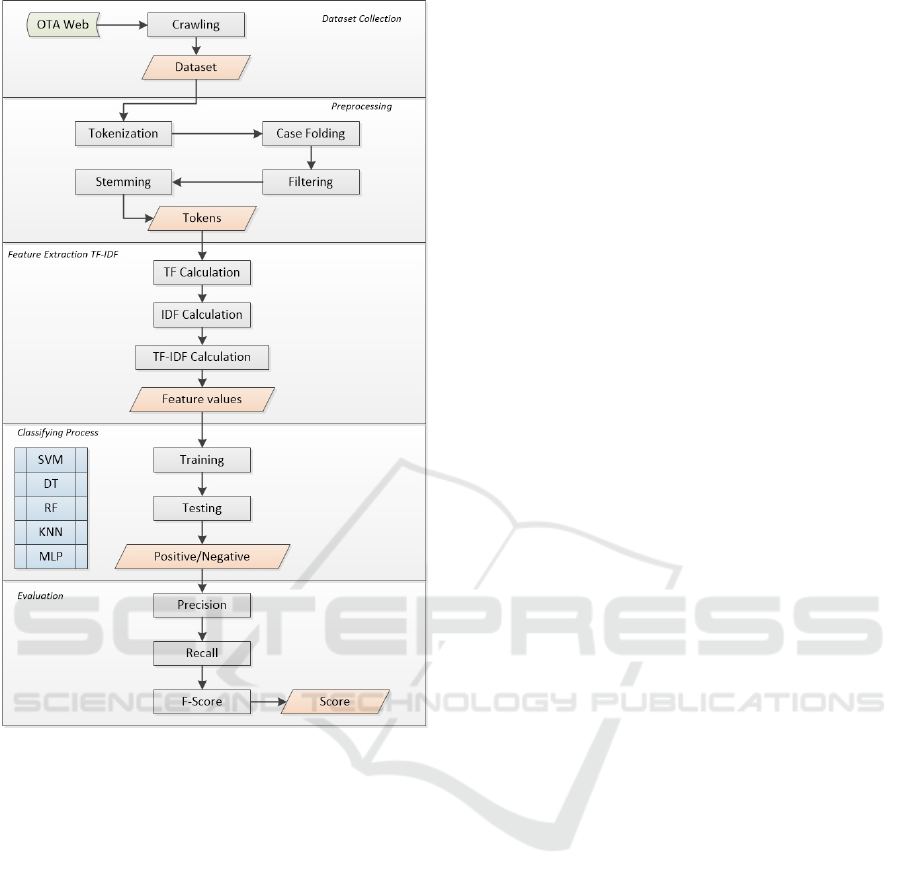
Figure 1: Research flow diagram.
3 METHODOLOGIES
The performance of TF-IDF on five classification
techniques proposed in this paper consisted of five
main processes: Crawling, Pre-processing, Feature
Extraction, Classification, and Evaluation. The flow
diagram for those process shown in Figure 1.
3.1 Dataset Collection
Hotel reviews text in Indonesian were used as dataset
in this research obtained through the OTA site.
Dataset were gathered from 15 hotels in Badung
Regency, Bali Province, because there were many
hotels that known as favourite destination for tourists
to stay. Dataset contained 600 text reviews in the last
3 years: 2018, 2019 and 2020 from the OTA site
obtained using web crawling technique. From the 15
hotels, 40 review texts were selected for each hotel,
consisting of 20 review texts with positive
impressions and 20 review texts with negative
impressions. From 600 texts, 500 texts were used as
training data, while 100 texts were used as test data.
In this process, the process of labelling text reviews
as a positive or negative impression was also carried
out.
3.2 Pre-processing
The dataset obtained from the crawling process were
unstructured text. To be classified by classification
techniques automatically, this dataset must be
changed into structured text in a pre-processing
process, which consisted of tokenization, case
folding, filtering, and stemming.
Tokenization breaks each review sentence in the
dataset into a word list (token). For example, the
sentence " Fasilitas hotel menyenangkan untuk
liburan bersama keluarga. Punya akses ke pantai dan
kolam renang. Lokasi tidak jauh dari Lippo Mal dan
Discovery. (Hotel facilities are fun for holidays with
family. Have access to the beach and swimming pool.
The location is not far from Lippo Mall and
Discovery.)" was broken down into "Fasilitas,
(Facilities)”, “hotel (hotel)“, “menyenangkan (fun)“,
“untuk (for)”, “liburan (vacation)”, “bersama
(together)”, “keluarga. (family.)”, “Punya (Have)”,
“akses (access)”, “ke (to)”, “pantai (beach)”, “dan
(and)”, “kolam (pool)”, “renang. (swimming.)”,
“Lokasi (Location)”, “tidak (not)”, “jauh (far)”, “dari
(from)”, “Lippo”, “Mal (Mall)”, “dan (and)”,
“Discovery.”. This process resulted 22 tokens.
Case folding was used to remove punctuation,
numbers, or symbols other than 'a' - 'z' in the token.
For example, the token "keluarga. (family.)" was
changed to "keluarga (family)". Additionally, this
process changed all characters to lowercase letters.
For example, the token "Fasilitas (Facilities)" was
changed to "fasilitas (facilities)". For the example of
sentences above, case folding produced 22 tokens.
Filtering was used to eliminate tokens that were
not meaningful in the text. The meaningless token
was taken from the stop word list. This research used
a stop word list published by Tala consisted of 686
stop words (Tala, 2003). For the example sentence
above, from 22 tokens, this process produced 14
tokens, by deleting token “untuk (for)”, “bersama
(together)”, “punya (have)”, “ke (to)”, “dan (and)”,
“tidak (not)”, “dari (from)”, “dan (and)”.
Stemming was used to convert tokens to their
basic forms using stemming algorithms and basic
word dictionaries. This research used the modified
Nazief-Adriani algorithm (Prihatini et al., 2017). The
dictionary used consisted of 28,528 basic words. For
example, token "menyenangkan (fun)" was changed
iCAST-ES 2021 - International Conference on Applied Science and Technology on Engineering Science
1238

to token "senang (fun)". Additionally, token that was
not recognized in the dictionary was removed. For
example, for the sentence above, this process resulted
12 tokens, by removing token "Lippo", "Discovery".
3.3 Feature Extraction TF-IDF
The tokens generated from the stemming process
must be extracted to determine the value of the
features. This research used the TF-IDF feature
extraction method based on the frequency of tokens
appearing in sentences, and the distribution of tokens
to all sentences in the dataset. The mathematical
formula of TF-IDF as follows (1) (Kowsari et al.,
2019).
W(d,t)=tf(d,t)*log(N/(df(t))) (1)
Variable W(d, t) refers to the TF-IDF value of a
token t in sentence d. Variable TF(d, t) refers to the
frequency value of the occurrence of a token t in
sentence d. Variable N refers to the number of
sentences in the dataset. Variable df(t) refers to the
number of sentences in the dataset contained the
token t.
3.4 Classification
The TF-IDF feature values from all tokens generated
in the feature extraction process were used as features
to classify sentences as positive and negative
categories. In this research, the value of the TF-IDF
features were implemented in five classification
techniques: SVM, DT, RF, KNN and MLP.
The SVM algorithm was basically designed as a
binary classifier, so this algorithm was precisely
implemented in this research which classified review
texts as positive and negative. The mathematical
formula for the Binary Class SVM algorithm as
follows (2) (Manevitz, 2001).
min 1/2 ‖w‖
2
+ 1/Vl ∑
i=1
l
(ξi-ρ) (2)
Subject to (3):
(ω∙Φ(xi)) ≥ρ-ξi; i=1, 2, …, l; ξ≥0 (3)
If w and p solved this problem, then the decision
function became (4):
f(x)=sign((ω∙ Φ (x))- ρ) (4)
DT algorithm was the earliest classification
algorithm developed for text classification. The
mathematical formula for these algorithm as follows
(5) (Mantaras, 1991). For a set of training data
consisted of p positive and n negative, then:
H(p/(n+p),n/(n+p))=-p/(n+p )(log2 p/(n+p))-n/(n+p)(log2 n/(n+p)) (5)
Attribute A was chosen with a different k value,
then the training set E was divided into k subsets (E1,
E2 ,. . . , Ek). Expectation entropy (EH) remained after
trying attribute A (with branch i = 1, 2,., K) (6):
EH(A)=∑
i=1
K
(pi+ni)/(p+n) H (pi/ (ni+pi ),ni/(ni+pi )) (6)
Information gain (I) for this attribute was (7):
A(I) = H(p/(n+p), n/(n+p))-EH(A) (7)
Random forest algorithm was an ensemble
learning method for text classification. The
mathematical formula for these algorithm as follows
(8) (Jin et al., 2020).
mg (X, Y) =av
k
I(h
k
(x)=Y)-max
j≠Y
av
k
I(h
k
(X)=j) (8)
where I(•) refers to the indicator function. After
training all the trees as a forest, classifications were
set based on a vote with the following formula (9)
(Wu et al., 2004).
δ
V
=arg max
i
∑
j:j≠j
I{r
ij
≥r
ji
} (9)
where (10):
r
ij
+ r
ji
=1 (10)
KNN was a non-parametric based classification
technique. The mathematical formula given as
follows (11) (Jiang et al., 2012).
f(x) = arg max
j
(S(x,C
j
) = Ʃ
diϵKNN
(sim(x,d
j
) y (d
j
,C
j
) (11)
Variable f(x) refers to the label of the sentence being
tested, the variable S(x,C
j
) refers to the score of
candidates i to class j.
MLP was a neural network algorithm consisted of
a set of input layers, one or more hidden layers and an
output layer. The mathematical formula for MLP with
one hidden layer given as follows (12) (Al-Batah et
al., 2018).
ỹ
k
(t) = Ʃ
j=1
nh
(W
jk
2
F(Ʃ
i=1
ni
w
ij
1
x
i
(t) + b
j
1
); 1≤j≤ n
h
, 1≤k≤ m (12)
3.5 Evaluation
The classification process produced groups of
sentences with a positive impression and groups of
sentences with a negative impression. These results
then tested with three evaluation metrics to measure
the performance of each classification technique with
the TF-IDF feature value. The metrics used in this
research were Precision, Recall, and F-Score
(Prihatini et al., 2019).
Precision refers to the ratio of the true positive
classification result to the overall positive impression
classification result. The mathematical formula as
follows (13).
P=TP/(TP+FP) (13)
Feature Extraction Performance on Classified Methods for Text Sentiment Analysis
1239
Recall refers to the ratio of the true positive
classification result to the overall results of the real
positive impressions. The mathematical formula as
follows (14).
R=TP/(TP+FN) (14)
F-Score refers to the harmony weights of
Precision and Recall, with the following
mathematical formula (15).
F-Score= (2. P. R)/(P+R) (15)
4 RESULT AND DISCUSSION
4.1 Pre-processing
The results of the pre-processing which consisted of
tokenization, case folding, filtering, and stemming
can be seen in Table 1. The review sentences were
broken down in the tokenization process to produce
11,277 tokens. All of these tokens were converted
into lowercase letters and the character was removed
(other than 'a' - 'z') in the case folding process to
produce 11,094 tokens. All of these tokens were
filtered according to the stop list dictionary in the
filtering process to produce 7,140 tokens. All of these
tokens were searched for their basic form according
to stemming algorithm and basic word dictionary in
the stemming process to produce 6,210 tokens which
were then used as unique features in the feature
extraction process.
Table 1: Pre-processing results.
Tokenization Case Folding Filtering Stemming
11,277 11,094
7,140 6,210
4.2 Feature Extraction TF-IDF
The feature extraction process with TF-IDF
calculated the value of TF, IDF, and TF-IDF. The
calculation results for five tokens with the best value
that represented a positive impression can be seen in
Table 2. These table showed five tokens from the
dataset with positive impressions that had the highest
TF-IDF values, sorted from the token "prima
(prime)", "murah (cheap)", "rapi (neat)", "senang
(happy)", and "oke (okay)". In fact, these five tokens
in Indonesian actually refer to positive things.
The calculation results for the five tokens with the
best value that represented a negative impression can
be seen in Table 3. These table showed five tokens
from the dataset with positive impressions that had
the highest TF-IDF values, sorted from the token
"retak (cracked)", "kecewa (dissapointed)", "rumit
(complicated)", "kecoak (cockroaches)", and "payah
(lame)". In fact, these five tokens in Indonesian
actually refer to negative things.
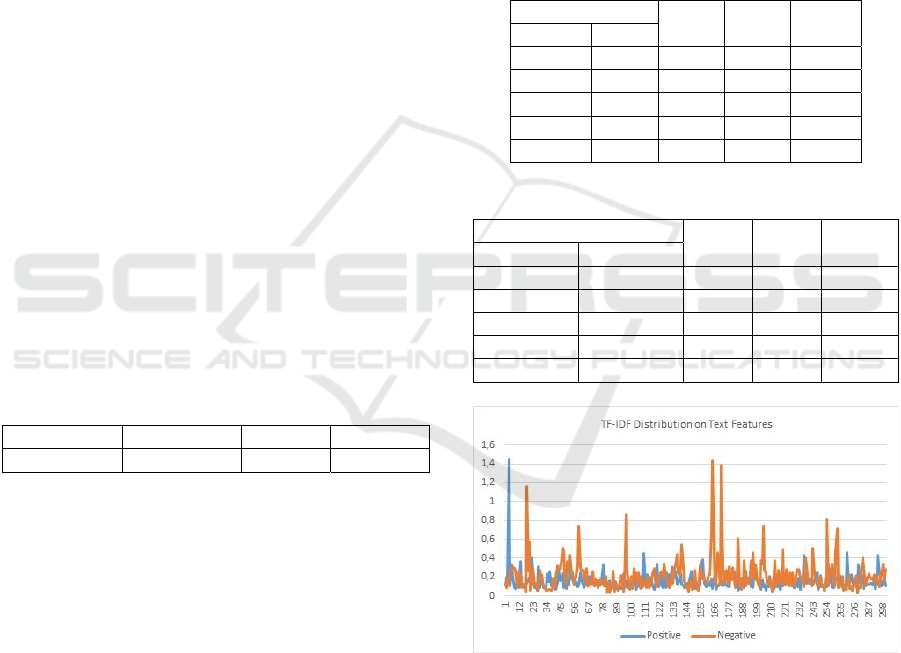
The distribution of TF-IDF values for all token
features in the dataset can be seen in Figure 2. The x-
axis represented the sentence review number, from
600 sentences divided into 300 positive sentences and
300 negative sentences. The y-axis represented the
TF-IDF value. The graph showed that there were
several sentences in the dataset had features with TF-
IDF values that tend to be higher than other sentences,
which made these sentences played an important role
as a hallmark of both categories.
Table 2: TF-IDF for best five positive features.
Token
TF IDF TF-IDF
Indonesia English
prima prime 0.2500 2.7782 0.6945
murah cheap 0.3750 1.5477 0.5804
rapi neat 0.3333 1.7368 0.5789
senang happy 0.5000 1.1249 0.5625
oke okay 0.3750 1.4994 0.5623
Table 3: TF-IDF for best five negative features.
Token
TF IDF TF-IDF
Indonesia English
retak cracked 0.6667 2.4771 1.6514
kecewa disappointed 1.0000 1.4357 1.4357
rumit complicated 0.5000 2.7782 1.3891
kecoak cockroaches 0.5000 2.0000 1.0000
payah lame 0.3333 2.7782 0.9261
Figure 2: TF-IDF distributed on text features.
4.3 Classification
TF-IDF value was used for the process of text
classification with positive and negative categories.
The classification process consisted of a training
process with 500 review sentences, divided into 250
positive sentences and 250 negative sentences, then
proceed with the test process with 100 review
sentences, divided into 50 positive sentences and 50
iCAST-ES 2021 - International Conference on Applied Science and Technology on Engineering Science
1240
negative sentences (as baseline). The results of
classification on test data with five classification
techniques were given in Table 4.
For the SVM classification, this research used
training parameters: ClassName [0 1],
NumObservations: 500, Bias: 0.0534, Model: Linear,
Function: Kernel, and Solver: SMO. The SVM
technique successfully classified 50 positive
sentences and 46 negative sentences from baseline.
For the DT classification, this research used
training parameters: ClassName [0 1] and
NumObservations: 500. The DT technique
successfully classified 46 positive sentences and 39
negative sentences from baseline.
For the RF classification, this research used
training parameters: 50 bagged decision trees,
NumPredictors: 774, NumPredictorsToSample: 28,
MinLeafSize: 1, InBagFraction: 1, and
SampleWithReplacement: 1. The RF technique
successfully classified 49 positive sentences and 45
negative sentences from baseline.
For the KNN classification, this research used
training parameters: ClassName [0 1],
NumObservations: 500, Distance: Euclidean,
NumNeighbors: 5, and Standardize:1. The KNN
technique successfully classified 50 positive
sentences and 12 negative sentences from baseline.
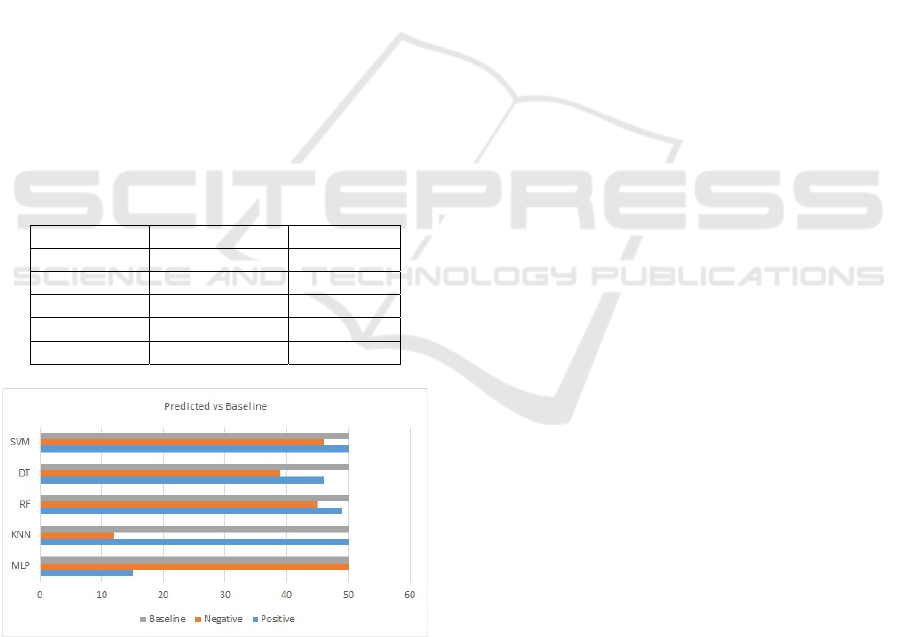
Table 4: Classification results.
Techniques Positives Negatives
SVM 50 46
DT 46 39
RF 49 45
KNN 50 12
MLP 15 50
Figure 3: The classification results against baseline dataset.
For the MLP classification, this research used
training parameters: a feed-forward backpropagation
network with 10 hidden-layers, epochs: 50, and goal:
0.01. The performance goal achieved at the 21
st
iteration. The MLP technique successfully classified
15 positive sentences and 50 negative sentences from
baseline.
The comparison between the number of positive
and negative sentences successfully classified by
each classification technique against the original
sentence (baseline) can be seen in the graph in Figure
3. The x-axis in the figure represented the number of
sentences, the y-axis represented the classification
techniques. The graph showed the SVM, DT, and RF
classification techniques had a number of
classifications that were close to the number of
original sentences, while the KNN and MLP
classification techniques had a number of
classifications that far away from the original number
of sentences.
4.4 Evaluation
The number of positive and negative sentences that
were successfully classified by each classification
technique was tested to determine the algorithm
performance of each technique using the TF-IDF
feature value. The test was carried out using the
metric Precision, Recall, and F-Score.
The test results can be seen in Table 5. The MLP
technique had the highest Precision value, meaning
that the ability of these technique to classify the
number of positive sentences that was correct to the
overall positive classification result was 1.00 (100%),
unfortunately this technique had a small Recall value
of 0.30 (30%), resulting in an F-Score only 0.46
(46%). The SVM and KNN techniques had the
highest Recall value, which means that the ability of
these techniques to classify the number of positive
sentences appropriate to the total number of original
positive sentences was 1.0 (100%), unfortunately the
KNN had a small Precision value of 0.57 (57%),
resulting in an F-Score only 0.72 (72%). The SVM
technique had the highest F-Score of 0.96 (96%),
meaning that this technique had a harmonious
Precision and Recall value which was indicated by
the value of 0.93 (93%) for Precision and 1.00 (100%)
for Recall.
A comparison of the evaluation values of the five
techniques was illustrated graphically as shown in
Figure 4. The x-axis represented the classification
technique, the y-axis represented the evaluation
values for Precision, Recall, and F-Score. From the
graph, it can be seen that SVM, RF, and DT
classification techniques had performance values that
were closed to each other; while the KNN and MLP
classification techniques had far different values of
Precision and Recall, seen from the difference in
values illustrated by the graph.
Feature Extraction Performance on Classified Methods for Text Sentiment Analysis
1241
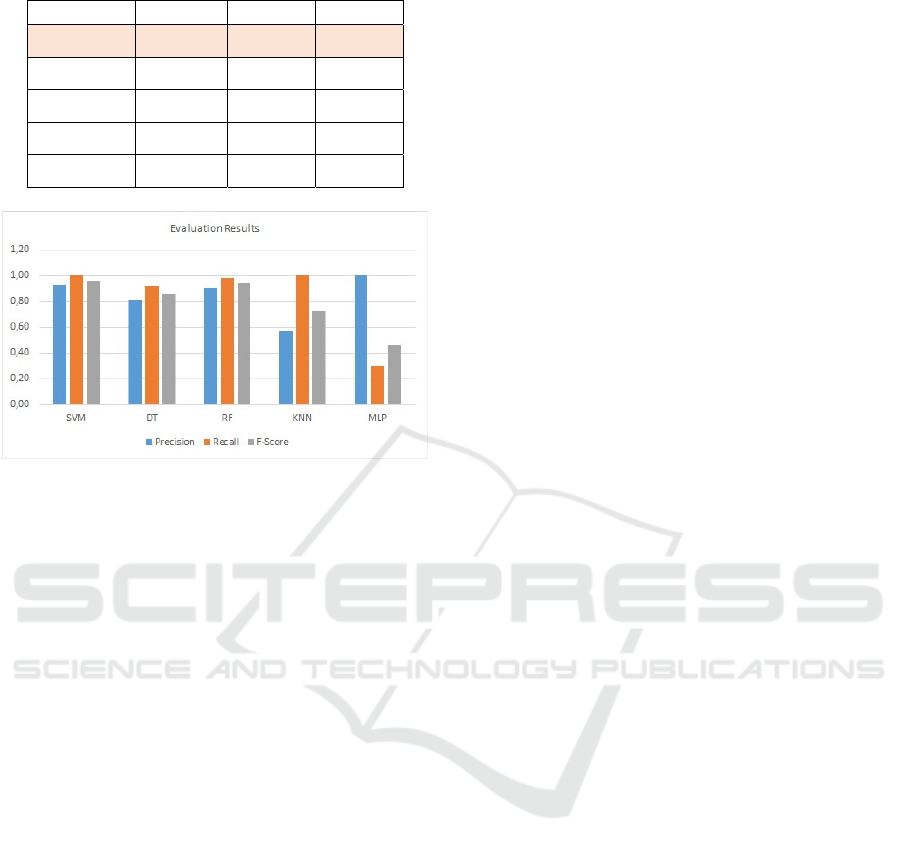
Table 5: Evaluation results.
Techniques Precision Recall
F-Score
SVM 0.93 1.00 0.96
DT 0.81 0.92 0.86
RF 0.91 0.98 0.94
KNN 0.57 1.00 0.72
MLP 1.00 0.30 0.46
Figure 4: The performance comparison of classification
techniques.
5 CONCLUSIONS
Sentiment analysis of 600 Indonesian hotel review
texts in Indonesian started from the pre-processing
stage which consisted of tokenization, case folding,
filtering, and stemming. The pre-processing results in
the form of 6,210 tokens became a unique feature that
was extracted to get its feature value using the TF-
IDF method. The TF-IDF feature values were
implemented on five classification techniques such as
SVM, DT, RF, KNN, and MLP, consisted of 500
training data and 100 test data with two categories,
positive and negative. Testing of the classification
results was carried out using the Precision, Recall,
and F-Score metrics which showed that the SVM
classification technique had the best evaluation value.
Thus, it can be concluded that for the analysis of hotel
review text sentiments in the Indonesian language,
the Term Frequency-Inverse Document Frequency as
feature extraction method has the best performance
when implemented on the Support Vector Machine
classification technique.
In future work, research will be conducted that will
compare the performance of several methods of
feature extraction of Indonesian text against several
classification techniques, so that it can be used to
better analyse the sentiment of Indonesian texts.
ACKNOWLEDGEMENTS
This paper was supported by grants of DIPA
Politeknik Negeri Bali based on Contract of Research
No. 207/PL8/LT/2020.
REFERENCES
Al-Amrani, Y., Lazaar, M., & Elkadiri, K. E. (2017).
Sentiment analysis using supervised classification
algorithms. ACM International Conference Proceeding
Series, Part F129474.
https://doi.org/10.1145/3090354.3090417
Al-Batah, M. S., Mrayyen, S., & Alzaqebah, M. (2018).
Arabic Sentiment Classification using MLP Network
Hybrid with Naive Bayes Algorithm. Journal of
Computer Science, 14(8), 1104–1114.
https://doi.org/10.3844/jcssp.2018.1104.1114
Botchway, R. K., Jibril, A. B., Oplatková, Z. K., &
Chovancová, M. (2020). Deductions from a Sub-
Saharan African Bank’s Tweets: A sentiment analysis
approach. Cogent Economics and Finance, 8(1).
https://doi.org/10.1080/23322039.2020.1776006
Budiharto, W., & Meiliana, M. (2018). Prediction and
analysis of Indonesia Presidential election from Twitter
using sentiment analysis. Journal of Big Data, 5(1), 1–
10. https://doi.org/10.1186/s40537-018-0164-1
Chen, J., Yuan, P., Zhou, X., & Tang, X. (2016).
Performance comparison of TF*IDF, LDA and
paragraph vector for document classification.
Communications in Computer and Information
Science, 660, 225–235. https://doi.org/10.1007/978-
981-10-2857-1_20
Dang, N. C., Moreno-García, M. N., & De la Prieta, F.
(2020). Sentiment analysis based on deep learning: A
comparative study. Electronics (Switzerland), 9(3).
https://doi.org/10.3390/electronics9030483
El Rahman, S. A., Alotaibi, F. A., & Alshehri, W. A.
(2019). Sentiment Analysis of Twitter Data. 2019
International Conference on Computer and
Information Sciences, ICCIS 2019.
https://doi.org/10.1109/ICCISci.2019.8716464
Farhadloo, M., & Rolland, E. (2016). Fundamentals of
sentiment analysis and its applications. Studies in
Computational Intelligence, 639(August 2018), 1–24.
https://doi.org/10.1007/978-3-319-30319-2_1
Farisi, A. A., Sibaroni, Y., & Faraby, S. Al. (2019).
Sentiment analysis on hotel reviews using Multinomial
Naïve Bayes classifier. Journal of Physics: Conference
Series, 1192(1). https://doi.org/10.1088/1742-
6596/1192/1/012024
Jelodar, H., Wang, Y., Orji, R., & Huang, S. (2020). Deep
Sentiment Classification and Topic Discovery on Novel
Coronavirus or COVID-19 Online Discussions: NLP
Using LSTM Recurrent Neural Network Approach.
IEEE Journal of Biomedical and Health Informatics,
iCAST-ES 2021 - International Conference on Applied Science and Technology on Engineering Science
1242

24(10), 2733–2742.
https://doi.org/10.1109/JBHI.2020.3001216
Jiang, S., Pang, G., Wu, M., & Kuang, L. (2012). An
improved K-nearest-neighbor algorithm for text
categorization. Expert Systems with Applications,
39(1), 1503–1509.
https://doi.org/10.1016/j.eswa.2011.08.040
Jin, Z., Shang, J., Zhu, Q., Ling, C., Xie, W., & Qiang, B.
(2020). RFRSF: Employee Turnover Prediction Based
on Random Forests and Survival Analysis. Lecture
Notes in Computer Science (Including Subseries
Lecture Notes in Artificial Intelligence and Lecture
Notes in Bioinformatics), 12343 LNCS, 503–515.
https://doi.org/10.1007/978-3-030-62008-0_35
Kim, S. W., & Gil, J. M. (2019). Research paper
classification systems based on TF-IDF and LDA
schemes. Human-Centric Computing and Information
Sciences, 9(1). https://doi.org/10.1186/s13673-019-
0192-7
Kowsari, K., Meimandi, K. J., Heidarysafa, M., Mendu, S.,
Barnes, L., & Brown, D. (2019). Text classification
algorithms: A survey. Information (Switzerland), 10(4),
1–68. https://doi.org/10.3390/info10040150
Kumar, G., & Bhatia, P. K. (2014). A detailed review of
feature extraction in image processing systems.
International Conference on Advanced Computing and
Communication Technologies, ACCT, March, 5–12.
https://doi.org/10.1109/ACCT.2014.74
Luo, L., & Li, L. (2014). Defining and evaluating
classification algorithm for high-dimensional data
based on latent topics. PLoS ONE, 9(1).
https://doi.org/10.1371/journal.pone.0082119
Lutfi, A. A., Permanasari, A. E., & Fauziati, S. (2018).
Sentiment Analysis in the Sales Review of Indonesian
Marketplace by Utilizing Support Vector Machine.
Journal of Information Systems Engineering and
Business Intelligence, 4(1), 57.
https://doi.org/10.20473/jisebi.4.1.57-64
Manevitz, L. M. (2001). One-Class-Svm for Doc
Classification.Pdf. 2, 139–154.
Mantaras, R. L. D. E. (1991). Technical Note A Distance-
Based Attribute Selection Measure for Decision Tree
Induction. Machine Learning, 6, 81–92.
Poernomo, A. D., & Suharjito, S. (2019). Indonesian online
travel agent sentiment analysis using machine learning
methods. Indonesian Journal of Electrical Engineering
and Computer Science, 14(1), 113.
https://doi.org/10.11591/ijeecs.v14.i1.pp113-117
Prihatini, P. M., Putra, I. K. G. D., Giriantari, I. A. D., &
Sudarma, M. (2017). Stemming Algorithm for
Indonesian Digital News Text Processing.
International Journal of Engineering and Emerging
Technology,
2(2), 1–7.
Prihatini, P. M., Putra, I. K. G. D., Giriantari, I. A. D., &
Sudarma, M. (2019). Complete agglomerative
hierarchy document’s clustering based on fuzzy Luhn’s
gibbs latent dirichlet allocation. International Journal
of Electrical and Computer Engineering, 9(3), 2103–
2111. https://doi.org/10.11591/ijece.v9i3.pp2103-2111
Rasool, A., Tao, R., Marjan, K., & Naveed, T. (2019).
Twitter Sentiment Analysis: A Case Study for Apparel
Brands. Journal of Physics: Conference Series,
1176(2). https://doi.org/10.1088/1742-
6596/1176/2/022015
Renault, T. (2020). Sentiment analysis and machine
learning in finance: a comparison of methods and
models on one million messages. Digital Finance, 2(1–
2), 1–13. https://doi.org/10.1007/s42521-019-00014-x
Tala, F. Z. (2003). A Study of Stemming Effects on
Information Retrieval in Bahasa Indonesia. M.Sc.
Thesis, Appendix D, pp, 39–46.
Widyaningrum, P., Ruldeviyani, Y., & Dharayani, R.
(2019). Sentiment analysis to assess the community’s
enthusiasm towards the development chatbot using an
appraisal theory. Procedia Computer Science, 161,
723–730. https://doi.org/10.1016/j.procs.2019.11.176
Wu, F., Lin, C., & Weng, R. (2004). Probability Estimates
for Multi-Class Support Vector Machines by Pairwise
Coupling. Journal of Machine Learning Research, 5,
975–1005.
Feature Extraction Performance on Classified Methods for Text Sentiment Analysis
1243
