
Experimental Investigation of the Angle Inclination Variation Effects
in Photovoltaic Array Prototype Modules
I G. A. B. Wirajati
1a
, I N. Ardita
1b
, I D. M. Cipta Santosa
1c
and I A. G. Bintang Madrini
2d
1
Mechanical Engineering Department, Bali State Polytechnic, Badung, Bali, Indonesia
2
Agricultural and Bio-System Engineering Department, Udayana University, Bukit Jimbaran, Badung, Indonesia
Keywords: Photovoltaic, Angle Inclination, Power Output.
Abstract: In this paper, the performance of photovoltaic with three arrays is investigated experimentally. The angle of
inclination 0°, 15°, 30° and 45° were tested in order to find the maximum power output. Determining the
effect of the angle of inclination combined with the placement of the cardinal directions is observed as well.
The test was carried out for seven and a half hours starting in the morning at 08.30 until in the evening at
16.00 of local time in good weather conditions. As a result, 15° of the angle inclinations provide the best value
of power 43.4 watt in average and the influence of the angle of inclination and direction of the placement, it
is obtained that the angle of 30 with the north direction gives the best power output of 55.1 watts.
1 INTRODUCTION
Indonesia, a country in the Asian region, to be precise
in Southeast Asia, is known as a tropical country, of
course, has a high level of sun exposure throughout
the year. However, the use of its exposure is still not
the main commodity that can be used optimally.
Many other tropical countries are also facing the
problems like this (Young,1989, Erdil,2008 and
Mints, 2007). The PV system, which is part of new
and renewable energy, has often been discussed,
starting from the technical level of its implementation
to its economic value and even to the institutional
level (Soteris, 2003, Kwok, 2009, Martins, 2008 and
Lu, 2015). Photovoltaic modules can produce
electricity and heat simultaneously so that they are
categorized as attractive technologies for use in
buildings (Good, 2015, Pearce, 2009 and Ruther,
2008). The installation of the PV module is
influenced by azimuth and shading, which are
basically design parameters to get maximum results
(Yoon, 2011 and Zondag, 2008).
Based on this, we try to do an experiment to take
advantage of the natural resources we have. The
purpose of this study is to find the effect of the angle
a
https://orcid.org/0000-0003-0761-071X
b
https://orcid.org/0000-0003-3391-2404
c
https://orcid.org/0000-0002-9912-629X
d
https://orcid.org/0000-0002-1315-5533
of inclination 0°, 15°, 30° and 45° and the effect of
the angle of inclination combined with the placement
of the cardinal directions on the maximum output
power of photovoltaic. As a result, the output power
of photovoltaic 43.4 watt is produced on tilt angle of
15°. Concerning the combination between tilt angle
and direction obtained the tilt angle 30° and North
side providing best output power.
2 RESEARCH METHOD
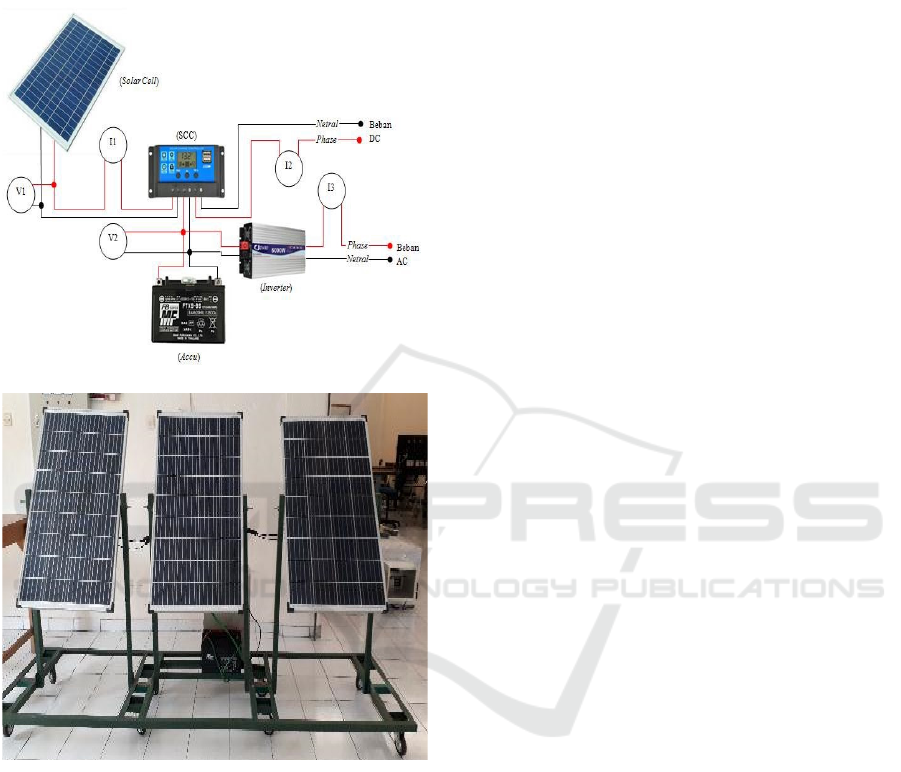
2.1 Experimental Apparatus
The experimental apparatus used in this study shows
in figure 1. It consists of three array polycrystalline
type solar panels, solar charge controller, dry battery
with a voltage of 12 V and a capacity of 100 Ah and
inverter.
2.2 Experimental Method
In research, the angles of 0°, 15°, 30° and 45° and the
cardinal directions of the north, south, east, and west
Wirajati, I., Ardita, I., Santosa, I. and Madrini, I.
Experimental Investigation of the Angle Inclination Variation Effects in Photovoltaic Array Prototype Modules.
DOI: 10.5220/0010962800003260
In Proceedings of the 4th International Conference on Applied Science and Technology on Engineering Science (iCAST-ES 2021), pages 1231-1234
ISBN: 978-989-758-615-6; ISSN: 2975-8246
Copyright
c
2023 by SCITEPRESS – Science and Technology Publications, Lda. Under CC license (CC BY-NC-ND 4.0)
1231
for the placement of the solar panel system in
obtaining maximum output power of photovoltaic.
This test is carried out using 1 polycrystalline type
solar panel (poly-crystalline) with a capacity of 100
Wp.
(a)
(b)
Figure 1: Schematic & experimental apparatus: (a) design
of experiment, (b) experiment apparatus.
The location and place for data collection in this
research was carried out at the Bali State Polytechnic
within March - August 2020.
Experimental data was carried out in 3 weeks,
where the angle of inclination was changed each
week. In the first week
The position of the solar panel module is in 0°
position then continuing to other angle position.
The data obtained by conducting direct tests on
the solar panel system, data can be retrieved after the
system works normally, then it is done for five days,
on the first day the angle is 0 ° for seven and a half
hours. On the next day the angles in each panel are
different, with the same duration of time. Recording
data is taken during sunny weather.
Data collection was carried out by following the
test procedure as follows:
1. Prepare testing and measuring tools that will
be used for data collection such as: stopwatch,
multi meter, ampere pliers, hygrometer,
thermo couple, solar power meter, protractor.
2. Ensuring all equipment are work properly.
3. Placing the modul in a place that is exposed to
direct sunlight.
4. Setting the module with the desired angle.
5. Taking measurements of voltage (V), current
(I), temperature (T) and observed in every 30
minutes starting at 08.30 am to 16.00 pm local
time
6. Then recording begins.
The above steps are repeated at each angle to be
studied.
3 RESULTS AND DISCUSSION
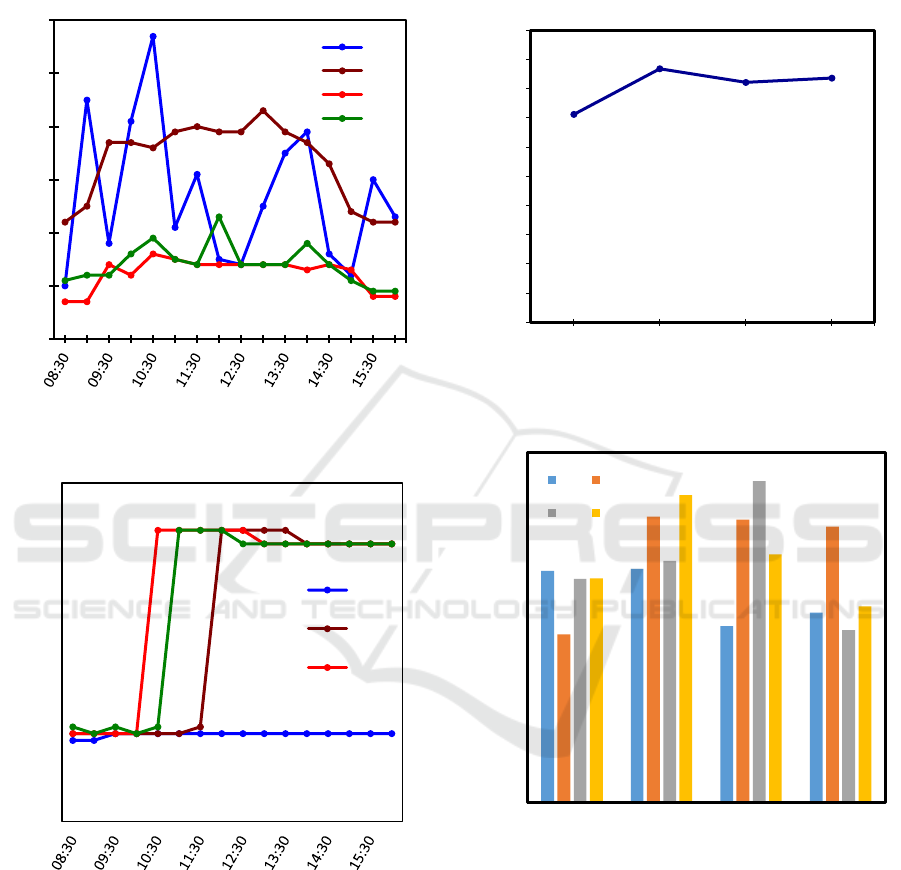
3.1 The Effect of the Angle of
Inclination on the Current Output
The effect of the angle of inclination on the direct
current (DC) released by photovoltaic, starting from
08:30 am to 16:00 pm at local time, with a
combination of 0°, 15°, 30° and 45° is be shown on
figure 2.
The graph can explain that the trends of the
current increase to the maximum limit and decreases
in line with the increasing time. The maximum value
of the current shown by all the PV tilt angle
combinations is at 10:30 pm at local time. The
maximum current value generated is at a tilt angle of
0° with a current of 5.7 A.
3.2 The Effect of the Angel of
Inclination on the Voltage Output
Figure 3 informed the effect of the angle of
inclination on the voltage released by photovoltaic,
with a combination angle of inclination of 0°, 15°, 30°
and 45° from 08:30 am to 16:00 pm at local time.
Based on the graph can explain that the trends of
the voltage increase to the maximum limit and
decreases gradually with the increasing time. The
maximum value of the voltage reached 81.7 volt at
13.30 pm and given by 15°.
There is another trend that can be seen from figure
3 when modules in horizontal position (0°). It’s
iCAST-ES 2021 - International Conference on Applied Science and Technology on Engineering Science
1232
0
5
10
15
20
25
30
35
40
45
50
0° 15° 30° 45°
Power (watt)
Position (degree)
shown almost flat. Since repeated experiment held
twice, the tendency is still the same. The closest
opinion is the pseudo motion of sun around earth may
cause this.
Figure 2: Current output in variation of angle inclination.
Figure 3: Voltage output in variation of angle inclination.
3.3 Power Value of Variation Angle
Inclination
Figure 4 shows the power value of each position from
module. Four angles inclination are selected from 0°
to 45° to determine the characteristics of the position
they are placed in.
From the graph it can be concluded that the slope
angle of 15° gives the greatest value, which means
that this position is the best for module to be applied
to give maximum results.
Figure 4: Power value of variation angle inclination.
Figure 5: The effect of the angle of inclination and direction
of placement on the module power output.
3.4 Comparison of Output Power
The graph above shows the amount of power
generated from the combination of the tilt angle and
the direction of the module placement. Data
collection starts at 08.30 until 16.00 WIB, which is
carried out from June to mid-August 2020. From the
graph, it can be seen that the angle of 30 with the
north direction gives the best power output of 55.1
watts. This can be caused by the apparent movement
0
1
2
3
4
5
6
Current (A)
Time (hour)
0°
15°
30°
45°
0
5
10
15
20
25
30
35
40
45
50
Voltage (volt)
0°
1
5°
3
0°
Time (hour)
39,7
40
30,2
32,5
28,8
49
48,5
47,3
38,3
41,4
55,1
29,5
38,4
52,7
42,5
33,6
0
10
20
30
40
50
60
East West North South
0° 15°
30° 45°
Power output (
watt
)
Experimental Investigation of the Angle Inclination Variation Effects in Photovoltaic Array Prototype Modules
1233

of the sun, which usually occurs in July and August,
where the sun tends to rise from the north.
4 CONCLUSIONS
From this research it can be concluded that by
positioning the tilt angle on the PV panel gives a
significant effect where angle 15° is the position that
gives the maximum value. In the future, the effect of
the angle of inclination will be combined with the
placement of the cardinal directions in order to
determine the effect. From observing the influence of
the angle of inclination and direction of the
placement, it is obtained that the angle of 30 with the
north direction gives the best power output of 55.1
watts.
ACKNOWLEDGEMENTS
This research was supported by the Direktorat Riset
dan Pengabdian kepada Masyarakat (DRPM) -
Ministry of Research and Technology-BRIN,
Indonesian Government, No. SPKK :
133/SP2H/AMD/LT/DRPM/2020 and (SP DIPA-
042.06.1.401516/2020) for the in cash contribution.
The authors wish to acknowledge the contributions of
Mechanical Engineering Department -Bali State
Polytechnic for the in-kind contributions. Also
Center for Research and Community Service (P3M)
for all administrative support.
REFERENCES
Moore, R., Lopes, J. (1999). Paper templates. In
TEMPLATE’06, 1st International Conference on
Template Production. SCITEPRESS.
Smith, J. (1998). The book, The publishing company.
London, 2
nd
edition.
M. Young (1989), The Technical Writer’s Handbook, Mill
Valley, CA: University Science.
E. Erdil, M. Ilkan, F. Egelioglu (2008), “An experimental
study on energy generation with a photovoltaic (PV)–
solar thermal hybrid system”, Energy, vol. 33, pp.
1241–1245.
P. Mints (2007), “PV2006: from hype to reality: after a
frenetic 2006, how will attitudes to PV change for 2007
and beyond? Refocus”, vol. 8, pp. 36-40,
K. Soteris (2003), “The potential of solar industrial process
heat applications”, Appl Energy; vol. 4, pp. 337–61.
L. Kwok, Shum, C. Watanabe (2009), “An innovation
management approach for renewable energy
deployment—the case of solar photovoltaic (PV)
technology”, Energy Policy, vol. 37, pp. 3535–3544.
F.R. Martins, R. Ru ̈ ther, E.B. Pereira, S.L. Abreu (2008),
“Solar energy scenarios in Brazil. Part two:
Photovoltaics applications”, Energy Policy, vol. 36, pp.
2865– 2877.
Y. Lu, S. Wang , K. Shan (2015), “Design optimization and
optimal control of grid-connected and standalone
nearly/net zero energy buildings”, Applied Energy,
vol. 155, pp. 463–477.
C. Good, I. Andresen, A. G. Hestnes (2015), “Solar energy
for net zero energy buildings – A comparison between
solar thermal, PV and photovoltaic–thermal (PV/T)
systems”, Solar Energy, vol. 122, pp. 986–996.
J.M. Pearce (2009), “Expanding photovoltaic penetration
with residential distributed generation from hybrid
solar photovoltaic and combined heat and power
systems”, Energy, vol. 34, pp. 1947–1954.
R. Ru ̈ther, P. J. ́ Knob, C. D. S. Jardim, S. H. ́Rebechi,
(2008), “Potential of building integrated photovoltaic
solar energy generators in assisting daytime peaking
feeders in urban areas in Brazil”, Energy Conversion
and Management, vol. 49, pp. 1074–1079.
S. Yoon, S. Tak, J. Kim, Y. Jun, K. Kang, J. Park (2011),
“Application of transparent dye-sensitized solar cells to
building integrated photovoltaic systems”, Building
and Environment, vol. 46, pp.1899-1904.
H.A. Zondag (2008), “Flat-plate PV-thermal collectors and
systems. A review”, Renew Sustain Energy Rev; vol.
4, pp. 891–959.
iCAST-ES 2021 - International Conference on Applied Science and Technology on Engineering Science
1234
