Design of Windstorm Disaster Early Warning System based on IoT
and Hall Effect Sensor in the Critical Area Location
Herman Yuliandoko
1
, Vivien Arief Wardhany
1
, Subono
1
, Sholeh Hadi Pramono
2
and Ponco Siwindarto
2
1
Informatic Engineering Dept., State Polytechnic of Banyuwangi, Kawang, Banyuwangi, Indonesia
2
Electrical Engineering Dept., Brawijaya University, Malang, East Java, Indonesia
Keywords
:
Windstorm, Critical, Warning, IoT, Quickly.
Abstract: One of the biggest natural disasters in Banyuwangi is windstorm and it had brought in loss many property and
life. However, the handling information of windstorm to the people in Banyuwangi still uses conventional
way and it made warning information late in people. So they didn’t have time to prepare and protect their
property or life from windstorm. Therefore it is needed a system that can provide windstorm information
quickly, accurately and widely. In this research, it was designed an early warning system (EWS) of windstorm
by placing sensors in the critical locations. The placing of sensor in the right place made the windstorm
detections more accurate. This research also used IoT technology, web site and android application to inform
the wind speed, direction and warning notification quickly.
1 INTRODUCTION
Indonesia is a tropical country with islands and
waters. Besides that Indonesia also have unique
geographic position between two continents Asian -
Australia and two ocean Indian - Pacific. Thus, the
territory of Indonesia is in a cross position, which
has significance in relation to climate and economy
(Nisa, 2014). That position also influence to the
Indonesian
atmosphere which the changing of
Indonesian atmosphere is caused by ITCZ (Inter
Tropic
Convergence Zone), ENSO (El Nino Sothern
Oscillation) and MJO (Madden Jullian Oscillation.
The changes in the atmosphere will bring climate
change, weather and wind in the territory of
Indonesia
(BNPB, 2017).
The extreme change of climate, weather and wind
will bring disaster and one of the most frequent
disasters in Indonesia is windstorm. The windstorm
disaster brought great destruction and one of the
towns that was often hit by a windstorm disaster was
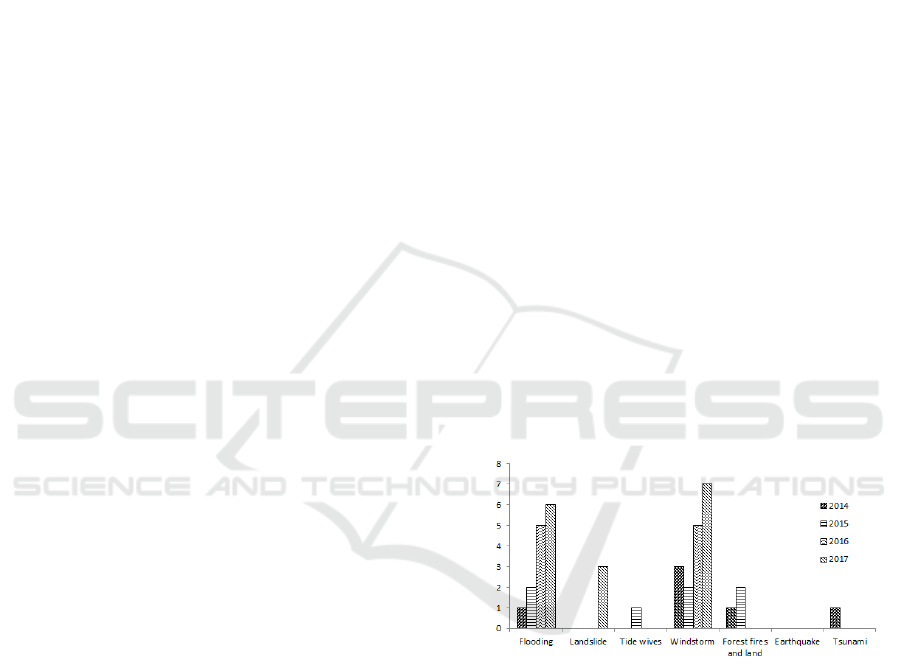
Banyuwangi. The disaster trend in Banyuwangi also
increase especially windstorm as shown in Figure 1.
The disaster management is very important but so
far in Indonesia majority of disaster management
still use traditional way. It is also in Banyuwangi,
east Java, Indonesia, the disaster management still
focused on the disaster impact (Yuliandoko et al.,
2019).
Figure 1: Disaster Trend in Banyuwangi (Hashiguchi et al.,
2013).
One of important aspect on the disaster
management is mitigation. In the mitigation there is
early warning system as a critical life saving tool for
floods, droughts, windstorm and other hazards. The
effective Early warning system (EWS) contains four
component (1) detection, monitoring and fore-
casting the hazards; (2) analysis of risks involved;
(3) dissemination of timely and authoritative
warnings;
and (4) activation of emergency
preparedness and response plans (World, 2009).
Because It is very useful for human life so it is
needed to make any research and improvement on
EWS. Research on EWS in Indonesia is still rare
Yuliandoko, H., Arief Wardhany, V., Subono, ., Hadi Pramono, S. and Siwindarto, P.
Design of Windstorm Disaster Early Warning System based on IoT and Hall Effect Sensor in the Critical Area Location.
DOI: 10.5220/0010962600003260
In Proceedings of the 4th International Conference on Applied Science and Technology on Engineering Science (iCAST-ES 2021), pages 1217-1224
ISBN: 978-989-758-615-6; ISSN: 2975-8246
Copyright
c
2023 by SCITEPRESS – Science and Technology Publications, Lda. Under CC license (CC BY-NC-ND 4.0)
1217

especially on the small city, and the purpose of this
research is to develop detection and monitoring
windstorm by using technology IoT
with reposition
windstorm sensor on the critical
location in
Banyuwangi city.
Research on web base information of natural
hazard in Aceh province was done by Nasaruddin,
Khairul Muhadi, M. Dirmansyah and Dedi
Yuliansyah. Their research made a conceptual
design
and the development of prototype for ANHIS
(Aceh Natural Hazards Information System). The
main
purpose of ANHIS was to visualize many
natural
hazards maps and disseminate information of
the
hazardous areas for disaster agencies, researchers
and communities in order to help them act on
warning issue (Munadi et al., 2011). There are many
kind of EWS due to the
purpose of the detection of
hazard, in the
“Development of an operational
coastal flooding early warning system”, researcher
made an early warning system to mitigate the loss of
life and property from coastal flooding. The focus of
this
research to develop a coastal flooding warning
system
by integrating existing sea-state monitoring
technology, numerical ocean forecasting models,
historical database and experiences (Doong et al.,
2012). Many EWS research on flooding detections,
one of that is
“Integration Method of Local-global
SVR and Parallel Time Variant PSO in Water Level
Forecasting for Flood Early Warning System”. The
proposed integration method of Parallel Time
Variant
PSO (PTVPSO) and Local-Glob al Support
Vector Regression (SVR) is used to forecast water
level.
Implementation in this study combine SVR as
regression method for forecast the water level,
Local- Global concept take the role for the
minimization for the computing time, while
PTVPSO used in the SVR to obtain maximum
performance and higher accurate
result by optimize
the parameters of SVR (Soebroto et al., 2018).
Research on flooding detection also can be done
trough monitoring of DAM water level and velocity
of water. By monitoring these parameters can get
information that the flood is happening. The data
from sensor will send to smart phone android by
using microcontroller ESP8266 (Yuliandoko et al.,
2017). So the EWS today also use smart technology
to spread the information to the
people with more
accurate and quickly.
Development of information technology after
computer and internet is Internet of Things (IoT)
(Bing, 2014). Today the application of IoT is very
wide and interesting, because by using IoT can
connect all
goods with internet through information
sensing
device.
This ability will help people to control or monitor
other places via the internet. Therefore the
application of IoT in the disaster management will
be very useful for human being. This research also
use
IoT to send data of hazard especially windstorm
speed, direction and level of danger to the people.
By using this system the people will get a danger
notification to their smart phone so they can prepare
themselves from danger of windstorm disaster. This
system also supported by web and android
application to inform the disaster notification. To
make accurate
the windstorm data, sensors are
placed in critical and potential of windstorm occur in
Banyuwangi area.
2 RESEARCH METHOD
2.1 Research Steps
Research of “Windstorm Disaster Early Warning
System on Critical Area Detection Method by
Using IoT Technology” is done on the several step:
•
Building the windstorm sensor detections
Design of sensor detections has relation with
flow of detection and accuracy of detections.
In this research was made to be able to detect
windstorm
speed, windstorm direction and
rainfall. After
detect speed and direction this
system will make a
classification of hazard level
of windstorm.
•
Web and android based.
This system also use web and android based
to
inform the measurement of sensor to the
people.
The advantages of this system are easy
to monitor by people by using android
application.
•
Classify of the critical location windstorm
disaster
in Banyuwangi
The critical location is very important to make
an accurate detection with early warning
system.
This critical location based on BNSP
(National
Board for Disaster Management)
Banyuwangi
district data.
•
Experiments result
After all of system connected and running
well, the experiments was done on the State
Polytechnic of Banyuwangi LAB to make
sure
that the system can be implemented in
the real
condition.
iCAST-ES 2021 - International Conference on Applied Science and Technology on Engineering Science
1218
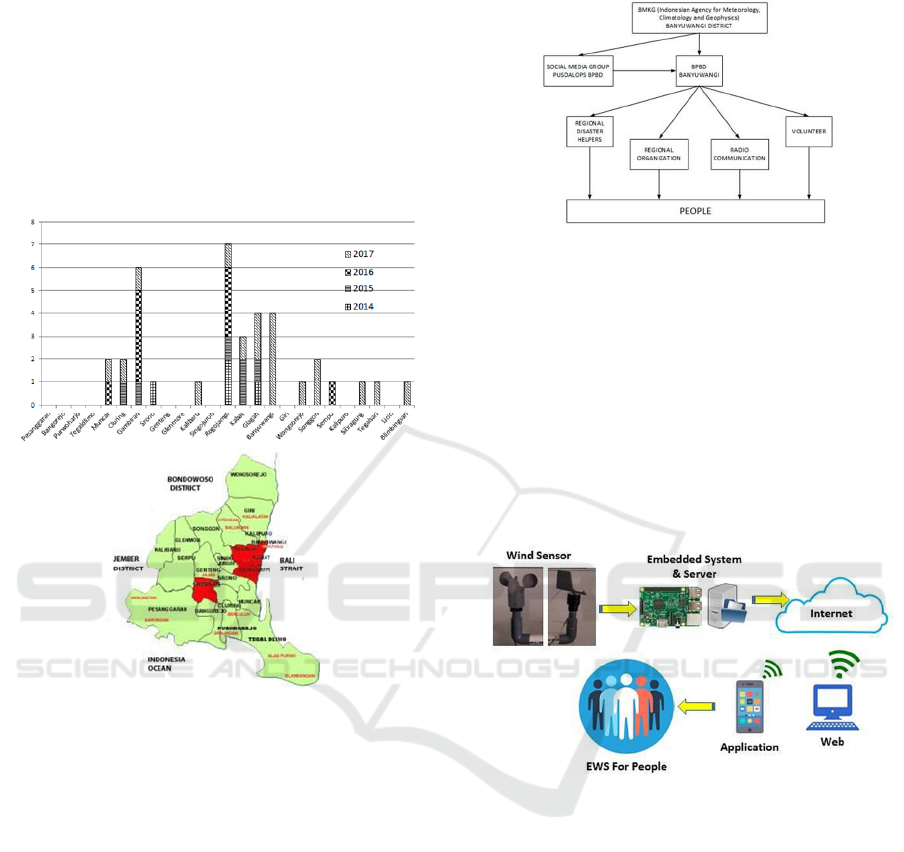
2.2 Accident Area Mapping
Banyuwangi consists of 25 sub-districts with
different characteristic of geographic. Although in
some sub-districts accidents often occur due to strong
wind. The accident was usually in the form of fallen
trees, damaged agricultural land or damaged houses.
Based on BNPB (National Board for Disaster
Management) Banyuwangi district, there were four
sub-districts had high frequency of accident.
Figure 2: Accident Area Mapping in Banyuwangi
(Bencana, 2015).
Refer to Figure 2, Sub-Districts Gambiran,
Rogojampi, Banyuwangi and Glagah had highest
frequency windstorm occur. Therefore these area
become critical area detection of windstorm in
Banyuwangi. This localization of area detection was
very important because these areas had great potential
for windstorm events in the region each year. The
critical location will be the location of windstorm
disaster sensor.
2.3 Disaster Warning System Propose
The most important in the warning system is fast
and accurate information. If the people get an early
accurate information, they can prepare to safe their
live or property. In the BNSP Banyuwangi District
have a mechanism to inform windstorm disaster to the
people as shown in Figure 3, however the mechanism
is
too complicated and it can cause the delivery of
late
information to the people.
Figure 3: Current BNSP Flow Diagram of Early Warning
System in Banyuwangi (Bencana, 2015).
Therefore it is needed a simple information flow to
the people with a simple way but accurate
information. The simple and fastest sharing
information today is internet, by using internet
network the information can be received by the
people in the fastest way. Beside that an android
application can make the people easy to get detail
information. The application of this method is an
EWS (Early Warning System) application as shown
in Figure 4.
Figure 4: EWS of Windstorm Design System.
3 DEVELOPMENT PROCESS
3.1 Embedded System Preparation
The development of the computer world is
currently so fast and one of them is embedded system.
Embedded system or mini computer is smart
equipment which has microcontroller and the
programming system inside. Embedded system also
has ability to control and monitor the performance of
equipment (Susanti et al., 2018).
Design of Windstorm Disaster Early Warning System based on IoT and Hall Effect Sensor in the Critical Area Location
1219
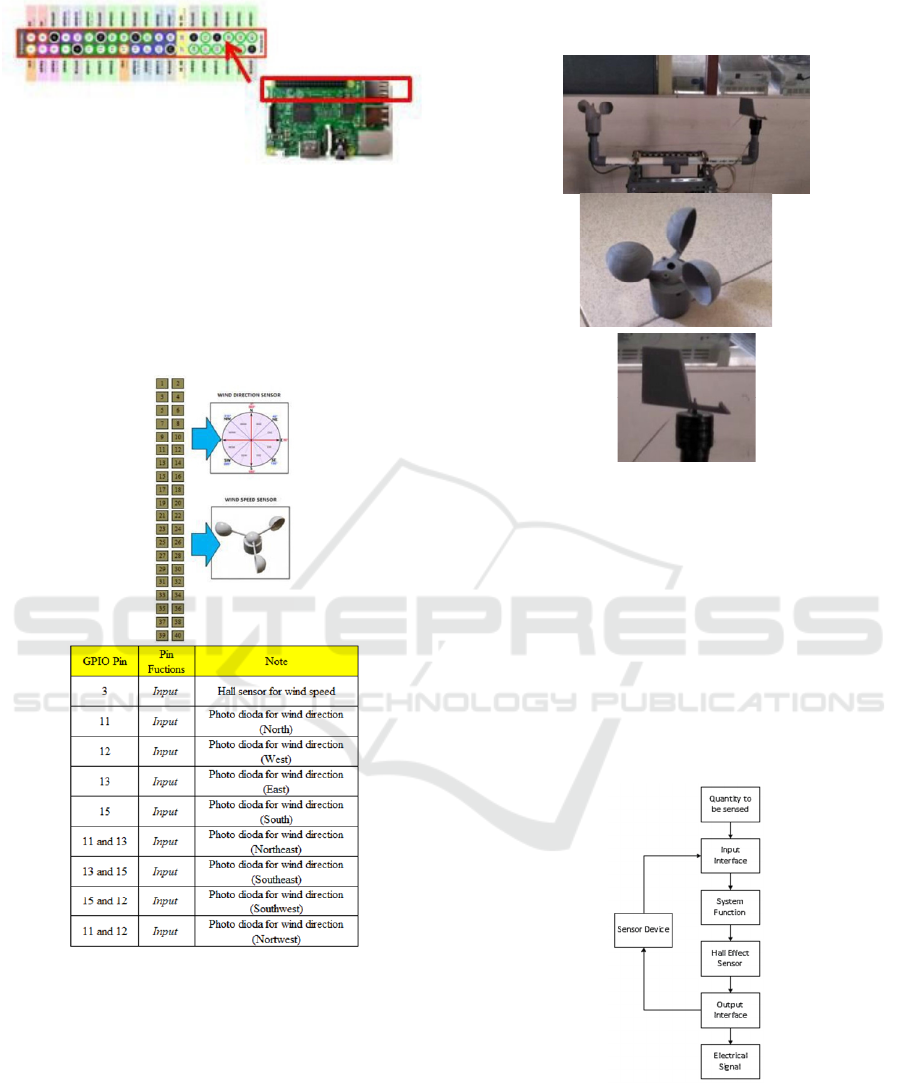
Figure 5: General Purpose Input Output(GPIO) Raspberry
pi 3 pin schematic diagram (Vatsal and Bhavin, 2017).
In this research use Raspberry pi 3 for embedded
system because Raspberry pi 3 has been equipped
with wireless network. The sensor connections to the
Raspberry pi 3 as shown in Figure 5 and Figure 6
below diagram.
Figure 6: Raspberry pi 3 to sensor diagram.
3.2 Sensors Preparations
There were two main sensors in this system, wind
speed sensor and wind direction sensor.
3.2.1 Wind Speed Sensor and Wind
Directions Sensor
This sensor use bowl propeller to catch wind
movement and convert it to the wind speed
measurement. The bowl propeller was made by using
3D printer with filament material as below Figure
7 design picture.
Figure 7: Wind Speed and Direction Sensor.
In this research use Hall Effect to change the
rotation of bowl propeller become measurement of
wind speed. In the Hall Effect sensor there is a
mechanism to detect the magnetic field come near to
or keep off from the sensor. Then the changing will
be changed to be voltage pulse according to the
frequency of come near to or keep off from the sensor.
Finally the frequency will show a lot of rotation of a
wind speed sensor which will be changed in Km/h.
The block diagram flow of detections is shown in
Figure 8.
Figure 8: General Sensor Block Diagram Based on The
Hall Effect (Krishna and Abraham, 2014).
The Wind Direction sensor used photodiode,
which have a characteristic the resistance will
changethe value if there are light on the photodiode.
The resistance of the photodiode depends on light
iCAST-ES 2021 - International Conference on Applied Science and Technology on Engineering Science
1220
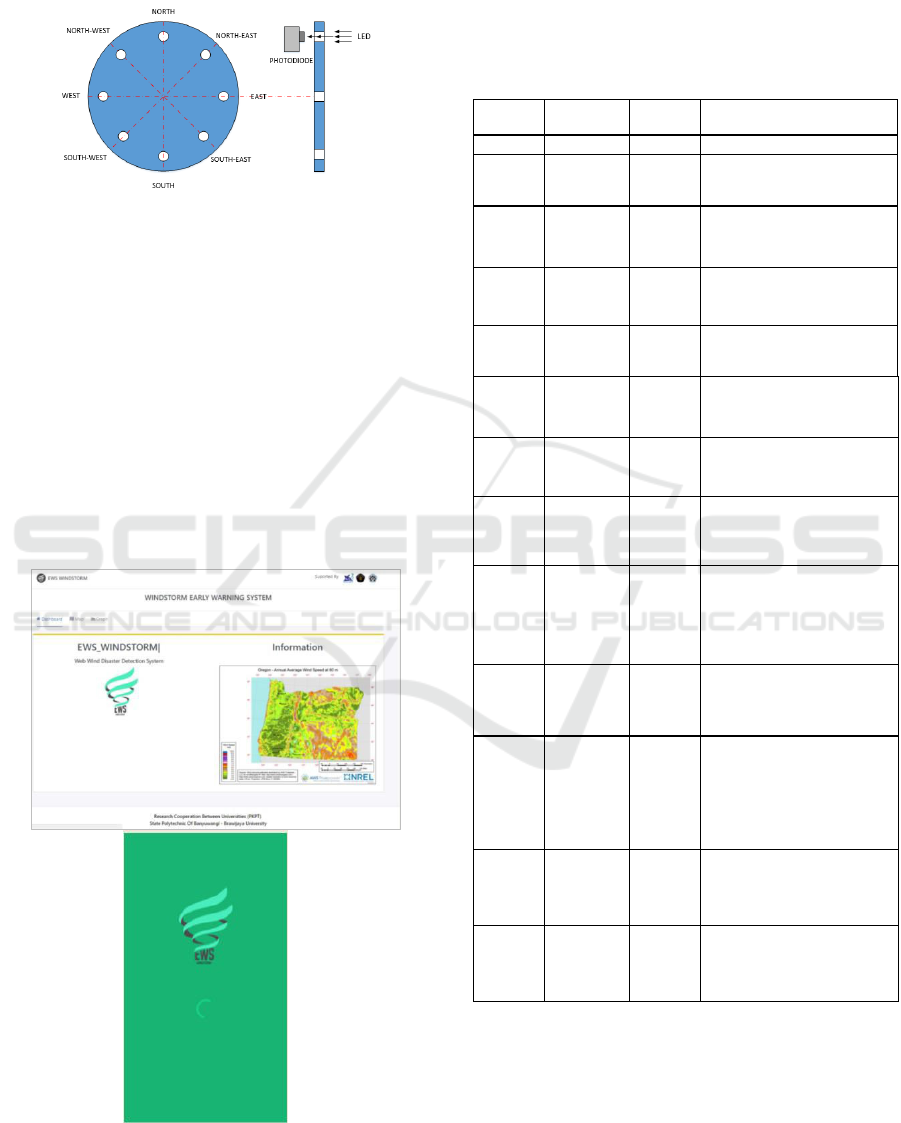
intensity received. Figure 9 explain that the sensor
used to indicate the direction of the wind by LED
as lighting source and photodiode mechanism.
Figure 9: Photodiode, LED and wind direction.
3.3 Web and Application
This research also takes a web and android
application to show the data sensor and give
notification as early warning of windstorm to the
people as shown in Figure 10. In this web there were
location of sensor windstorm, wind speed graph,
highest wind speed, information-tips and data report.
The information of windstorm was not only on web
but in the android application also. The purpose this
application was to give information to the people
about wind speed, direction and windstorm early
warning system by using internet connection.
Figure 10: Web Dashboard of EWS and Splash Screen
Application EWS.
4 EXPERIMENT
There are some levels of wind speed based on
Beaufort standard as mentioned in Tabel 1 below
(Stewart, 2008):
Table 1: Beaufort Wind Scale and State of the Sea.
Beaufort
Numbe
r
Descriptive
term
m/s Appearance of
the Sea
0 Calm 0 Sea like a mirro
r
1 Light Air 1.2
Ripples with appearance of
scales; no foam
crests.
2 Light
Breeze
2.8
Small wavelets;
crests of
glassy appearance, not
breaking
3 Gentle
breeze
4.9
Large wavelets;
crests begin
to break; scattered whitecaps.
4 Moderate
breeze
7.7 Small waves, becoming
longer;
numerous whitecaps
5
Fresh
breeze
10.5
Moderate waves, taking
longer to form; many
whitecaps; some
spray
6
Strong
breeze
13.1
Large waves forming;
whitecaps everywhere; more
spray
7
Near gale
15.8
Sea heaps up;
white foam
from
breaking waves begins
to be
blown into streaks.
8
Gale
1.8
Moderately high waves o
f
greater length; edges of crests
begin to break into spindrift;
foam is blown in well-
marked streaks.
9
Strong gale
22.1
High waves; sea
begins to
roll;
dense streaks of foam;
spray may reduce visibility
10
Storm
25.9
Very high waves with
overhanging crests; sea takes
white appearance
as foam is
blown in very dense
streaks;
rolling is heavy and visibility
reduced
11
Violent
storm
30.2
Exceptionally high waves; sea
covered with white foam
p
atches; visibility still more
reduced
12
Hurricane
35.2
Air is filled with foam; sea
completely white
with driving
spray; visibility greatly
reduced
Windstorm is a strong wind which has a potential
to destroy any kind around it. In BNPB Banyuwangi
district, windstorm has speed 50 Km/h, it’s mean
this categorize in the Beaufort number 7. That why
in this
research danger notification of windstorm
was sent to
the people when wind speed above 50
Km/h.
Design of Windstorm Disaster Early Warning System based on IoT and Hall Effect Sensor in the Critical Area Location
1221
4.1 Experiment Method
The experiment was done in the Lab Hardware,
State Polytechnic of Banyuwangi. And it was done
with below scenario.
•
The experiment was done to check the
functionality of the EWS on the web based and
android application based.
•
Windstorm detection experiments were done on
there step trial with air compressor blower as
windstorm resource.
•
The windstorm detections based on critical
sensor location and in this trial used one critical
location was Rogojampi area.
•
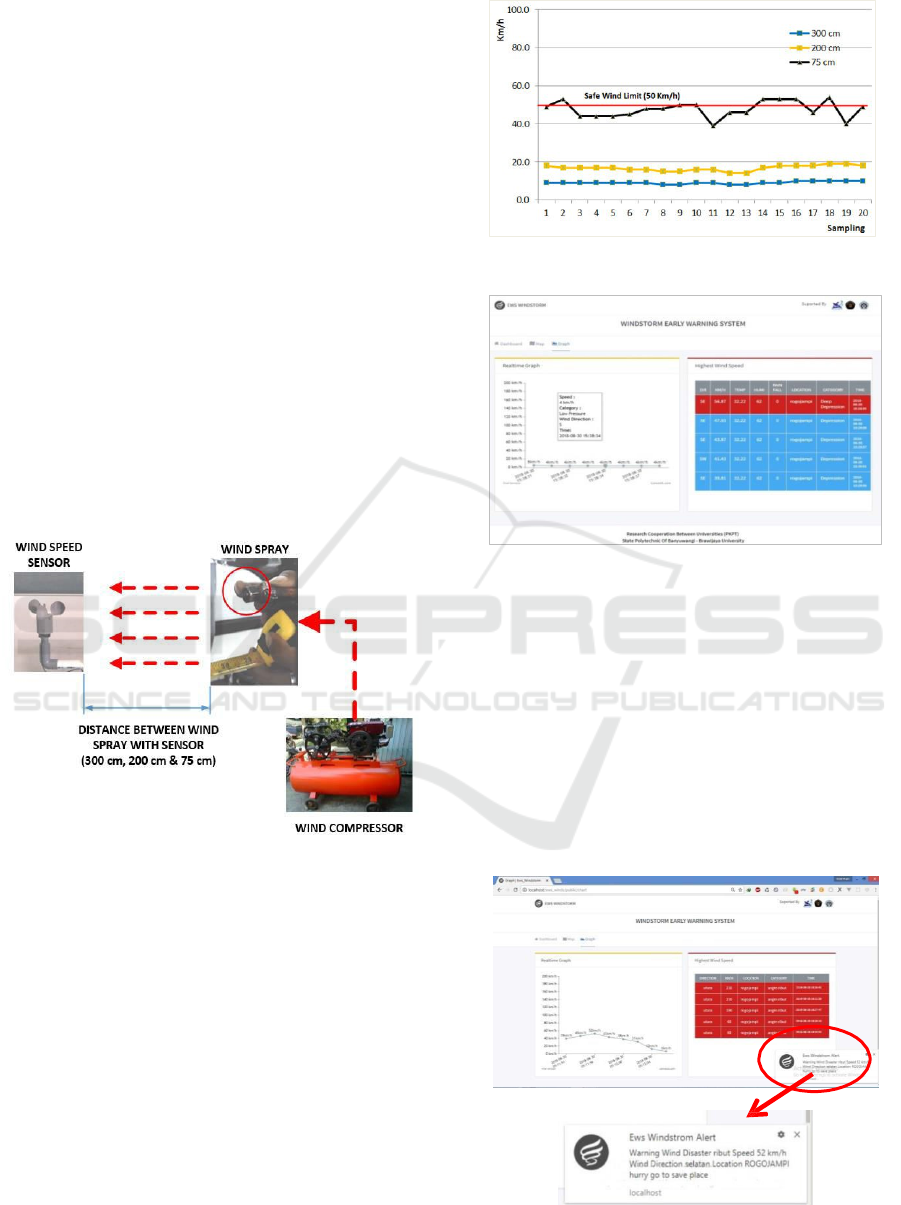
The there steps of trial based on sensor with
wind compressor spray distance to measure wind
speed. These distances were 300 cm, 200 cm and
70 cm.
5 RESULT AND ANALYSIS
Figure 11: Wind Flow Trial.
In this research functional test by using wind flow
trial as descraibed in Figure 11 with two main
categories, first category was low speed wind (with
distance 200 cm & 300 cm) and second category
was high speed wind (with distance 75 cm). The
wind spray compressor blow the wind directly to the
wind speed sensor surface and found as below result.
Figure 12: Wind Speed Result.
Figure 13: Graphic speed, Critical Location of Windstorm
and Direction.
Refer to Figure 12 and Figure 13, that wind
sensor could
detect wind speed in low speed
category and high speed category. The red line in the
graph on the 50 Km/h was safe wind limit of speed
and trial with distance 75 cm made result until over
safe wind limit
of speed. Its mean this sensor could
detect wind speed until Windstorm category. On the
high speed (windstorm category) was also detect and
give
warning notification as early warning system to
the
people as shown in Figure 14 below:
Figure 14: Web Based, EWS Warning System.
iCAST-ES 2021 - International Conference on Applied Science and Technology on Engineering Science
1222
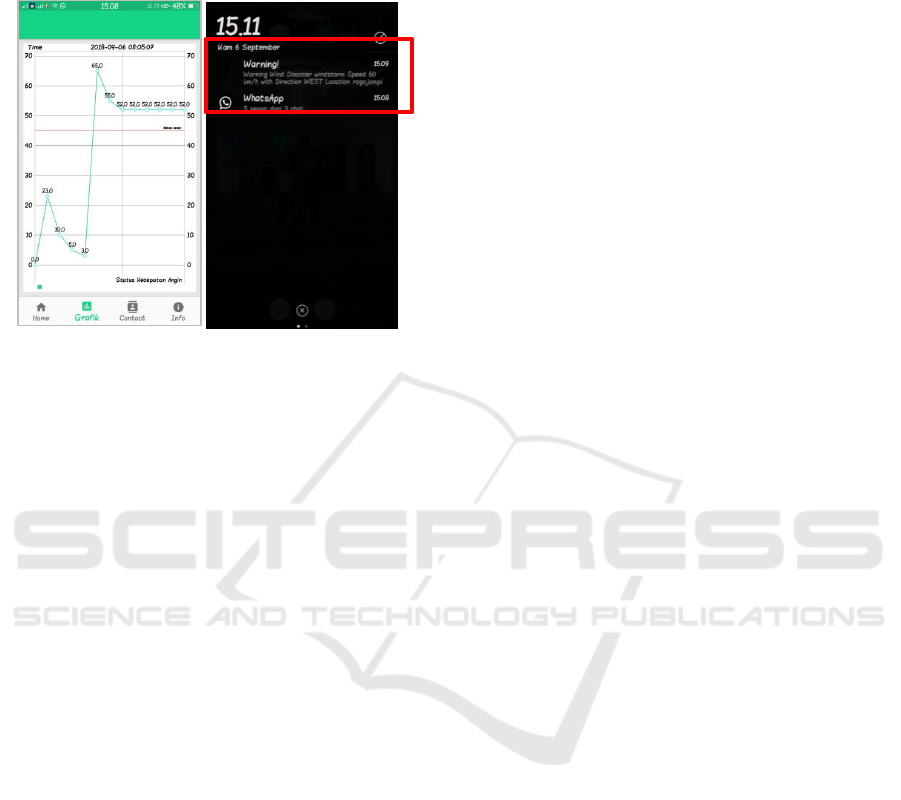
Figure 15 described that in this research also
made an android application with EWS system to
inform
danger notification to the people.
Figure 15: Real Time Android Based Application, Graphic
and EWS Notification.
By using an android application made the
windstorm information received to the people
quickly
compare to conventional BNSP Banyuwangi
District
Early Warning System flow notification.
5 CONCLUSION
One of an important thing in the disaster
management is early warning system. By using
EWS the information of disaster danger can inform
quickly
and accurately. This research propose a
system EWS for Banyuwangi district based on
android application, web based and IoT technology.
A real time
information become advantages for
people to prepare
and protect their property or life
from windstorm
disaster. Through android
application also made
information could easily
access by people and warning system notification
very useful for people.
These results prove that this
EWS system can detect
windstorm, inform warning
information quickly than conventional way and
easily to use for people. The
main issue show that
the critical location also take an important aspect for
early detection system This
research also gives a
step to make next research with multiple sensors for
deeply information of disaster.
REFERENCES
Nisa, F. (2014). Manajemen Penanggulangan Bencana
Banjir, Puting Beliung, dan Tanah Longsor di
Kabupaten Jombang. JKMP (Jurnal Kebijakan dan
Manajemen Publik), 2(2), 103-116.
BNPB. (31 December 2017). DIBI BNPB (National Board
for Disaster Management)," BNPB (National Board
for Disaster Management). [Online]. Available:
http://bnpb.cloud/dibi/. [Accessed 23 July 2018 July
2018].
Hashiguchi, H., Yamamoto, M. K., Yamamoto, M., Mori,
S., Yamanaka, M. D., Carbone, R. E., & Tuttle, J. D.
(2013). Cloud episode propagation over the
Indonesian Maritime Continent from 10 years of
infrared brightness temperature observations.
Atmospheric Research, 120, 268-286.
Yuliandoko, H., & Rohman, A. (2019, November).
Flooding detection system based on water monitoring
and ZigBee mesh protocol. In 2019 4th International
Conference on Information Technology, Information
Systems and Electrical Engineering (ICITISEE) (pp.
385-390). IEEE.
World, Meteorological and Organization. (2009).
https://www.wmo.int,. [Online]. Available:
https://library.wmo.int/pmb_ged/MHEWS.pdf.
[Accessed 24 July 2018].
Munadi, K., Dirhamsyah, M., & Yuliansyah, D. (2011). A
web-based geographic information system for aceh
natural hazards. Telkomnika, 9(1), 89.
Doong, D. J., Chuang, L. H., Wu, L. C., Fan, Y. M., Kao,
C. C., & Wang, J. H. (2012). Development of an
operational coastal flooding early warning system.
Natural Hazards and Earth System Sciences, 12(2),
379-390.
Soebroto, A. A., Cholissodin, I., Frestantiya, M. T., & El
Arief, Z. (2018). Integration method of local-global
SVR and parallel time variant PSO in water level
forecasting for flood early warning system.
Telkomnika, 16(3), 1193-1200.
Yuliandoko, H., Wardhany, V. A., Pramono, S. H., &
Siwindarto, P. (2017, November). Design of flooding
detection system based on velocity and water level
DAM with ESP8266. In 2017 2nd International
conferences on Information Technology, Information
Systems and Electrical Engineering (ICITISEE) (pp.
396-401). IEEE.
Bing, X. (2014). Key internet of things technology and
application research. TELKOMNIKA Indonesian
Journal of Electrical Engineering, 12(7), 5599-5602.
Bencana, B. N. P. (2015). National Board for Disaster
Management. Infografis Data Bencana Periode, 1.
Susanti, I., Nur, M., Arianto, R., & Siregar, R. R. A.
(2018). Embedded System Practicum Module for
Increase Student Comprehension of Microcontroller.
Telkomnika, 16(1).
Vatsal, S., & Bhavin, M. (2017). Using raspberry pi to
sense temprature and relative humidity. Int. Res. J.
Eng. Technol, 4(2), 380-385.
Design of Windstorm Disaster Early Warning System based on IoT and Hall Effect Sensor in the Critical Area Location
1223

Krishna, A., & Abraham, L. (2014). Analysis of different
Hall effect current sensors for space applications.
International Journal of Innovative Science,
Engineering & Technology, 1(5).
Stewart, R. H. (2008). Introduction to physical
oceanography. Robert H. Stewart.
Sanger, R. J., Fibriani, C., & Nataliani, Y. (2012).
Perancangan Aplikasi Sistem Informasi Pemantauan
Kecepatan Angin, Beserta Pengkategorian Jenis Angin
dengan Hardware Inframerah Sebagai Media
Kalibrasi. Jurnal Teknologi Informasi, 9(2), 117-118.
iCAST-ES 2021 - International Conference on Applied Science and Technology on Engineering Science
1224
