Big Data Analytics for Covid-19 Pandemic Prediction in Indonesia
Dewi Yanti Liliana
a
, Hata Maulana
b
and Agus Setiawan
Department of Informatics and Computer Engineering, Politeknik Negeri Jakarta, Depok, Indonesia
Keywords: Big Data, Covid-19, Data Visualization, Forecasting, Indonesia, Mitigation, Pandemic.
Abstract: The Covid-19 Pandemic has resulted a health crisis in the community. In Indonesia, up to May 28th 2020 it
was recorded that the total number of confirmed cases of Covid-19 reached 24.538 people. Indonesian
Government urgently needs a mitigation planning because this situation can lead to a long-term economic and
social crisis. As an effort to overcome the problems above, a prediction model of the Covid-19 pandemic
impact is needed for mitigation planning. This study aims to develop an analytical prediction model for the
Covid-19 pandemic in Indonesia. Big Data analytics and processing based on Machine Learning was applied
since Big Data technology can explore patterns in the data to see trends that can be used for visualization and
forecasting of the Covid-19 cases in Indonesia. SAP Analytics Cloud; a cloud-based Big data analytics
powerful software was used to build the prediction model. The results of this study recommended the
implementation of a Large-scale Social Restriction (LSR) to be applied continuously in impacted provinces
to suppress the transmission of Covid-19 in Indonesia.
1 INTRODUCTION
Since the beginning of 2020 the world has been
shaken by the Covid-19 virus pandemic which has
disrupted the stability of human life in all aspects. The
Covid-19 virus outbreak began in the city of Wuhan,
Hubei Province in China at the end of December 2019
(Sanche et al., 2020). After that, like a snowball
effect, it was growing bigger; almost all countries in
the world were exposed to the Covid-19 virus (WHO,
n.d.). Based on the current data in the Worldometer
website, Covid-19 victims in the world reached
5.730.736 people as per May 28, 2020 with 356.814
death tolls and 2.492.496 recovery cases
(Worldometer, n.d.). Whereas in Indonesia, it was
recorded that up to 28 May 2020 the total number of
positive cases of Covid-19 reached 24.538 people, the
number of recovered patients 6.240 people, and the
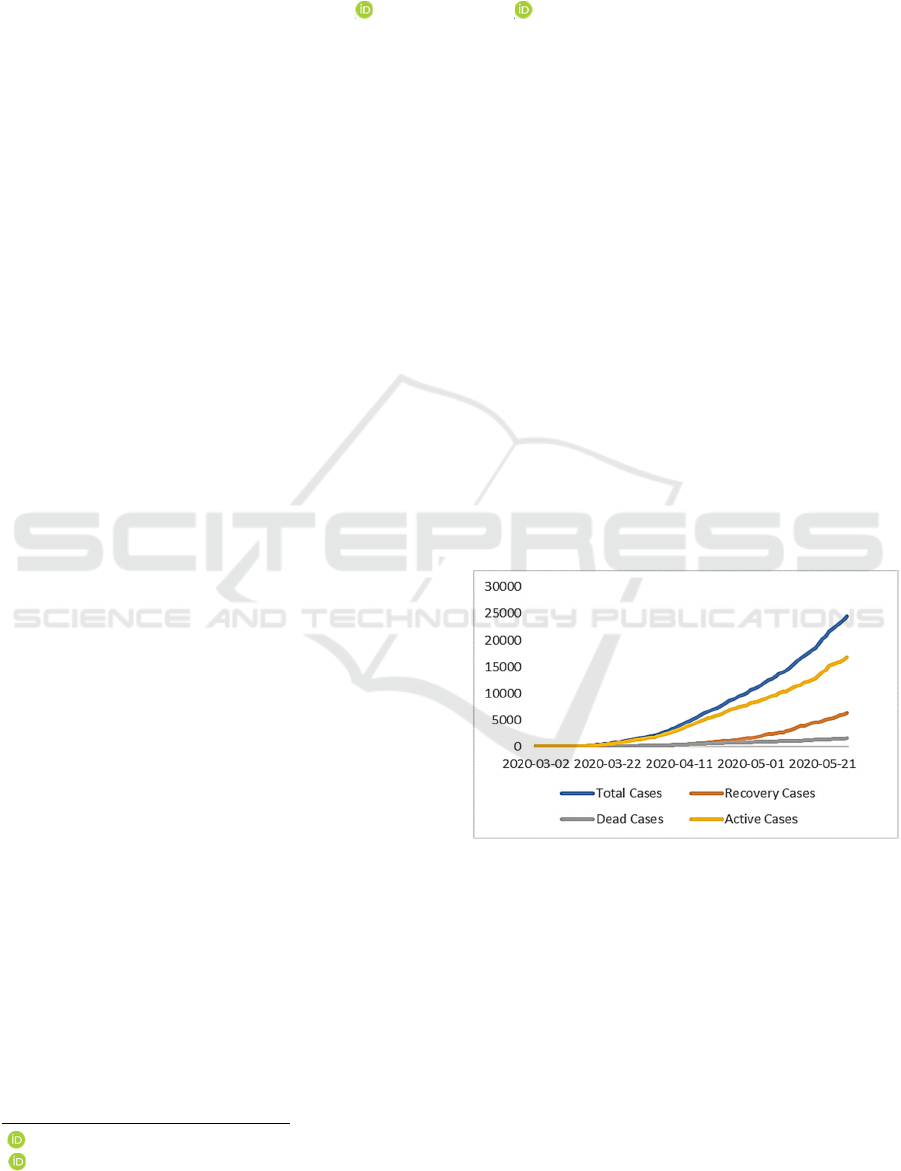
number of mortal patients 1.496 people. The chart in
Figure 1 shows the situation of the Covid-19 cases in
Indonesia until 28 May 2020 (katadata, n.d.).
The chart in figure 1 shows an increasing number
of cases every day. This chart describes an
exponential growth which means the quantity of
Covid-19 cases will rise over time. The visualization
a
https://orcid.org/0000-0002-9574-703X
b
https://orcid.org/0000-0002-2893-2972
from this graph is useful to describe the cases in
Indonesia.
Figure 1: Covid-19 cases in Indonesia.
By the time this paper is written, Indonesia is still
facing the increasing number of cases and nobody is
quite sure when the pandemic will end. Thus, it needs
a forecasting technique to give a foresight regarding
Covid-19 cases in Indonesia in order to arrange the
future action or mitigation planning from the
governments. The same thing was done by other
countries such as Italy; forecasting result was used to
Liliana, D., Maulana, H. and Setiawan, A.
Big Data Analytics for Covid-19 Pandemic Prediction in Indonesia.
DOI: 10.5220/0010962400003260
In Proceedings of the 4th International Conference on Applied Science and Technology on Engineering Science (iCAST-ES 2021), pages 1203-1209
ISBN: 978-989-758-615-6; ISSN: 2975-8246
Copyright
c
2023 by SCITEPRESS – Science and Technology Publications, Lda. Under CC license (CC BY-NC-ND 4.0)
1203

response as well as to set priorities to Covid-19 crisis
(Grasselli et al., 2020).
Forecasting can be used as a prediction tool of the
future cases. It can be used as an effort to provide an
initial response in handling Covid-19 cases in
Indonesia as well. In (Rustam et al., 2020) forecasting
has powerfully been applied based on machine
learning methods for Covid-19 cases using John
Hopkins dataset (Petropoulos & Makridakis, 2020).
Machine learning works by combining statistical
techniques and Big Data analytics to yield the
knowledge about future; or so-called data-driven
knowledge (Frické, 2018).
In the Big Data field, the term "analysis" is
different from "analytics". The fundamental
difference is that an analysis is carried out to find the
information from the available data to explain
patterns that occurred in the past that are useful for
current decision making. While analytics is an
activity to find patterns in the data and interpret the
knowledge of the patterns to predict something that
will happen in the future (Frické, 2018). In other
countries, e.g. China, Singapore and Canada, the use
of Big Data and Artificial Intelligence played an
important role in Covid-19 for deciding action
planning and mitigation. In contrast, in Indonesia the
information presented was mostly the analysis of
daily data and the aggregate data in the form of
statistical s and percentages related to Covid-19
cases. As a matter of facts, not many prediction
models have been produced because it required
forecasting methods and pattern recognition from
time-series data based on Artificial Intelligence and
Machine Learning methods.
Therefore, this paper proposed a Big Data
analytics for predicting the future cases of Covid-19
in Indonesia based on machine learning methods. Our
contribution is creating the prediction model of
Covid-19 cases in Indonesia using Big Data analytic
tools. This contribution is important since the Covid-
19 pandemic curve has not been flattening up to now,
therefore all efforts, including scientific effort must
be made in supporting all decisions related to Covid-
19 cases mitigation planning and handling. We
organized this paper systematically to provide a
comprehensive picture about the Covid-19 problems
in Indonesia; the proposed prediction methods; and
the discussion of the results.
2 COVID-19 GLOBAL PANDEMIC
2.1 Covid-19
Corona virus disease that first appears in the year of
2019; or in short Covid-19 is an infectious disease
caused by The Corona Virus type 2 (SARS-CoV-2)
and resulting an acute respiratory syndrome (Sanche
et al., 2020). Common symptoms caused by this
disease are fever, coughing, and shortness of breath.
Other symptoms include fatigue, muscle aches,
diarrhoea, sore throat, loss of sense of smell, and
stomach pain. Meanwhile some cases are reported to
cause mild symptoms that develop into severe
symptoms quickly, including pneumonia and multi-
organ failure if the patient is included in the comorbid
group (Radulescu & Cavanagh, 2020). Comorbid is a
group of patients with a risk of severe symptoms
because they have a history of congenital diseases
such as: diabetes, hypertension, heart disease,
pregnant women, and smokers. As per May 28
th
2020,
more than 5.7 million cases had been reported in more
than 200 countries and regions, this disease also
caused more than 350 thousand of deaths and more
than two million people recovered (Worldometer,
n.d.). Covid-19 has been proclaimed as a global
pandemic by WHO on March 2020.
The Covid-19 virus is spreading from a close
contact by small droplets produced when an infected
person coughs, sneezes or talks (Sanche et al., 2020).
These tiny drops are also produced when breathing,
but quickly fall to the ground or surface and generally
do not spread over long distances. People can also be
infected by touching a contaminated surface then
holding their face. This virus can survive on the
surface for up to 72 hours. The disease is most
contagious during the first three days after the
occurrence of symptoms, although infections may
occur before symptoms appear. The time from the
exposure to the occurrence of symptoms is usually
around 5 days, but can range from 2 up to 14 days
(Radulescu & Cavanagh, 2020). The standard method
for diagnosing Covid-19 is by applying the Reverse
Transcriptional Polymerase Chain Reaction (RRT-
PCR) in real-time from the nasopharyngeal swab,
which is taking samples from the lining of the nose
and throat (Long et al., 2020). Infections can also be
diagnosed from a combination of symptoms,
comorbid risk factors, and chest CT scans that show
symptoms of pneumonia.
Researchers in the UK and Germany found that
the Covid-19 virus has mutated into three types. They
labelled the Covid-19 virus with types A, B, and C.
The type A virus is the earliest type found in Wuhan
iCAST-ES 2021 - International Conference on Applied Science and Technology on Engineering Science
1204
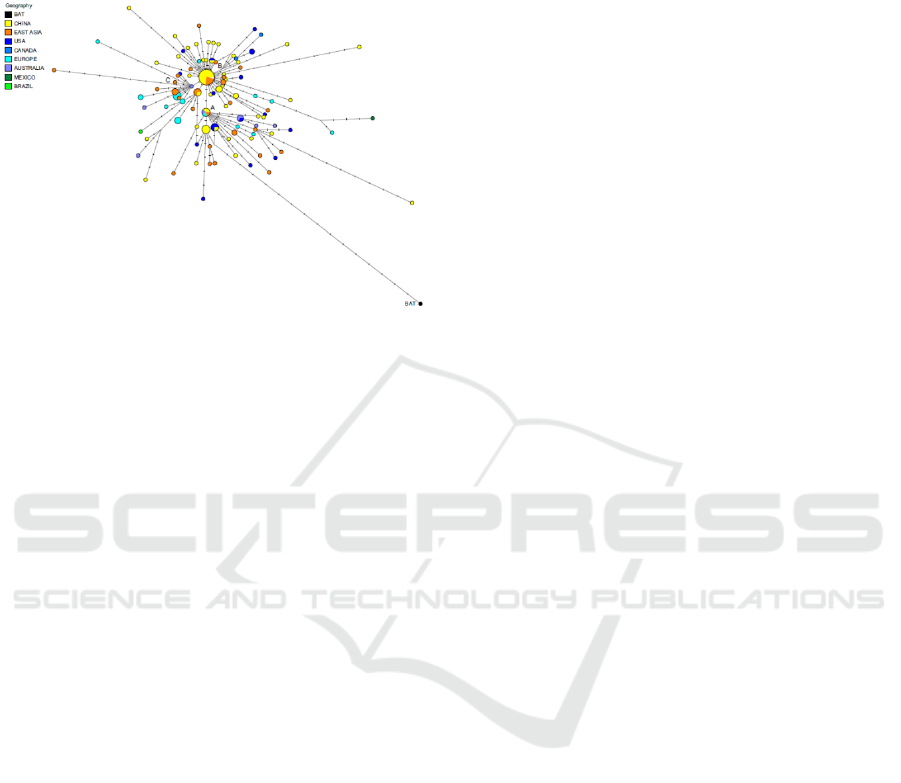
and infects a lot in America and Australia. Type B
virus is found in East Asia. Whereas type C virus is a
child of type B virus that infects many people in
Europe and South East Asia (Forster et al., 2020).
Figure 2: Phylogenetic Network of Covid-19.
Source (Forster et al., 2020).
Figure 2 depicts Covid-19 phylogenetic network in
the world. In addition to its spread and mutation,
world researchers are also trying to develop a Covid-
19 vaccine to help human to overcome a pandemic
crisis (Forster et al., 2020).
2.2 Covid-19 Pandemic Impacts in
Indonesia
The impact of the Covid-19 outbreak can be seen in
almost all sectors in Indonesian people's lives. Social
activities have been banned and suspended
temporarily since the middle of March 2020.
Economic slowdown caused by transportation
services which were being reduced and tightly
regulated, tourism was closed, shopping centers were
empty from visitors and closed to the informal sector
such as online motorbike taxi, public transportation
drivers, street vendors, traveling merchants, MSMEs,
and labors/workers. Trade centers such as malls and
market which were usually crowded by people
suddenly deserted and closed temporarily. The
tourism sector has decreased; impacted by the
government regulation which closed tourist
attractions and entertainment venues. Work and study
were done at home with an online mode. Disruption
were in all human being live aspects.
The death rate due to Covid-19 in Indonesia was
the highest in Asia after China. The percentage of
death was 9.11%, the number of cases of corona virus
reached 1,986 cases with 134 people recovering.
From 3 to 5 April 2020 the number of confirmed
victims of Covid-19 was 2,273; where 164 recovered
and 198 died (katadata, n.d.). Fast responses and
accurate regulations are needed to suppress and
eradicate Covid-19 cases in Indonesia so that the
nation get out of from the crisis situation.
One of the efforts of the Indonesian government
to reduce the number of Covid-19 cases was by
implementing Large-scale Social Restrictions (LSR)
or known as PSBB in Indonesia; beside school
closure, workplace closure, and travel ban. The
implementation of LSR in most affected regions was
considered very urgent as the spread of Covid-19 was
also moving exponentially. The government assumed
that LSR was able to curb the increase of Covid-19
cases. But in the capital city Jakarta which has entered
the second phase of the LSR implementation, on
Wednesday May 6
th
2020 still found 4.709 positive
cases of Covid-19. That number increased compared
to the data on May 5
th
2020 which reached 4.687
cases. Hence, the LSR implementation must be
evaluated periodically to monitor its effectiveness.
3 BIG DATA ANALYTICS
In this section we will explain our research methods,
including Big data analytics for Covid-19 Crisis and
our preliminary work using Machine Learning
technique for Covid-19 prediction.
3.1 Big Data Analytics for Covid-19
Big Data is a large and complex collection of data
from various data sources. Big Data has 4V
characteristics which stand for Volume, Variety,
Velocity, and Veracity (Frické, 2018). Volume relates
to the size of data that reaches hundreds of Terabytes
per day and in a cloud storage. Variety relates to data
types which are also varying; not only from structured
databases but also from unstructured and semi-
structured data from internet media, social media, and
IoT sensors. Velocity means the data speed is very
fast; even in a real-time or relevant time span. Last,
veracity indicates that in big data, the data itself can
be valid but can also be disruptive and inaccurate.
Hence, the veracity aspect of big data to produce
knowledge must be considered.
Big Data technology involves analytic processing
(Frické, 2018). Analytic is the process of discovery,
interpretation, and communication of meaningful
patterns in data. There are four processes in analytic
activity as illustrated in figure 3. The analytic
processes include four activities: descriptive (what
happened), diagnostic (why did it happen), predictive
(what will happen), and prescriptive (how can we
Big Data Analytics for Covid-19 Pandemic Prediction in Indonesia
1205
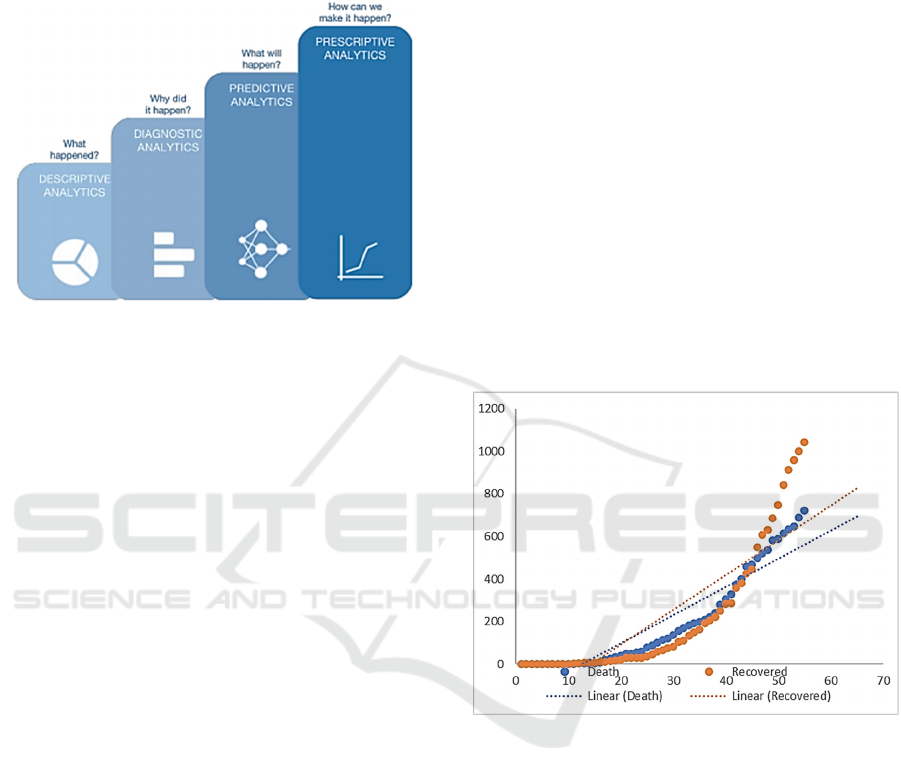
make it happen). Big data technology produces
patterns or knowledge from data (data-driven
knowledge) known as value or insight. Value is the
highest form of data transformation (Frické, 2018).
Figure 3: Types of analytic processes in Big Data.
Big Data analytic can be applied to discover
knowledge for Covid-19 cases Indonesia. Some tasks
can be developed i.e.
• Forecasting for the continuous data prediction
related to Covid-19 using the Regression
method.
• Clustering for the description dan visualization
of data patterns related to Covid-19
• Classification for the prediction of categories
related to Covid-19 using the Machine Learning
methods
• Pattern Analysis to look for the relationship
between observed parameters using Sequential
Pattern Analysis.
In this paper, our proposed methods are describing the
first two techniques in Big Data (forecasting and
visualization). But we will explore all analytics
aspects in the near future.
3.2 Covid-19 Dataset
We used two sources of datasets: kawalCovid
(KawalCovid, n.d.) and databoks (katadata, n.d.).
KawalCovid dataset consisted of data from 511
regions in Indonesia. It provided a csv file data for
global Covid-19 cases; while databox provided daily
Covid-19 cases in Indonesia.
3.3 Preliminary Works
Our effort in developing big data analytics model was
started by doing preliminary works. Preliminary
research that has been done to obtain a prediction
model of the Covid-19 case in Indonesia was using
the regression technique on a time series data. The
prediction was done by using 55 days data taken from
(katadata, n.d.). The data started from the first case
recorded in Indonesia on March 2, 2020 until April
26, 2020. Covid-19 prediction chart was made by
using the exponential regression method. It visualized
the prediction chart of the dead and recovered victims
as in Figure 4.
Figure 4 shows two scatter diagrams in the form
of different dot colors that illustrate the number of
dead and recovered patients. With regression and
forecasting techniques, it is seen that on the 40th day
since March 2
nd
2020 (or April 10
th
2020) there is an
increasing number of recovered patients with an
exponential rising trend. While the number of patients
dying will be more sloping, although not linearly but
predicted to be closer to the polynomial model which
means not an exponential. As an illustration, the type
of curve of the slowest growth rate in a row are linear
- polynomial - exponential.
Figure 4: Time series prediction of Covid-19 in Indonesia.
Furthermore, we employed Big data analytic tools
from SAP which is called SAP Analytics Cloud
(SAC) to perform the analytic task. SAC is a cloud-
based software as a service (SaaS) solution that has
analytics functionalities and visualization features.
Our exploration using SAC software was for: a)
visualization of Covid-19 cases in all provinces in
Indonesia; b) forecasting of Movement Control Order
(LSR) impact in Indonesia due to Covid-19
Pandemic.
4 RESULTS AND DISCUSSIONS
This part is divided into two subsections; a) the
visualization of big data analytics for Covid-19
iCAST-ES 2021 - International Conference on Applied Science and Technology on Engineering Science
1206
Pandemic in Indonesia; b) forecasting using Big data
analytics results.
4.1 Visualization Results
Big Data implementation using SAP Analytics Cloud
(SAC) software resulting three visualizations which
are called as Stories. Each story describes different
events and knowledges. The visualization results are
in Figure 5, Figure 6, and Figure 7.
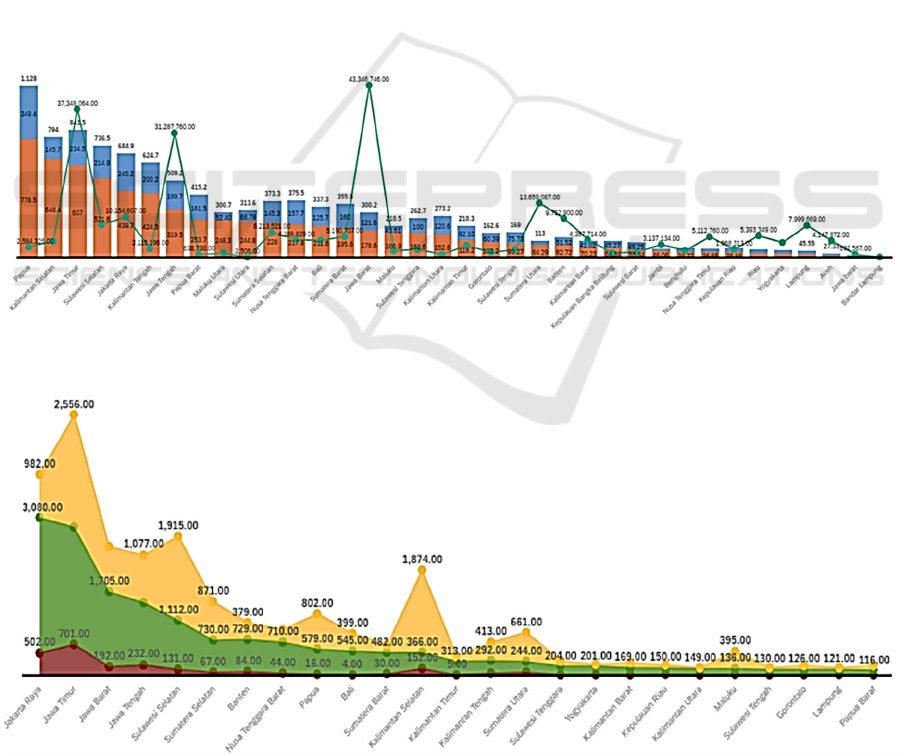
Figure 5 is a result of SAC story which visualized
the comparison of the number of completed cases,
total cases of Covid-19 and the total population per
province in Indonesia. The dataset was KawalCovid
(KawalCovid, n.d.) recorded from the first case in
Indonesia on March, 2020 up to June, 2020. Three
objects in the chart are orange bar indicates total
cases; blue bar indicates completed cases; and green
line indicates the total population in each province of
Indonesia. The finding of Figure 5 can be seen that
although the province of Jawa Barat (West Java) has
the highest population among other provinces, the
number of completed cases has reached 122 out of a
total of 300 cases. This means that West Java is the
province with the highest level of completed case
handling with the ratio of 0.68.
Figure 6 is a result of SAC story which visualized
the comparison of the number of active cases,
recovery cases, and death cases per province in
Indonesia sorted by recovered cases. It used the same
dataset source as in Figure 5. In Figure 6, the yellow
area is an active case, green area is a recovery case,
and red area is a death case. Some findings are the
highest number of active, recovered and dead patients
ranked by the highest number of recovered cases was
in DKI Jakarta province, and the lowest was in Papua
Barat (West Papua). Jawa Timur (East Java) should
be a priority focus of the government because besides
active cases were high, death cases were also high;
indicated by the highest yellow line’s peak point as
well as the red line.
Figure 5. Visualization of Covid-19 cases and total number of populations in Indonesia.
Figure 6. Visualization of active, recovered, and dead Covid-19 cases in Indonesia
Big Data Analytics for Covid-19 Pandemic Prediction in Indonesia
1207
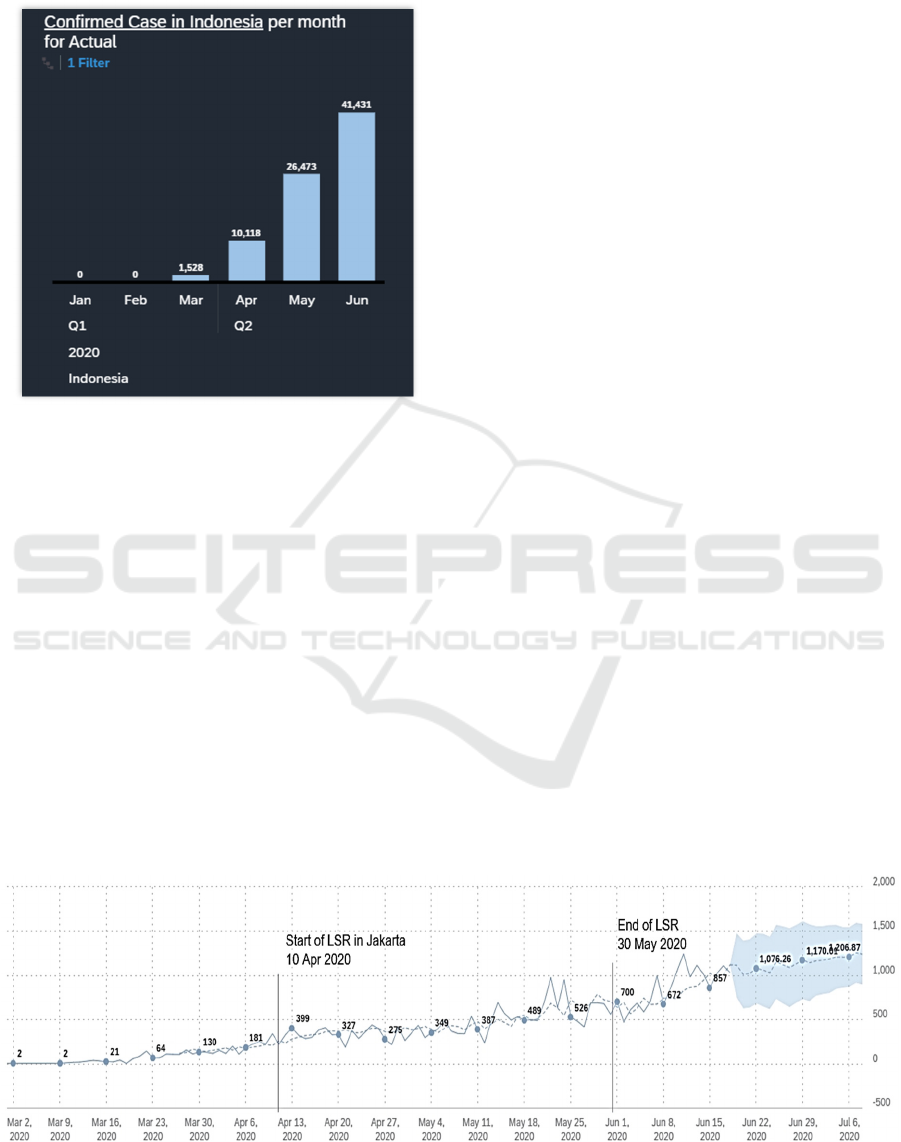
Figure 7 is a result of SAC insight which depicts
the confirmed case in Indonesia per month.
Figure 7: Monthly Covid-19 confirmed cases in Indonesia.
If we look at the chart in Figure 7, we can see that
the spread of Covid-19 cases in Indonesia has
increased dramatically from March to June. The
increase from March to April reached six times higher.
The increasing percentage every month from March to
June were 662%, 261%, and 156% respectively. Even
so, the highest number of spreads was in the last
month, where by mid-June it has increased up to
15,000 cases. If we look at the month before (May),
the number of infected people was increasing by
15.000 from May to June. Hence, we can roughly
predict that the month after will reach at least 15,000
as well. Therefore, necessary step is needed to reduce
this number.
4.2 Forecasting Results
Forecasting or prediction based on time series in
Covid-19 cases can be done by monitoring the number
of cases on a daily basis to observe the trend of cases
movement. The goal is to prevent the spread of the
Covid-19 in communities. We chose a region which
was most impacted in Indonesia which is Indonesia
Capital City, Jakarta. We kept track the time-series
Covid-19 cases data from the early outbreak in
Indonesia on March 2
nd
up to June 20
th
,2020. The
source of the dataset was from Databox (katadata,
n.d.). Fig 8 depicts the forecasting results. We put two
vertical lines in the visualization chart which indicated
the starting point of LSR implementation phase 1 on
April 10
th
, 2020 and the end point of LSR phase 1 on
May 30
th
, 2020. After LSR phase 1, Indonesia moved
to a next phase of LSR with some relaxations in
several important sectors, such as economy and
trading. This phase is an adaptation step and well-
known as a new normal phase.
From Figure 8 we can learn that the LSR
implementation has effectively suppressed the
increasing rate of Covid-19 cases in the Jakarta region.
It can be seen from the flat-trend during the LSR
implementation. Whereas within less than a month
after the LSR phase 1 ended, we can see there is a
sudden increase in the Covid-19 cases during June.
The forecasting goes from mid-June until July 6
th
,
2020; or the shaded area. The forecasting area
predicted that there will be a significant increasing
during the new normal phase. Therefore, we suggest
the government to evaluate the new normal regulation
and strive for the implementation of LSR with
appropriate arrangements so that the rate of Covid-19
cases does not increase sharply but people still can
resume economic activities. Furthermore, we suggest
the increase implementation of LSR widely across
nation as well as increase the frequency of Covid-19
tests conducted in public area.
Figure 8: SAC forecasting result of Covid-19 in Jakarta City.
iCAST-ES 2021 - International Conference on Applied Science and Technology on Engineering Science
1208

5 CONCLUSIONS
The problems of the Covid-19 Pandemic resulted in a
health crisis followed by an economic and social
crisis in Indonesia. This paper aims to develop an
analytical prediction model for the Covid-19
pandemic in Indonesia. The prediction used Big Data
analytics technology. The results showed the
visualization of Covid-19 cases in Indonesia as well
as the trend which was still increasing. The spread of
the Covid-19 virus can be avoided by breaking the
chain of transmission and continuing to comply with
health protocols. The provincial government in
Indonesia is expected to be more vigorous and
decisive in enforcing large-scale social restrictions
(LSR) to break the chain of spread of Covid-19
infections. Our future works will be on exploring
other Big Data analytics using classification and
pattern recognition strategies.
ACKNOWLEDGEMENTS
This work was financially supported by Politeknik
Negeri Jakarta through The Distinguished Research
of Higher Education Institution Decentralization
Grant (PUPT).
REFERENCES
Forster, P., Forster, L., Renfrew, C., & Forster, M. (2020).
Phylogenetic network analysis of SARS-CoV-2
genomes. 3–5. https://doi.org/10.1073/pnas.2004999
117
Frické, M. H. (2018). Data-Information-Knowledge-
Wisdom (DIKW) Pyramid, Framework, Continuum. In
L. A. Schintler & C. L. McNeely (Eds.), Encyclopedia
of Big Data (pp. 1–4). Springer International
Publishing. https://doi.org/10.1007/978-3-319-32001-
4_331-1
Grasselli, G., Ospedale, G., Policlinico, M., Pesenti, A.,
Ospedale, G., Policlinico, M., & Cecconi, M. (2020).
Critical Care Utilization for the Covid-19 Outbreak in
Lombardy , Italy Early Experience and Forecast
During an Emergency Response. 323(16), 1545–1546.
https://doi.org/10.1056/NEJMoa2002032
katadata. (n.d.). https://databoks.katadata.co.id/
KawalCovid. (n.d.). https://kawalCovid19.id/
Long, C., Xu, H., Shen, Q., Zhang, X., Fan, B., Wang, C.,
Zeng, B., Li, Z., Li, X., & Li, H. (2020). Diagnosis of
the Coronavirus disease (Covid-19): rRT-PCR or CT?
European Journal of Radiology, 126, 108961.
https://doi.org/10.1016/j.ejrad.2020.108961
Petropoulos, F., & Makridakis, S. (2020). Forecasting the
novel coronavirus Covid-19. PLOS ONE, 15(3), 1–8.
https://doi.org/10.1371/journal.pone.0231236
Radulescu, A., & Cavanagh, K. (2020). Management
strategies in a SEIR model of Covid 19 community
spread. March. https://doi.org/10.13140/RG.2.2.12
643.50726
Rustam, F., Reshi, A. A., Mehmood, A., Ullah, S., On, B.
W., Aslam, W., & Choi, G. S. (2020). Covid-19 Future
Forecasting Using Supervised Machine Learning
Models. IEEE Access, 8, 101489–101499.
https://doi.org/10.1109/ACCESS.2020.2997311
Sanche, S., Lin, Y. T., Xu, C., Romero-Severson, E.,
Hengartner, N., & Ke, R. (2020). High Contagiousness
and Rapid Spread of Severe Acute Respiratory
Syndrome Coronavirus 2. Emerging Infectious Disease
Journal, 26(7). https://doi.org/10.3201/eid2607.20
0282
WHO. (n.d.). Timeline of WHO’s response to Covid-19.
Retrieved June 30, 2020, from https://www.who.int/
news-room/detail/29-06-2020-Covidtimeline
Worldometer. (n.d.). Corona Virus Cases. Retrieved May
28, 2020, from https://www.worldometers.info/
coronavirus/
Big Data Analytics for Covid-19 Pandemic Prediction in Indonesia
1209
