
Application of Geographic Information System for the Identification
of Flood and Landslide Mitigation in Badeng Watershed
Zulis Erwanto
1a
and Dewi Aras Pratiwi
2
1
Department of Civil Engineering, Politeknik Negeri Banyuwangi, Jl. Raya Jember Km 13 Kabat, Banyuwangi, Indonesia
2
Study Program of Civil Engineering, Politeknik Negeri Banyuwangi, Jl. Raya Jember Km 13 Kabat, Banyuwangi,
Indonesia
Keywords: Badeng Watershed, Flood, Geographic Information Systems, Landslide, Mitigation.
Abstract: Badeng River is the path of the Mount Pendil catchment area which can potentially bring avalanche material
and runoff water from upstream to downstream so that it can cause floods and even flash floods. The mapping
of flood and landslide-prone areas in the Badeng Watershed is non-structural disaster control. The research
objective is the identification of disaster mitigation in areas prone to flooding and landslide-prone areas in the
Badeng Watershed with Geographic Information Systems. The study was conducted using descriptive
methods consisting of surveys and map overlays, while the identification of flood-prone and landslide-prone
areas using a scoring method by weighting refers to the formula of flood and landslide susceptibility. The
results showed that the flood water supply area of Badeng watershed with 32.2% prone conditions was found
in the villages of Desa Sumber Arum, Sumber Bulu, Sumber Baru, Songgon, Parang Harjo, Bedewang,
Kemiri, Benelan Kidul, Bubuk, Cantuk, Gintangan, Singojuruh, Alas Malang, Bayu, and Gladag. For areas
prone to flooding with very prone conditions 28.43% was found in the villages of Sumber Arum and Bayu,
and landslide susceptibility areas with moderately vulnerable conditions 2.7% was in the villages of Sumber
Arum, Songgon, Bayu, and Sumberbulu. Disaster mitigation was recommended upstream in the form of
vegetation conservation and mechanical conservation buildings and downstream in the form of river dredging
and flood awareness training for communities in vulnerable areas.
1 INTRODUCTION
Natural disasters are one of the phenomena that can
occur at anytime, anywhere, and anytime, causing
risks or dangers to human life, both property losses
and human lives (Faizana et al., 2015). Therefore, the
role of disaster mitigation is needed to reduce the
impact of disasters that occur. In-Law Number 24 of
2007 concerning Disaster Management which is
published on the official website of the National
Disaster Management Agency states that a disaster is
an event or series of events that threaten and disrupt
people's lives and livelihoods caused by both natural
factors and non-natural factors and human factors
resulting in human casualties, environmental damage,
property losses, and psychological impacts (BNPB,
2007).
The Banyuwangi flash flood in 2018 in Alas
Malang was one of the many natural disasters that
a
https://orcid.org/0000-0001-7938-9116
caused losses. This flash flood was caused by
weathering of material on the slopes of Mount Pendil,
which flows with a current to the Badeng River.
Badeng River is the Mount Pendil catchment area and
flows up to Alas Malang. Flash floods can be
destructive. The flow of water currents that are not
too deep but are fast and turbulent (turbulent) brings
subtle soil material and drag material in the form of
more massive rocks to cause damage.
Geographic Information Systems (GIS) can
provide geospatial data such as objects on the surface
of the earth quickly while providing an accurate
spatial analysis system. So, mitigation efforts can be
made to prevent the risk of potential disasters or
reduce the effects of disasters.
This Geographic Information System has been
widely used for similar research purposes, such as
research from, Faizana
(2015); Todingan et al.,
(2015); Susanti
(2016); Novialiadi
(2016); Hendi
1184
Erwanto, Z. and Pratiwi, D.
Application of Geographic Information System for the Identification of Flood and Landslide Mitigation in Badeng Watershed.
DOI: 10.5220/0010962200003260
In Proceedings of the 4th International Conference on Applied Science and Technology on Engineering Science (iCAST-ES 2021), pages 1184-1193
ISBN: 978-989-758-615-6; ISSN: 2975-8246
Copyright
c
2023 by SCITEPRESS – Science and Technology Publications, Lda. Under CC license (CC BY-NC-ND 4.0)
(2014); Erwanto
et al., (2020); Erwanto and Lestari
(2020); and also Erwanto et al., (2021). Therefore,
this research is a mitigation effort that produces maps
of flood and landslide disaster-prone and
recommendations for disaster risk reduction.
1.1 Problems
How to identify disaster mitigation in flood-prone
areas and landslide-prone areas in the Badeng
Watershed with Geographic Information System?
1.2 Research Purpose
The research objective is to identify disaster
mitigation in flood-prone areas and landslide-prone
areas in the Badeng Watershed with Geographic
Information System.
2 THEORETICAL BASIS
2.1 Disaster Mitigation
Disaster mitigation is an effort to reduce the impact
of disasters, whether natural disasters, human-made
disasters, or a combination of both in a country or
society. Disaster mitigation identification is useful for
determining mitigation policies that will be used in
vulnerable areas. The identification method used is
scoring and layering in the Geographic Information
System (GIS) software by processing spatial data and
attribute data. Analysis of landslide and flood hazards
based on the scoring method
(Paimin et al., 2009).
2.2 Flood Prone Areas
The identification of flood hazard is divided between
the identification of areas prone to flooding (flooding)
and areas of flood water supply or potential
floodwater (Paimin et al., 2009). It is vital to facilitate
the way of identifying sources of disaster
systematically so that effective and efficient control
techniques are obtained. Characterization of flood-
prone areas is done by giving a score of each
parameter on the digital map unit. Scoring in potential
areas of flood water supply can be seen in Table 1 and
scoring in areas prone to flooding in Table 2 (Paimin
et al., 2009).
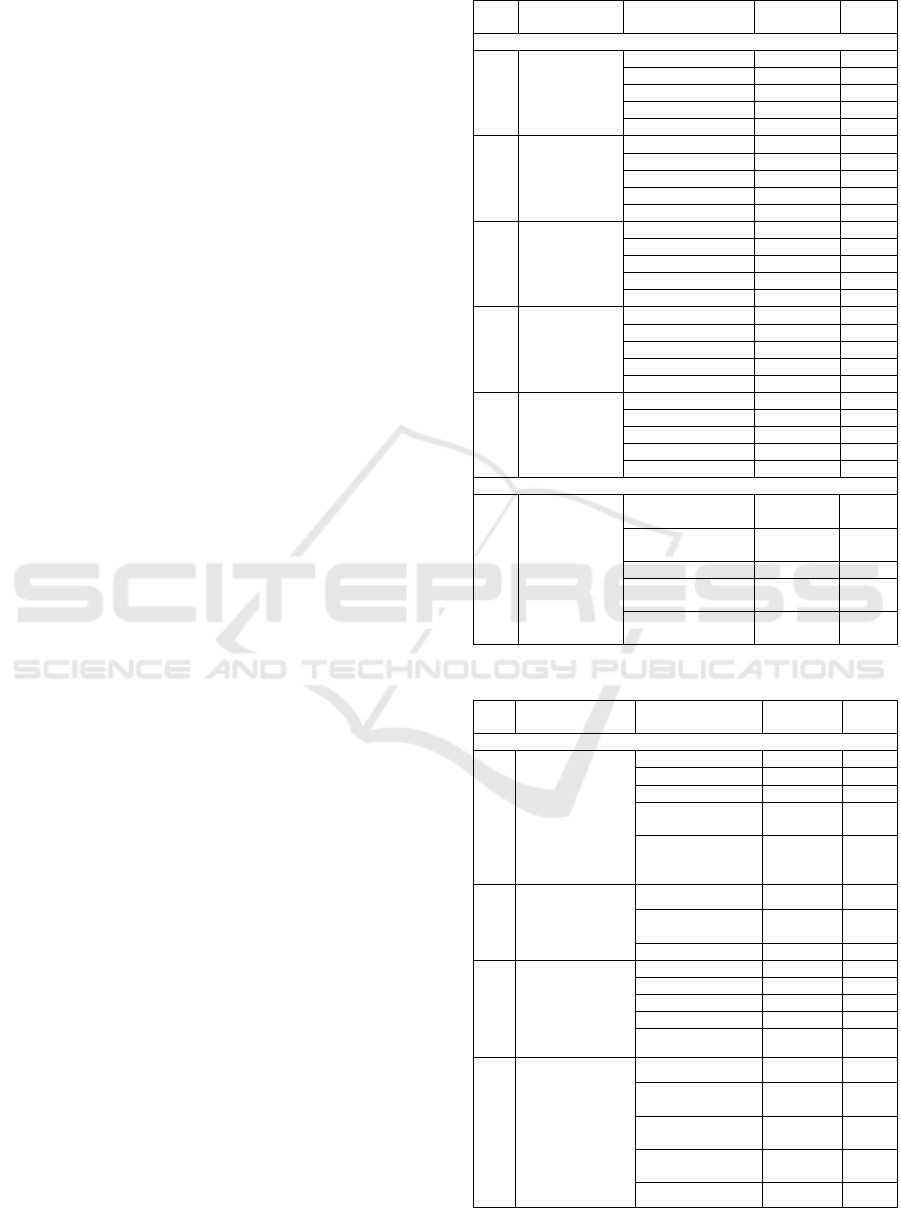
Table 1: Formula of Flood Water Supply Potential.
No.
Parameters /
Wei
g
hts
Classification Category Score
NATURAL 60%
a. Average
Rainfall (mm /
year) (35%)
< 20 m
m
Low 1
21-40 m
m
A Bit Low 2
42-75 m
m
Moderate 3
76-150 m
m
A Bit Hi
g
h 4
> 150 m
m
Hi
g
h 5
b. Watershed
Form (5%)
Oval Low 1
A Little Oval A Bit Low 2
Moderate Moderate 3
Sli
g
htl
y
Roun
d
A Bit Hi
g
h 4
Roun
d
Hi
g
h 5
c. River
Gradient
(10%)
<0,5 % Low 1
0,5-10 % A Bit Low 2
1,1-1,5 % Moderate 3
1,6-2,0 % A Bit High 4
> 2,0 % Hi
g
h 5
d. Drainage
Density (5%)
Rarely Low 1
A Bit S
p
arse A Bit Low 2
Moderate Moderate 3
A Bit Ti
g
ht A Bit Hi
g
h 4
Tightly High 5
e. Watershed
Mean Slope
(5%)
< 8 % Low 1
8-15% A Bit Low 2
16-25 % Moderate 3
26-45% A Bit High 4
>45% Hi
g
h 5
MANAGEMENT 40 %
a. Land Use Protection /
Conservation Forest
Low
1
Production Forest /
Plantation
A Bit Low
2
Yard / Bush / Scrub Moderate 3
Rice Fields / Moor-
Terracin
g
A Bit High
4
Moor / Settlement-
City
High
5
Table 2: Formula of Potential for Flood-Prone Areas.
No.
Parameters /
Wei
g
hts
Classification Category Score
NATURAL 55%
a. Land Form (30%) Mountains, Hills Low 1
Fan and Lava A Bit Low 2
Plains, terraces Moderate 3
Plains, Terraces
(
Slo
p
es <2%
)
A Bit High 4
Alluvial Plains,
Alluvial Valleys,
Bend Paths
High 5
b. River Slope Left
and Right (10%)
> 8 (Very smooth) Low
1
2 - 8 (Somewhat
smoothly)
Moderate 3
< 2
(
Ham
p
ered
)
Hi
g
h 5
c. Meandering
Sinusity (P) =
Length of river
distance according
to curve / straight
distance
(
5%
)
1.0
–
1.1 Low 1
1.2
–
1.4 A Bit Low 2
1.5
–
1.6 Moderate 3
1.7
–
2.0 A Bit Hi
g
h 4
> 2.0 High 5
d.
Dams By
Branching Rivers /
Tides (10%)
None Low
1
Branches of the
main rive
r
A Bit Low 2
Branch of the main
rive
r
A Bit Low 3
Main river /
Bottlenec
k
Moderate 4
Tide A Bit High 5
Application of Geographic Information System for the Identification of Flood and Landslide Mitigation in Badeng Watershed
1185

Table 2: Formula of Potential for Flood-Prone Areas(Cont.).
No.
Parameters /
Wei
g
hts
Classification Category Score
MANAGEMENT 45 %
a. Irrigation
Buildings
Reservoir +
Embankment
High and Goo
d
Low 1
Reservoir
A Bit
Low
2
Dike / Corner /
Flood Canal
Moderate 3
New Embankment A Bit
High
4
Without buildings,
shrinkage of river
dimensions
High 5
The flood hazard level is analyzed with each
parameter and is weighted according to field
conditions and classified in five levels of
vulnerability, including vulnerable, vulnerable,
somewhat vulnerable, slightly vulnerable, and not
vulnerable.
2.3 Landslide Vulnerable Areas
The potential for landslides to occur on slopes
depends on the condition of the rock and soil
preparation, geological structure, rainfall, and land
use. Characterization of landslide-prone areas is done
by giving a score on each parameter on the digital
map unit by field conditions
(Paimin et al., 2009).
Scoring in landslide-prone areas can be seen in Table
3.
Table 3: Formula of Landslide-Prone Area Potential.
No.
Parameters /
Weights
Classification Category Score
NATURAL (60%)
a. Average Rainfall
(mm / year) (25%)
<50 m
m
Low 1
50-90 m
m
A Bit Low 2
100-199 m
m
Moderate 3
200-300 m
m
A Bit Hi
g
h4
> 300 m
m
Hi
g
h5
b. Slope (%) (15%) < 25 % Low 1
25-44 % A Bit Low 2
45-64 % Moderate 3
65-85 % A Bit Hi
g
h4
> 85 % Hi
g
h5
c. Geology (Rock)
(10%)
Alluvial
p
lains Low 1
Limestone hills A Bit Low 2
Granite hills Moderate 3
Sedimentary rock
hill
A Bit High 4
Basalt hill - Clay
flakes
High 5
d. The presence of
faults / gawirs (5%)
None Low 1
Exist Hi
g
h5
e. Soil Depth to
Impermeable
Layer (cm) (5%)
< 30 c
m
Low 1
30-60 c
m
Moderate 2
60-90 c
m
A Bit Hi
g
h4
> 90 c
m
High 5
MANAGEMENT (40%)
a. Land Use (20%) Natural forests Low 1
Shrub/Shrub/Grass A Bit Low 2
No.
Parameters /
Wei
g
hts
Classification Category Score
Forests/Plantations Moderate 3
Moor/Yar
d
A Bit Hi
g
h 4
Rice Fields/
Settlements
High 5
b. Infrastructure
(If Slope <25% =
score 1) (15%)
No Wa
y
Low 1
Cutting the
slopes/Clipped
slo
p
es
High 5
c. Settlement
density (people/
km²)
(If Slope <25% =
score 1) (5%)
< 2000 Low 1
2000
–
5000 A Bit Low 2
5000
–
10000 Moderate 3
10000
–
15000 A Bit Hi
g
h 4
> 15000 Hi
g
h 5
The level of landslide vulnerability is analyzed
with each parameter and is weighted according to
field conditions and classified into five levels of
vulnerability, including very vulnerable, vulnerable,
somewhat vulnerable, slightly vulnerable, and not
vulnerable.
3 METHODOLOGY
3.1 Data Collection
Primary data in the form of field survey results and
coordinates of flood-prone and landslide-prone areas
in the study area and secondary data in the form of
spatial data are digital map data obtained from the
Regional Development Planning Agency of
Banyuwangi Regency.
3.2 Step Work
1) Identification of Flood Prone Areas. Flood
vulnerability identification was carried out to
determine areas or areas that may be affected by
flooding due to the overflow of the Badeng
watershed. Identification of flood hazard is
divided between the identification of flood-prone
areas (flooded) and areas of flood water supply or
potential floodwater using scoring methods by
processing spatial database maps on Geographic
Information Systems.
2) Identification of Landslide Vulnerable Areas. The
identification of landslides was carried out to
determine areas where landslides are possible
identification using the scoring method by
processing spatial data on Geographic
Information Systems.
3) Making Map of Flood and Landslide Prone Using
GIS. Making a map of flood-prone and landslide-
prone was an effort to identify non-structural
mitigation, which was done by overlaying a basic
map to model flood-prone and landslide-prone
iCAST-ES 2021 - International Conference on Applied Science and Technology on Engineering Science
1186
areas in the Badeng watershed. This overlay used
the Geographic Information System application
by utilizing secondary data. The result of this
overlay was a map of flood-prone and landslide-
prone used as a reference for field analysis or field
survey in the data validation process.
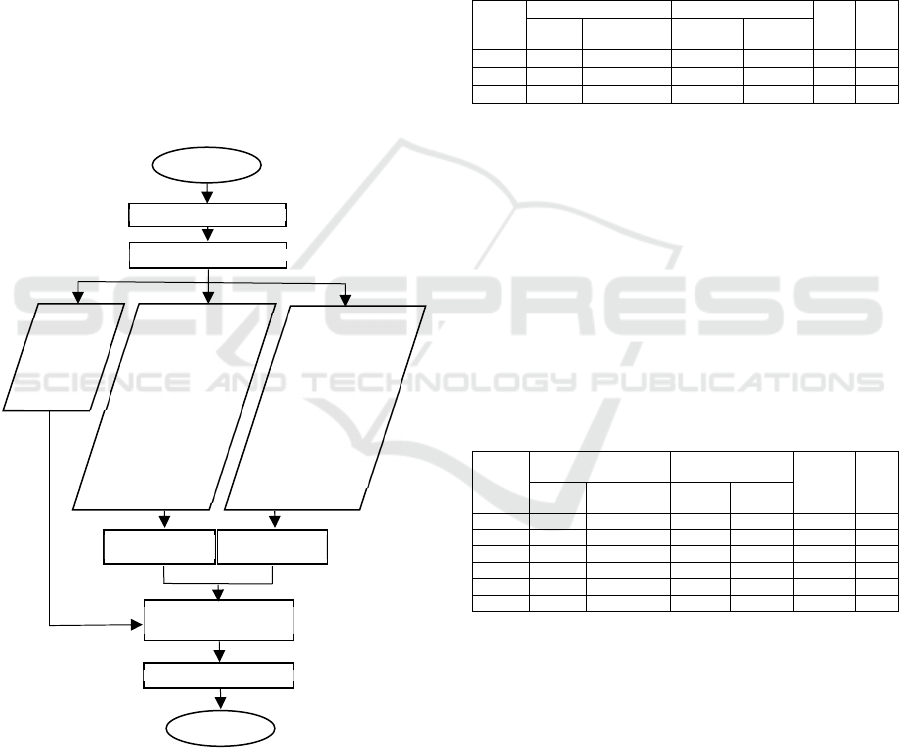
3.3 Flowchart
The research flowchart starts with the study of
literature and secondary data collection in the form of
digital maps to be used at the scoring stage of flood
hazard and landslide susceptibility parameters with
the help of GIS to be weighted to the database each
digital map. Scoring was based on a formula prone to
flooding and prone to landslides
(Paimin et al., 2009).
Then do a digital map overlay to make the location of
flood-prone areas and landslides vulnerable to
Badeng Watershed. The research flowchart could be
seen in Figure 1.
Figure 1: Flowchart of Research.
4 RESULT AND DISCUSSION
4.1 Rainfall
The intensity and distribution of the rain distribution
determine the potential points of areas prone to
flooding and landslides. Rainfall condition factors in
Table 4, such as the intensity and distribution of
rainfall distribution, determine the level of flood
vulnerability and landslide susceptibility of the
Badeng Watershed.
Table 4: Score of Rainfall Intensity Vulnerability.
Rainfall
(mm/
year)
Flood Water Supply Area Landslide-Prone Areas
Area
(Km
2
)
%
Area
Score
Level of
Vulnerability
Score
Vulnerable
Level
94 4
A Bit High
3 Moderate 10.459 19.967
90 4
A Bit High
3
Moderate
41.036 78.338
95 4
A Bit High
3
Moderate
0.887 1.694
Rainfall in the Badeng Watershed in Table 4
shows the intensity of daily rainfall in the wet month
is 90-95 mm / day.
4.2 Slope
The steeper the slope, the slope will experience
enormous load pressure, making it unstable to
withstand loads above it from the influence of gravity.
The slope of the watershed affects the amount and
time of flow to reach the outlet. The slope scoring in
the Badeng Watershed is shown in Table 5.
Table 5: Scoring of Slope Vulnerability.
Slope
(%)
Flood Water Supply
Area
Landslide-Prone
Areas
Area
(Km
2
)
%
Area
Score
Level of
Vulnerability
Score
Vulnerable
Level
0 – 2 1 Low 1 Low 2.974 5.678
2 – 8 1 Low 1 Low 23.69 45.240
8 – 15 2
A Bit Low
1
Low
6.914 13.199
15 – 25 3 Moderate 1 Low 7.977 15.229
25 – 40 4
A Bit Hi
g
h
2
A Bit Low
4.109 7.844
> 40 5 Hi
g
h 3 Moderate 6.708 12.806
The slope in the study area is spread and varies
from flat slope to steep slope. The vulnerability score
on slope <25% is one because it is classified as a
gentle slope so that the level of landslide vulnerability
is low.
4.3 River Gradients
River gradients are calculated using the Benson
method (1962). The river gradient formula (α) is as
follows:
Start
Literature Studies
Data Collectio
n
Landslide Vulnerability
Scoring
Flood Hazard Scoring
Making Flood and Landslide
Hazard Maps Using GIS
Disaster Miti
g
ation Polic
y
Finis
h
Landslide Prone
Identification
1. Digital Map of Soil
Depth
2. Digital Map of Land
Use
3. Digital Map of Slope
4. Digital Map of
Infrastructure
5. Digital Map of
Rainfall
6. Digital Map of
Population Density
7. Digital Map of
Geomorphological
8. Digital Map of
Geological
9. Digital Map of
Erosion
Flood Prone
Identification
1. Digital Map of River
Network
2. Digital Map of
Rainfall
3. Digital Map of
Watershed
4. Digital Map of Slope
5. Digital Map of Land
Use
6. Digital Map of
Morphology
Primary Data
Coordinate
Points for
Flood-Prone
and Landslide-
Prone Areas
Application of Geographic Information System for the Identification of Flood and Landslide Mitigation in Badeng Watershed
1187
=
ℎ85 − ℎ10
0,75
100%
With,
Lb = Main River Length (m)
h10 = River length at 0.1 Lb
ℎ85 = River length at 0.85 Lb
Where Lb is obtained from the length of the main
river in Badeng River, which is 35744.822 m. Then
to look for values and are as follows:
1. Find the length of the river at 0,1 (ℎ10)
ℎ10 = 0,1
ℎ10 = 0,135744,822
ℎ10 = 3574,4822
2. Find the length of the river at 0,85Lb (ℎ85)
ℎ85 = 0,85
ℎ85 = 0,8535744,822
ℎ85 = 30383,987
3. Calculate the river gradient (α)
=
ℎ85 − ℎ10
0,75
100%
=
30383,987 − 3574,4822
(0,7535744,822)
100%
=1%
The river gradient value obtained is 1%, then the
river gradient category is rather low, with a score of
2.
4.4 Morphology
The land shape is an essential aspect in identifying
areas prone to flooding because of the flatter the
shape of the land in an area, the higher the potential
for surface runoff that can cause flooding the scoring
vulnerability of landforms in the Badeng watershed in
Table 6.
Table 6: Scoring of Land-Shaped Vulnerability.
Morphology Score
Level of
Vulnerabilit
y
Area
(Km
2
)
%
Area
Mountainous 1 Low 6.708 12.806
Flat 4 A Bit Hi
g
h 2.974 5.678
Wav
y
5 Hi
g
h 7.977 15.229
Slo
p
in
g
3 Moderate 23.697 45.240
Hill
y
1 Low 4.109 7.844
Cho
ppy
5 Hi
g
h 6.914 13.199
In Table 6, the shape of the land is spread out and
varies from flat to mountainous.
4.5 Land Use
In general, the role of land cover can trigger floods
and landslides and depend on the management
aspects. Scoring of land use vulnerability in Badeng
watershed in Table 7.
Table 7: Scoring of Land Use Vulnerability.
Land Use
Flood Water Supply
Area
Landslide-Prone
Areas
Area
(Km
2
)
%
Area
Score Level Score Level
Forest 1 Low 1 Low 32.34 61.758
Rice fields 4 A Bit Hi
g
h5 Hi
g
h 13.68 26.126
Plantation 2 A Bit Low 3 Moderate 1.922 3.669
Garden 3 Moderate 3 Moderate 1.257 2.401
Settlement 5 Hi
g
h5 Hi
g
h 2.438 4.655
Inland waters 4 A Bit Hi
g
h 0 Low 0.171 0.327
Avalanche 5 Hi
g
h5 Hi
g
h 0.557 1.064
The most significant land use in the Badeng
Watershed is forest, with an area of 61.8%. Land use
in the form of forests can relatively maintain land
stability because of the root system that maintains
compactness between soil particles, soil particles with
bedrock, and can regulate water runoff.
4.6 Population Density
From the Banyuwangi Population and Civil Registry
Office data, the density of settlements in the Badeng
Watershed can be seen as follows:
a. The population density of Songgon District
=
ℎ
=
.
,
= 1135,719/
b. The population density of Singojuruh District
=
ℎ
=
.
,
= 1031,942/
c. The population density of Rogojampi District
=
ℎ
=
.
,
= 1102,616/
The calculation shows that the level of landslide
vulnerability in the density parameter of settlements
in the Badeng Watershed is low because <2000
Person/Km
2
and the landslide vulnerability score 1.
4.7 Rock Type
Rock differences are one of the parameters causing
landslides because rocks have different porosity and
permeability. Scoring of rock type vulnerability in
Badeng watershed in Table 8.
iCAST-ES 2021 - International Conference on Applied Science and Technology on Engineering Science
1188
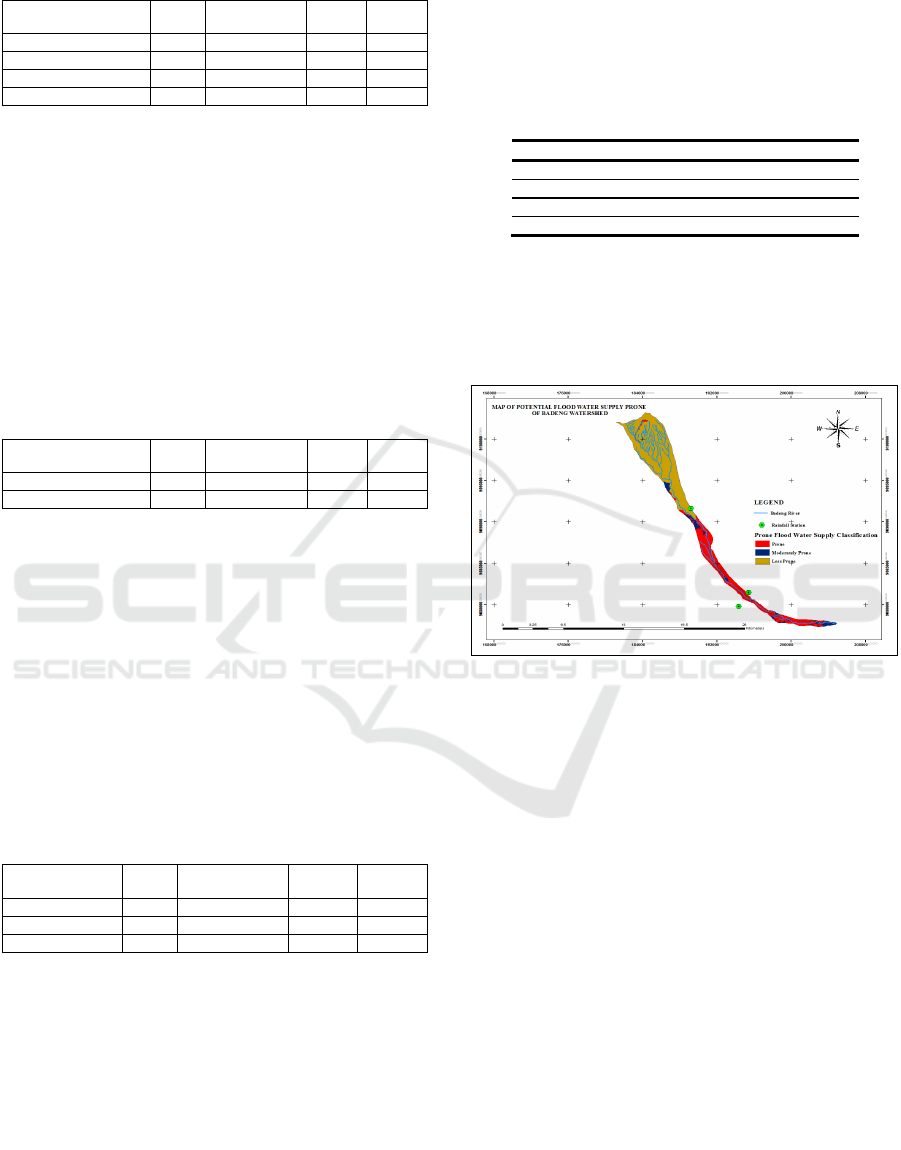
Table 8: Scoring of Rock Types Vulnerability.
Rock Type Score
Level of
Vulnerabilit
y
Area
(Km
2
)
%
Area
Kalibaru Formation 4 A Bit High 15.350 29.304
Raung Volcano Rock 5 High 12.280 23.444
Alluvium 1 Low 2.257 4.309
Pendil Volcano Rock 4 A Bit High 22.493 42.940
The most extensive distribution of rock types is
Pendil volcano rock with a large percentage of
42.94%, and the highest vulnerability category is the
type of Raung volcano rock with an area of 23.44%.
4.8 Fault/Gawirs
Areas with geological structures such as the presence
of faults or gawirs will have the potential to cause
landslides scoring of the vulnerability of faults/gawirs
in the Badeng watershed in Table 9.
Table 9: Scoring of Faults/Gawirs Vulnerability.
The Existence of Gawir Score
Level of
Vulnerability
Area
(Km
2
)
% Area
There is Gawir
5 High 0.557 1.064
No Gawir
1 Low 51.824 98.935
The geological structure in the Badeng Watershed
is in the form of a landslide with an area of 0.557
Km
2
.
4.9 Soil Depth
Landslides occur due to the launching of a soil
volume on a steep slope above a water-saturated
(rain) waterproof layer. Water entering the soil cannot
penetrate the rock layers (watertight) and will flow or
spread laterally, scoring soil depth vulnerability in the
Badeng watershed in Table 10.
Table 10: Scoring of Soil Depth Vulnerability.
Soil Depth Score
Level of
Vulnerability
Area
(Km
2
)
%
Area
30 - 60 cm 1 Low 1.423 2.717
60 - 90 cm 1 Low 16.168 30.861
>90 cm 5 High 34.797 66.420
Soil depth <100 cm is a low hazard class with a
score of 1, and >90 is a high hazard class with a
landslide vulnerability score of 5.
4.10 Distribution of Potential Flood
Water Supply in Badeng
Watershed
The results of the scoring and weighting shown in
Table 11 are categorized according to the
classification of hazard classes in the new attribute
data, which is then obtained by the extent of the area's
potential as a floodwater supply area. The distribution
of areas prone to Badeng watershed flood water
supply is shown in Table 11.
Table 11: Area Prone To Flood Water Supply.
Classification Area (Km
2
) % Area
Prone 16.852 32.170
Moderately Prone 3.179 6.069
Less Prone 32.351 61.759
Total 52.383 100
Vulnerable classes dominate the total area and
percentage level of prone floodwater supply by
32.17%. Whereas for the smallest level of floodwater
supply is a Moderately Prone hazard class at 6.07%.
The distribution is shown in Figure 2.
Figure 2: Map of the Distribution of Areas Prone to Flood
Water Supply.
Potential prone to the floodwater supply is
concentrated in the middle to downstream areas,
including in twelve villages, namely Songgon,
Sumberbulu, Parangharjo, Sumberwaru, Bedewang,
Kemiri, Cantuk, Singojuruh, Alas Malang, Benelan
Kidul, Bubuk, and Gladag. Potentially vulnerable
areas have a slope of 0-8%, making vulnerable areas,
including sloping areas. The shape of the watershed,
which tends to be oval, makes the flow concentration
characteristic longer to reach the outlet point. The
river gradient index has a value of 1 and has a flat
riverbed slope characteristic so that the flow velocity
tends to be slow, and the majority of land use and
settlement types cause the area to have a high runoff
index. The condition of potential floodwater supply
areas in Figure 3 is in Sumberbulu Village, Songgon
District at coordinates 8
0
12' 29.538" S, 114
0
10'
10.3656" E.
Application of Geographic Information System for the Identification of Flood and Landslide Mitigation in Badeng Watershed
1189
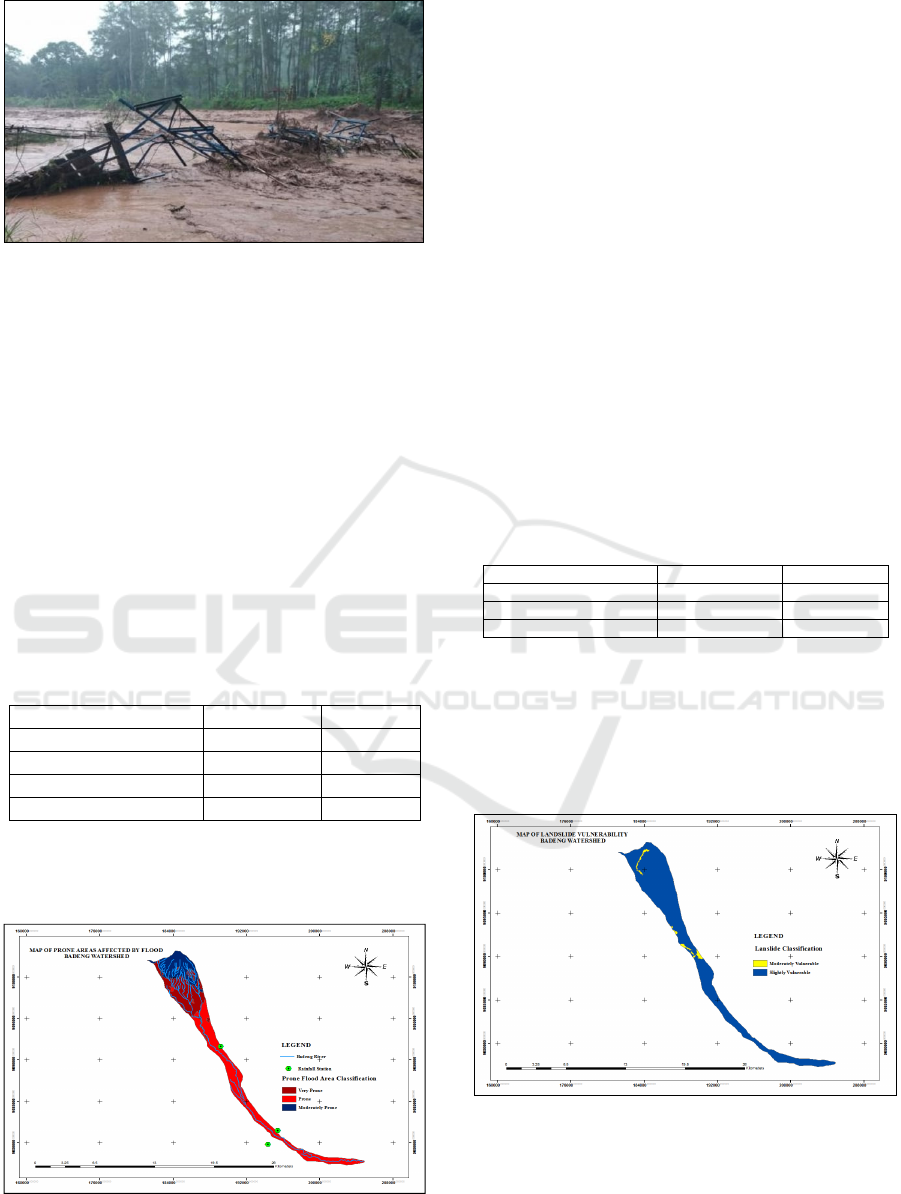
Figure 3: Flood in the Badeng River, Sumberbulu Village
In 2018.
Figure 3 is the fact that the area occurred by flash
floods due to high rainfall intensity and landslides on
the slopes of Mount Pendil.
4.11 Distribution of Potential Areas
Affected by Floods in Badeng
Watershed
The intersect index of natural and artificial
parameters in determining areas classified as flood
hazard classes in the Badeng Watershed. The
distribution of areas prone to flooding in the Badeng
watershed in Table 12.
Table 12: Area Prone To Flooding In The Badeng
Watershed.
Classification Area (Km
2
) % Area
Very Prone 14.891 28.429
Prone 26.672 50.919
Moderately Prone 10.817 20.651
Total 52.383 100
Vulnerable classes of 50.919% dominate the level
of the floodwater hazard in Table 12 in this area. The
distribution is shown in Figure 4.
Figure 4: Map of Potential Distribution of Flood-Prone
Areas in Badeng Watershed.
Figure 4 shows the results of the classification of
areas very prone to flooding in Sumber Arum Village
and Bayu Village. The condition of the vulnerable
areas on the map in the survey to prove the actual field
conditions, the results of the field survey in the Bayu
Village, Songgon District at the coordinates 8
0
12'
34.8948" S, 114
0
11' 2.1084" E. This area has a
sloping land shape with a slope of 2% - 8%,
containment by river branches is absent, and there are
no water structures such as dykes or reservoirs. The
condition of the river flow is classified as straight, and
many bends increase the distance of water to get to
the outlet causing the area to have a high runoff index.
4.12 Distribution of Vulnerable Areas of
Landslides
The results of the intersect index of natural and
artificial parameters in determining areas classified as
landslide susceptibility class in Badeng Watershed.
The distribution of landslide-prone areas in the
Badeng watershed in Table 13.
Table 13: Area Prone to Landslides.
Classification Area (Km
2
) % Area
Moderately Vulnerable 1.408 2.688
Slightly Vulnerable 50.973 97.311
Total 52.383 100
The level of landslide susceptibility in this area is
dominated by a slightly vulnerable class of 97.31%.
Whereas for the smallest level of landslide
susceptibility, the vulnerability class is moderately
vulnerable to 2.69%. The distribution is shown in
Figure 5.
Figure 5: Map of the Distribution of Landslide Vulnerable
Areas in Badeng Watershed.
The results showed that the area of landslide
susceptibility in the Badeng Watershed is divided into
two classes, namely, Moderately Vulnerable and
iCAST-ES 2021 - International Conference on Applied Science and Technology on Engineering Science
1190

Slightly Vulnerable. Landslide prone areas are
dominated by slope >40% so that it affects surface
water flow velocity. The results showed that the
higher the slope, the higher the level of landslide
vulnerability. In the study area, the level of landslide
susceptibility is slightly vulnerable, dominated by
residential land use and rice fields. Settlements and
rice fields have vegetation that cannot maintain
surface stability because it is inundated and has a
shallow root system that does not maintain soil
particles' compactness.
4.13 Mitigation Policy
Based on a map of flood and landslide hazards in the
Badeng Watershed, steps can be taken to prevent
flood and landslide disasters based on Regulation of
the Minister of Home Affairs of the Republic of
Indonesia No. 33 of 2006 in Table 14 and Table 15.
One of the mitigation policy recommendations is the
innovation of interlock bricks with a mixture of
bagasse ash without combustion used to control land
erosion in the upper reaches of the Badeng River
(Erwanto et al., 2020).
Table 14: Recommendations for Badeng Watershed Flood
Mitigation Policy.
Mitigation Steps
Responsible
A
g
enc
y
Prone
Location
Reference
Supervision
Land Use and Site
Planning
Ministry of Public
Works, Provincial /
Regency
Government
Sumber Arum Flood Hazard Map,
Flood Water
Supply Prone Area
Map, and Base
Ma
p
.
The Construction
of drainage
channels and
reservoirs.
Ministry of Public
Works, Provincial /
Regency
Government
Alas Malang,
Singojuruh,
and Songgon
Public awareness o
f
the possibility of
floods and how to
overcome them.
Infrastructure
development and
vegetative and
mechanical
conservation in the
upstream area of
the river and
conservation
buildings in the
form of a check
dam / Gully plug,
and slo
p
in
g
terrace.
Ministry of Public
Works, Provincial /
Regency
Government,
Department of
Environment
Sumber Arum,
Bayu and
Songgon
Plan and readiness
of facilities that are
safe from flooding.
River dredging,
making river banks
with open channels.
Ministry of Public
Works, Provincial /
Regency
Government
Gladag, Alas
Malang,
Singojuruh,
Sumberbulu,
and Son
gg
on
Early warning,
District / City
Master Plan.
Staff training in
disaster
management,
Medical
engineering,
Support.
Ministry of Social
Affairs, Ministry of
Health
Sumber Arum,
Bayu, Sumber
Bulu, Parang
Harjo,
Bedewang,
Cantuk,
Benelan
Kidul, Bubuk,
Gladag, Alas
Malan
g
,
It is increasing the
quantity and quality
of Human
Resource, Health,
and others.
Mitigation Steps
Responsible
A
g
enc
y
Prone
Location
Reference
Gintangan,
Kemiri,
Parangharjo,
Singojuruh
and Son
gg
on
Flood vigilance
training
Ministry of
Research and
Technology,
Technology
Assessment and
Application
Agency, Indonesian
Institute of
Sciences, Ministry
of Public Works
Sumber Arum,
Bayu, Sumber
Bulu, Parang
Harjo,
Bedewang,
Cantuk,
Benelan
Kidul, Bubuk,
Gladag, Alas
Malang,
Gintangan,
Kemiri,
Parangharjo,
Singojuruh
and Songgon
The Early Warning
System, Master
Plan of City
Drainage.
Flood disasters
evacuation
preparation such as
boats and other
rescue equipment
Ministry of Social
Affairs, Ministry of
Health, Ministry of
Public Works,
N
ational Search
and Relief Agency
Sumber Arum,
Bayu, Sumber
Bulu, Parang
Harjo,
Bedewang,
Cantuk,
Benelan
Kidul, Bubuk,
Gladag, Alas
Malang,
Gintangan,
Kemiri,
Parangharjo,
Singojuruh
and Son
gg
on
It is increasing the
quantity and quality
of Human
Resource, Health,
and others.
Table 15: Recommendations for Badeng Watershed
Landslide Mitigation Policy.
Mitigation
Ste
p
s
Responsible
A
g
enc
y
Vulnerable
Locations
Reference
Introduction
of Landslide-
prone areas.
Ministry of
Research and
Technology,
Technology
Assessment and
Application
Agency,
Indonesian
Institute of
Sciences,
Ministry of
Public Works
Sumber Arum, Bayu,
Sumber Bulu, Parang
Harjo, Bedewang,
Cantuk, Benelan
Kidul, Bubuk,
Gladag, Alas Malang,
Gintangan, Kemiri,
Parangharjo,
Singojuruh and
Songgon
Emergency plan
to deal with
landslides, Map
of landslide
vulnerable areas.
Identification
of areas that
are actively
moving can be
recognized by
the existence
of horseshoe-
shaped cracks
(horseshoe)
Ministry of
Research and
Technology,
Technology
Assessment and
Application
Agency,
Indonesian
Institute of
Sciences,
Ministry of
Public Works
Sumber Arum Appropriate and
successful
applied
technology to
prevent, reduce
the impact of
landslides.
Closing
fissures on the
slope to
prevent water
from entering
quickly into
the ground
Ministry of
Public Works,
Provincial /
Regency
Government,
Ministry of
Forestry,
Department of
A
g
riculture
Sumber Arum Landslide Prone
Map, Disaster
Risk Map.
Application of Geographic Information System for the Identification of Flood and Landslide Mitigation in Badeng Watershed
1191

Table 15: Recommendations for Badeng Watershed
Landslide Mitigation Policy (Cont.).
Mitigation
Ste
p
s
Responsible
A
g
enc
y
Vulnerable
Locations
Reference
Greening With
Plant The
System
The Roots Are
Inside
Ministry of
Forestry,
Department of
Agriculture,
Department of
Environment
Sumber Arum, Bayu,
and Sumber Bulu
Citizen's
awareness
will possible
landslide disaster
and how to
handle it.
Terracing Ministry of
Public Works,
Provincial /
Regency
Government,
Ministry of
Forestr
y
Sumber Arum,
Sumber Bulu, and
Songgon
Emergency Plans
in Facing
Landslides.
5 CONCLUSIONS
Identification of disaster mitigation in areas prone to
flooding and landslide-prone areas in the Badeng
Watershed with a Geographic Information System
concluded:
a. The distribution of floodwater supply areas
consists of a prone of 32.170% spread in the
Villages of Sumber Arum, Sumber Bulu, Sumber
Baru, Songgon, Parang Harjo, Bedewang, Kemiri,
Benelan Kidul, Bubuk, Cantuk, Gintangan,
Singojuruh, Alas Malang, Bayu and Gladag, the
risk level is Moderately Prone at 6.069% in the
villages of Songgon, Bayu, Bubuk, Benelan
Kidul, Gladag, Sumberbulu, Sumber Arum,
Sumber Baru, Bedewang, Kemiri, Singojuruh,
and Gintangan. The level of risk is Less Prone at
61.759% in the Villages of Sumber Arum,
Sumber Bulu, and Bayu. Disaster mitigation in
flood water supply areas in the form of river
dredging, land use monitoring and location
planning in prone areas, and flood awareness
training for vulnerable communities.
b. Distribution of locations prone to flooding there is
a very prone risk level of 28.43% in the villages
of Sumber Arum and Bayu, a risk-prone level of
50.919% spread in the villages of Sumber Arum,
Bayu, Sumber Bulu, Sumber Baru, Songgon,
Parang Harjo, Bedewang, Kemiri, Benelan Kidul,
Bubuk, Cantuk, Gintangan, Singojuruh, Gladag
and Alas Malang and then the risk level is
Moderately Prone at 20.651% in the Villages of
Sumber Arum and Bayu. Disaster mitigation in
areas prone to flooding in the upstream area of the
Badeng Watershed in the form of vegetative and
mechanical conservation development in the
upper river and conservation buildings in the form
of check dam/gully plugs, and terraces. Also,
building construction of drainage channels and
reservoirs around the banks of the Badeng river.
c. Distribution of landslide vulnerability maps for
the Badeng Watershed, there is a Moderately
Vulnerable risk level of 2.688% spread in the
Village of Sumber Arum, Sumber Bulu, Bayu,
and Songgon and than a Slightly Vulnerable risk
level of 97.311% spread in the Villages of Sumber
Arum, Bayu, Sumber Bulu, Sumber Baru,
Songgon, Parang Harjo, Bedewang, Kemiri,
Benelan Kidul, Bubuk, Cantuk, Gintangan,
Singojuruh, Gladag, and Alas Malang. Areas with
a high level of risk of landslides are areas where
there are fractures of land due to landslides that
have previously occurred in the area. Disaster
mitigation in landslide-prone areas in the form of
terracing, and greening by stabilizing slopes and
closing fissures on slopes to prevent water from
entering quickly into the ground.
ACKNOWLEDGEMENTS
Thanks to Politeknik Negeri Banyuwangi for funding
research based on the research master plan scheme.
The second time to the research team for their
cooperation so that we can complete our research
activities.
REFERENCES
BNPB. (2007). Penanggulangan Bencana, 4. Retrieved
from
https://www.bnpb.go.id/ppid/file/UU_24_2007.pdf.
Erwanto, Z., and Lestari, N. (2020). Study of Rainfall
Erosivity and Erosion Rate with MUSLE Method Using
Geographic Information System In Badeng Watershed.
The 3rd International Conference on Applied Science
and Technology (iCAST) 2020. Politeknik Negeri
Padang.
Erwanto, Z., Holik, A., Pranowo, D. D., Prastyo, S.D.B,
Husna, A. 2020. Hydrological Modeling Using SWAT
Due to Landslides In The Badeng Watershed. The 3rd
International Conference on Applied Science and
Technology (iCAST) 2020. Politeknik Negeri Padang.
Erwanto, Z., Holik, A., Pranowo, D.D., Afifa, S.N. (2021).
Identification of Land Criticism for Land Conservation
Actions in The Badeng Watershed with Regulation of
Watershed and Protection Forest Management. The 4th
International Conference on Applied Science and
Technology (iCAST) 2021. Politeknik Negeri
Samarinda.
Erwanto, Z., Pranowo, D. D., Holik, A., Amin, M. S., &
Darmawan, F. (2020). The Innovation of Interlock
Bricks with A Mixture of Bagasse Ash Without
iCAST-ES 2021 - International Conference on Applied Science and Technology on Engineering Science
1192

Combustion. IOP Conference Series: Materials
Science and Engineering. 854 (1).
Faizana, F., Nugraha, A. L., & Yuwono, B. D. (2015).
Pemetaan Risiko Bencana Tanah Longsor Kota
Semarang. Jurnal Geodesi . 4 (1), 223-234.
Hendi, H., Sulwan, P., Adi, S. (2014). Analisa Daerah
Rawan Banjir Menggunakan Aplikasi Sistem Informasi
Geografis (Studi Kasus Pulau Bangka). Jurnal
Konstruksi. 1 (1), 1-14.
Novaliadi, D., & Hadi, M. P. (2016). Pemetaan Kerawanan
Banjir Dengan Sistem Informasi Geografis di Sub DAS
Karang Mumus Provinsi Kalimantan Timur. Jurnal
Teknik Sipil. 2 (1), 1-8.
Paimin, Sukresno, & Pramono, I. B., (2009). Teknik
Mitigasi Banjir dan Tanah Longsor. (A. N. Ginting,
Ed.) Balikpapan: Tropenbos International Indonesia
Programme.
PERATURAN MENTERI DALAM NEGERI NOMOR 33
TAHUN 2006. PEDOMAN UMUM MITIGASI
BENCANA. (2006). Retrieved from
https://peraturan.bkpm.go.id/jdih/userfiles/batang/Per
mendagri_33_2006.pdf.
Susanti, P. D., & Mlardini, A. (2016). Analisis Tingkat
Kerawanan dan Teknik Mitigasi Longsor di Sub DAS
Merawu. Prosiding Seminar Nasional Geografi UMS.
1 (1), 139-150.
Todingan, M. P., Sinolungan, M., Kamagi, Y. E., &
Lengkong, J. (2015). Pemetaan Daerah Rawan Longsor
di Wilayah Sub DAS Tondano Dengan Sistem
Informasi Geografis. Jurnal Geologi. 4 (1), 1-12.
Application of Geographic Information System for the Identification of Flood and Landslide Mitigation in Badeng Watershed
1193
