
Analysis of Polycrystalline Solar Panel Energy Supply in Series and
Parallel Circuits for on-Grid PLTS
I Nyoman Sugiarta
Electrical Engineering, Politeknik Negeri Bali, Jimbaran, Bali, 80361, Indonesia
Keywords: PLTS on-Grid, Series Circuits, Parallel Circuits, Smart Grid Inverters, Polycrystalline Solar Panels.
Abstract: This on-grid PLTS utilizes renewable energy in the form of solar energy combined with PLN's power grid.
One of the most basic needs in the education process on campuses, schools, both private and government
especially during the day is the use of LCDs, practical equipment, computers / laptops and air conditioners.
From the research results of Polycrystalline Solar Panel Energy Supply Analysis in Series and Parallel Circuits
for on-grid PLTS using smart grid inverters, the average electrical energy produced by two solar panels
arranged in series in various weather is 0.3 kWh/day while in parallel circuits 0.2 kWh/day. The graph of
electrical energy (kWh/day) in series is higher than in parallel circuits. The average electrical energy produced
by one solar panel of 200 Wp on an on-grid system in various weather is 0.187 kWh/day while for two 100
Wp solar panels arranged in series is 0.336 kWh/day. The graph of electrical energy produced by two 100 Wp
solar panels in a series circuit is higher than one 200 Wp solar panel. For on-grid systems two 100 Wp solar
panels arranged in series are better than one 200 Wp solar panel. It can be concluded that the series circuit is
able to obtain maximum electrical energy in the on-grid system by using a smart inverter compared to two
100 Wp solar panels arranged in parallel and one 200 Wp solar panel.
1 INTRODUCTION
This enormous potential of solar energy can be
utilized as electrical energy with the help of
photovoltaic technology, which is technology that is
able to convert sunlight directly into electrical energy.
The use of photovoltaic technology as a power plant
in Indonesia is known as PLTS (Solar Power
Generation). PLTS is a power plant that fully utilizes
sunlight as an energy source. Types of solar cells
include monocrystalline and polycrystalline.
Polycrystalline types have lower efficiency and
greater dimensions compared to monocrystalline
types. However, this type can produce electrical
energy in cloudy weather conditions and has a lower
price so it is widely used in the market (Muhammad,
2017). On-grid PLTS is one of the main examples of
generating systems that are properly applied to areas
that are already covered by large-scale and small-
scale generating systems. This on-grid PLTS utilizing
renewable energy in the form of solar energy
combined with existing power networks such as
diesel or other existing energy sources. Solar energy
is converted into electrical energy through
photovoltaic modules that are directly channeled to
the electricity network that was previously supplied
by the Diesel Generator Set or other source, so that it
becomes a more efficient and reliable system to be
able to supply electrical energy needs during the day.
One of the most basic needs in the education process
on campuses, schools, both private and government
especially during the day is the use of LCDs, practical
equipment, computers / laptops and air conditioners.
To support a government program that launches
"green energy" and energy savings or energy
efficiency, the authors plan the study of
Polycrystalline Solar Panel Energy Supply Analysis
in the Series and Parallel Series for on-grid PLTS.
2 METHOTOLOGY
Monthly average insulation on horizontal surfaces at
the indicated GMT (kW / m
2
/ day) data for Denpasar,
Bali (Narottama, 2017). as table 1.
1180
Sugiarta, I.
Analysis of Polycrystalline Solar Panel Energy Supply in Series and Parallel Circuits for on-Gr id PLTS.
DOI: 10.5220/0010962000003260
In Proceedings of the 4th International Conference on Applied Science and Technology on Engineering Science (iCAST-ES 2021), pages 1180-1183
ISBN: 978-989-758-615-6; ISSN: 2975-8246
Copyright
c
2023 by SCITEPRESS – Science and Technology Publications, Lda. Under CC license (CC BY-NC-ND 4.0)
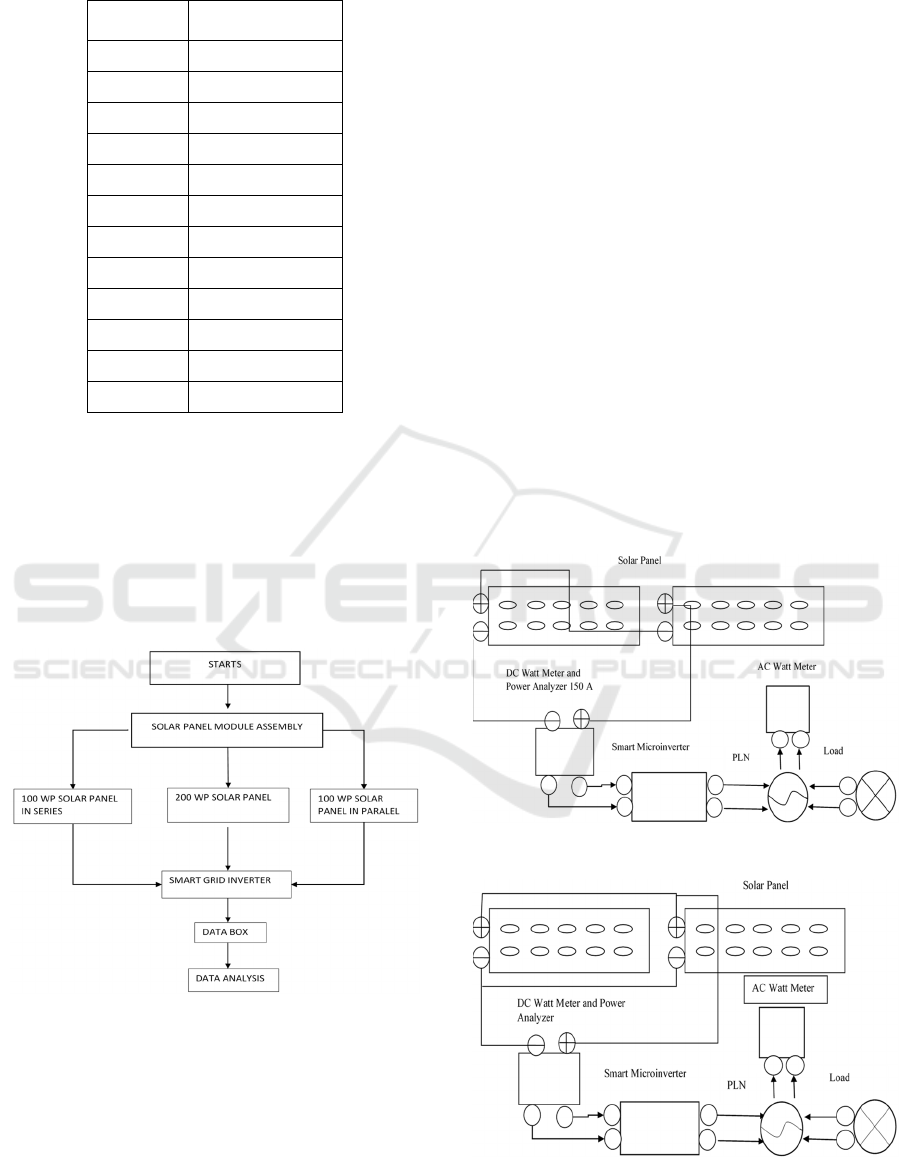
Table 1: Monthly Average Insulation For Denpasar, Bali.
Month 22-year average
Jan 4.93
Feb 5.04
Mar 5.43
Apr 5.39
May 5.19
Jun 4.84
Jul 4.79
Aug 5.33
Sep 5.95
Oct 6.19
Nov 5.67
Dec 5.28
The lowest isolation occurred in July of 4.79 (kW/m
2
/day) and the highest in October was 6.19 (kW/ m
2
/day). The average insulation measured is 5.335833
(kW/ m
2
/day).
2.1 Research Flow Chart
The research flow chart can be seen as shown in the
figure 1.
Figure 1: Research flow chart.
2.2 Tools and Materials Used
The materials and measuring instruments used in this
research are as follows:
1. 100 Wp and 200 Wp Polycrystalline solar
panels.
2. Solar Smart Microinverter SG 600.
3. Data Box - Data Collector (Model
DataBox24G).
4. High-precision watt meter.
5. Digital AC Wattmeter 0-3680 W.
6. MC4 Solar Panel PV Cable Connectors
7. 20m Solar Cell Green Power cable.
8. 20m PLN cable 3x2.5 mm.
Measurement and data collection were carried out
empirically at the same time using a data box
connected to a computer.
3 RESULTS AND DISCUSSION
3.1 Research Objectives and Location
This research was conducted at Kodya Denpasar, Bali
using 100 WP polycrystalline solar panels arranged in
series and parallel. Kodya Denpasar is located at
coordinates 8.67 south latitude and 115.21 east
longitude. This study aims to determine the difference
in electrical energy produced by solar panels arranged
in series in the figure 2 and parallel in the figure 3 on
the PLTS on-grid system.
Figure 2: PLTS series on-grid.
Figure 3: PLTS parallel on-grid.
Analysis of Polycrystalline Solar Panel Energy Supply in Series and Parallel Circuits for on-Grid PLTS
1181
The specification of poly crystalline 100 Wp in the
table 2 and poly crystalline 200 Wp as shown in the
table 3.
Table 2: 100 Wp solar panel specifications.
Item Value
Model
Rated Maximum Powe
r
SP100-18P
100W
Cell Efficiency
Open Circuit Voltage
(Voc)
16.93%
21.8 V
Short Circuit Current
(Isc)
6.05 A
Voltage at Maximum
Power
(
Vm
p)
17.8 V
Current at Maximum
Power
(
Im
p)
5.62 A
Power Tolerance ±3%
Max System Voltage
Series fuse rating(A)
1000 V
12
Number of b
yp
ass diode 2
Operating temperature
Cell Technology
Dimension
(
mm
)
-4
0
C to 85
0
C
Poly-Si
1000x670x30mm
Table 3: 200 Wp solar panel specifications.
Item Value
Model
Rated Maximum Power
(Pm)
GH200P-20
200W
Power Tolerance
Open Circuit Voltage
(
Voc
)
3%
30.87 V
Short Circuit Current
(Isc)
8.51 A
Voltage at Maximum
Power (Vmp)
24.72 V
Current at Maximum
Power
(
Im
p)
8.10 A
Max System Voltage
Normal Operating Cell
Tem
p
(
NOCT
)
1000 V
47± 2
0
C
Number of bypass diode 2
Operating temperature
Cell Technology
Dimension (mm)
-40
0
C to 85
0
C
Poly-Si
1320x992x35mm
3.2 Data Analysis
3.2.1 Theoretical Energy Results
The output power generated from the solar panel can
be calculated based on the specifications of the solar
panel used, and also by using the equation: (Eka,
2014).
The average insulation measured in Kodya
Denpasar is 5.335833 (kW/ m 2 /day)
The area of solar panels used in the research is
0.67 m 2 (100 Wp) and 1.3 m 2 (200Wp)
The efficiency of the solar panel η = 0.1693
Then the solar panel output power of 100 Wp is
calculated by the formula:
P (watt peak) = Area x PSI x η
P (watt peak) = 0.67 [m 2] x 2 panels x 5.34 [kWh/m
2 /day] x 0.1693 PG = 1.216 [kWh/day]
P (watt peak) = 36.48 [kWh / month]; PG = 443.84
[kWh/year]
Then the solar panel output power of 200 Wp is
calculated by the formula:
P (watt peak) = Area x PSI x η
P (watt peak) = 1.3 [m 2] x 1 panel x 5.34 [kWh/m 2
/day] x 0.1693 PG = 1.175 [kWh/day]
P (watt peak) = 35.26 [kWh / month]; PG = 423,101
[kWh/year]
Information:
Area = Area of solar panels
PSI (Peak Solar Insulation) = Average solar
insulation
η = solar panel efficiency
3.2.2 Empirical Energy Results
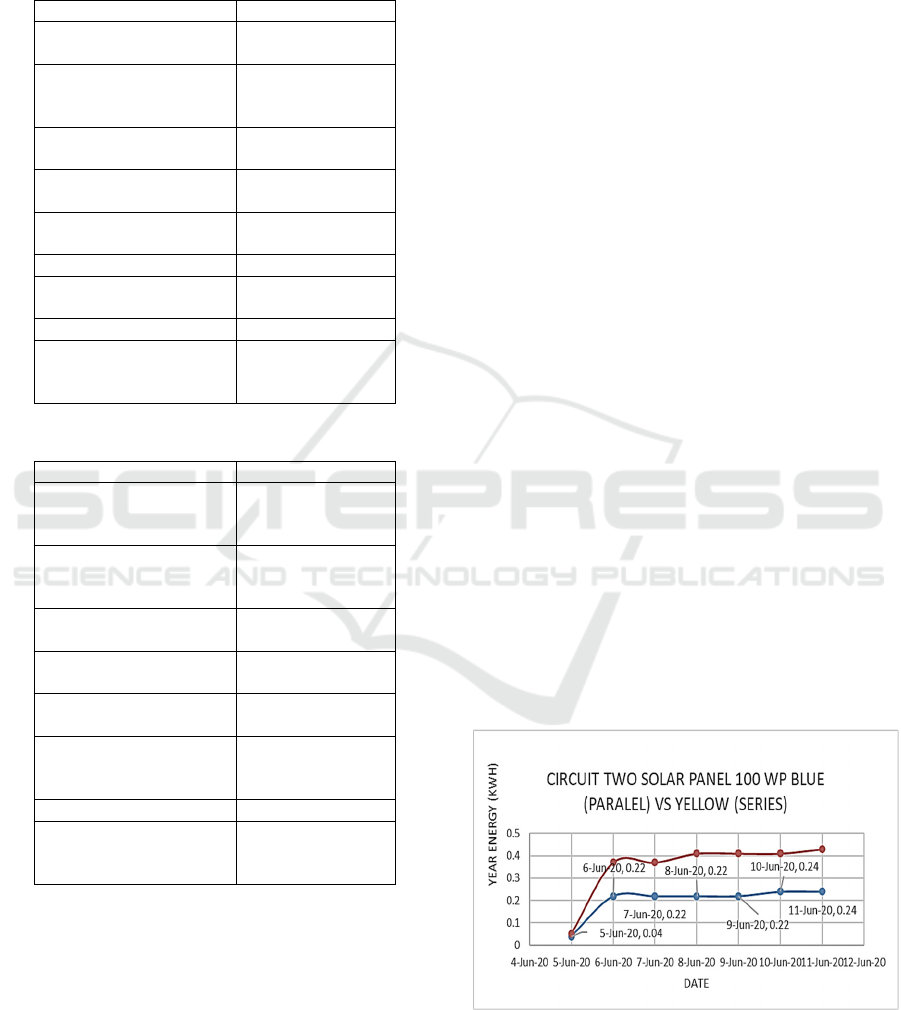
Electrical energy generated from two solar panels
arranged in series and two solar panels arranged in
parallel at the same time as figure 4 and one solar
panel 200 Wp, two solar panels 100 Wp series.
Figure 4: Graph of electrical energy produced by two series
solar panels and two parallel solar panels.
iCAST-ES 2021 - International Conference on Applied Science and Technology on Engineering Science
1182
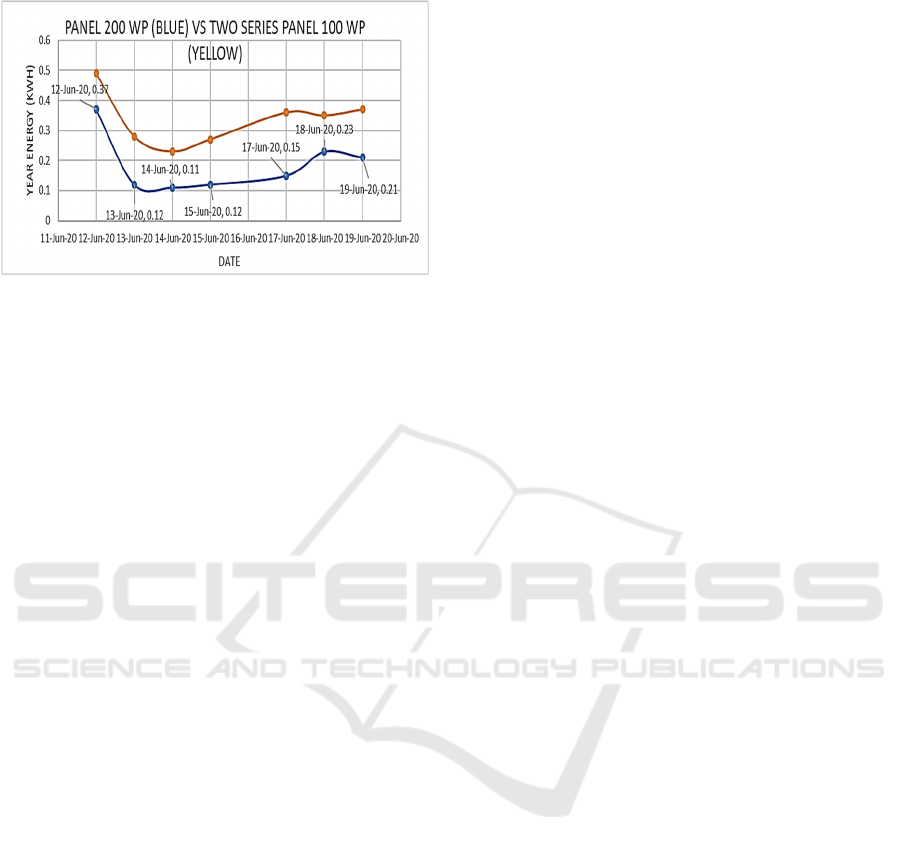
Figure 5 below:
Figure 5: Graph of electrical energy produced by one solar
panel 200 Wp vs two solar panels 100 Wp series.
The average electrical energy produced by one
solar panel is 200 Wp in an on-grid tie system in
various weather 0.187 kWh per day while for two 100
Wp solar panels arranged in series is 0.336 kWh. In
figure 5 can be seen a graph of electrical energy
produced by two 100 Wp solar panels in a series
circuit higher than one 200 Wp solar panel. For on-
grid systems two series 100 Wp solar panels arranged
in series are better than one 200 Wp solar panel. It
should also be remembered that the installation of
solar panels in the series of allowable voltage limits
does not exceed the smart grid inverter voltage limits
used.
4 CONCLUSIONS
The average electrical energy produced by two solar
panels arranged in series on an on-grid tie system in
various weather 0.3 kWh per day while for solar
panels arranged in parallel is equal to 0.2 kWh. The
graph of electrical energy produced by solar panels in
series is higher than solar panels arranged in parallel.
For on-grid systems the series of solar panel series is
better than parallel circuit solar panels. The average
electrical energy produced by one solar panel is 200
Wp in an on-grid tie system in various weather 0.187
kWh/day while for two 100 Wp solar panels arranged
in series is 0.336 kWh. The graph of electrical energy
produced by two 100 Wp solar panels in a series
circuit is higher than one 200 Wp solar panel. For on-
grid systems two series 100 Wp solar panels arranged
in series are better than one 200 Wp solar panel. It can
be concluded that the series circuit is able to get
maximum electrical energy in the on-grid tie system
by using a smart inverter. It should also be
remembered that the installation of solar panels on
this circuit allowable voltage limits do not exceed the
smart grid inverter voltage limits that are used. The
theoretical energy calculation of two solar panels 100
Wp produces 1,216 [kWh/day], while the electrical
energy results of two solar panels arranged in series
empirically get an average yield of 0.3 - 0.336
kWh/day. The theoretical energy calculation of 200
Wp solar panels yields 1,175 [kWh/day], while the
energy yield empirically yields an average of 0.187
kWh/day.
ACKNOWLEDGEMENTS
This research was funded by DIPA of the Bali State
Polytechnic (PNB) No. SP.DIPA-042.01.2.401006 /
2020. We thank the Center for Research and
Community Service (P3M PNB) for providing the
kind of support.
REFERENCES
Muhammad Fahmi Hakim, (2017). Design of Rooftop off
Grid Solar Panels in Residential Houses as an
Alternative Source of Electric Energy, 2017 Dotcom
Dynamics Journal | ISSN 2086-2652 | Vol. 8 No.
January 1, 2017
Narottama AA NM, Amerta Yasa K, Suwardana IW,
Sapteka AA NG and Priambodo PS (2017). Analysis of
AC and DC Lighting Systems with 150-Watt Peak
Solar Panels in Denpasar Based on NASA Data, The
2nd International Joint Conference on Science and
Technology (IJCST 2017)
Eka Meilia Suryanti, Rosmaliati, Ida Bagus Fery Citarsa
(2014). Performance Analysis of On-Grid Photovoltaic
Systems in Gili Trawangan Solar Power Plant (PLTS),
Dielektrika, ISSN 2086-9487 Vol. 1, No. 2: 82 - 95,
August 2014
Sapteka AA N G, Narottama AA N M, Sugiarta I Nym, Ta
I Kt, Priambodo P and Djaya Putra N S (2018). Water
Cooling on 30 Watt-peak Solar Panels, IEEE, 2018
International Conference on Applied Science and
Technology (ICAST)
Sapteka AA Ng G, Narottama AA Ng M, Sugiarta I Nym,
Priambodo PS and Djaya Putra NS (2018). A Study of
Heat Pipe as Thermal Management on 30 Wp Solar
Panels, Atlantis Highlights in Engineering (AHE),
volume 1, International Conference on Science and
Technology (ICST 2018)
Analysis of Polycrystalline Solar Panel Energy Supply in Series and Parallel Circuits for on-Grid PLTS
1183
