
Analysis of Farmland Potency to Improve Community Economy in
Letbaun Village Semau Sub-district Kupang District East Nusa
Tenggara Province
Sutirto, Yunus Fallo
and Amy Wadu
Civil Engineering Lecturer, Kupang State Polytechnic, Kupang City, East Nusa Tenggara, Indonesia
Keywords: Farm Potency, Improving Community Economy,Water Needs Supply.
Abstract: Semau Island is a small island with a minimum population of 8000 people who come from the Helong tribe,
one of the tribes in East Nusa Tenggara. The location of this island is in the waters west of Timor Island, west
of Kupang City. Kupang City is the administrative center of East Nusa Tenggara Province. Letbaun Village,
Semau District, Kupang Regency has productive land to be used as agricultural land. Constrained by the
limited availability of water, so the land is not utilized so that it becomes a shrub field. The results of the
analysis of the potential of agricultural land in this village are 900,126 hectares of the total area of 1,379,634
hectares or 65.24% of the total area. And to meet the water needs, a reservoir was built in Sub-watershed 10
at coordinates 123°24'23.41” East Longitude and 10°11'44.23” South Latitude with a water capacity of
442,230 m3/second every 10 years with a Chatment Area of 215,571 Ha. In this case, the provision of land
by optimizing non-productive land into productive land will overcome the problem of food supply shortages.
1 INTRODUCTION
At present, one of the goverment targets is making
Indonesia as food-self sufficiency country. Therefore
it is planned various goverment program to achieve
that goal, even in the remote regions is strived for
improving like East Nusa Tenggara province
(NTT).It has to be supported by some factors, among
other are natural resources and human resources.
Indonesia is very famous with the strategic location
so that it has farmland which becomes the primary
livelihood for the people. The dominant factor in
improving the agriculture is the water supply, NTT
region is one of the regions that always experiences
the drought and the lack of water. To answer it
therefore the water management is needed in order to
fulfill the people need.The goverment attempts to
build irrigation area in dry land or wet land which
have potency to be improved into farmland that can
fulfill the needs of the community. The limited water
supply is one of the obstacles in improving the
community welfare in Kupang District through
agricultural sector which is the biggest income
resource for the community in general in Kupang
District or Central Kupang Sub-District, but the
yields or agricultural product is still low.
Pesident Joko Widodo said that the problem in
East Nusa Tenggara is only the water, the
improvement of NTT depends on water supply. The
people in East Nusa Tenggara region have various
livelihoods, one of them is farming. The goverment
tries to build the irrigation area in dry land or wet land
that has potency to be improved into farmland that
can fulfill the people needs (Juditha, 2016).
Semau island is a small island that populated
about 8000 people who come from Helong tribe,one
of the tribes in East Nusa Tenggara Province. The
location of Semau island is in the Western waters of
Timor island,it is in the west of Kupang city, Kupang
city is the government centre of East Nusa Tenggara
province. In Letbaun Village Semau Sub-District,
there is productive land to be made into farmland.
According to the background and the problem
above, it is required the Analysis Study of Land
Usage as The Farmland to Improve The Community
Economy in Letbaun Village Semau Sub-District
Kupang District East Nusa Tenggara Province.
1158
Sutirto, ., Fallo, Y. and Wadu, A.
Analysis of Farmland Potency to Improve Community Economy in Letbaun Village Semau Sub-district Kupang District East Nusa Tenggara Province.
DOI: 10.5220/0010961300003260
In Proceedings of the 4th International Conference on Applied Science and Technology on Engineering Science (iCAST-ES 2021), pages 1158-1168
ISBN: 978-989-758-615-6; ISSN: 2975-8246
Copyright
c
2023 by SCITEPRESS – Science and Technology Publications, Lda. Under CC license (CC BY-NC-ND 4.0)
2 LITERATURE REVIEW
2.1 DAS (Watershed) Managemen
DAS management is a formulation process and
activity implementation or a program that
manipulated the natural resources and human
resources in watershed to obtain the benefit of
production and service without causing the damage of
water and land resources. Included in the DAS
management is linkages identification between land
use, land and water, and the linkages between
upstream areas and downstream areas of the DAS
(Asdak,2004:5).
2.1.1 Spatial System based on Land and
Water Conservation
Spatial system is a way to manage, to plan, to run and
to control the region. In the sustainable spatial
system, variables of economy, social and
conservation of water and land resources become the
unity.
Border requirement for spatial planning that based
on land and water conservation is using the border of
watershed (DAS).
2.1.2 Land Conservation
Land conservation is efforts to use, to maintain and to
protect the land resource, or an effort to improve and
to protect land resources. Generallyland conservation
is to protect the land from the rainfall directly, to
improve the capacity of land infiltration, to reduce the
surface runoff, to improve land aggregate stability
(Hardjowigeno, 1995).
Therefore, the thing that is very important in
utilizing the land resources is the analysis of that land
ability. Based on this land ability analysis, the
direction of land usage can be known so that the land
conservation can be one of the bases in spatial
arrangement.
2.1.3 Water Conservation
Water conservation is the efforts in utilizing and
protecting the water resources. Empowering water
conservation principle in spatial planning is an
effective way to maintain nature condition and
environment equilibrium.
From the description above, it can be interpreted
that water conservation is an effort to put the water
into the soil in order to fill groundwater, both natural
recharge and artificial recharge.
2.1.4 AGWA Model (Automated Geospatial
Watershed Assessment) Tool
Kineros method is a part of AGWA extension which
is a tool to analize the hidrology phenomenon for the
research about watershed. This model is designed to
stimulate the infiltration process, the depth of surface
runoff and erosion that occurs in a DAS with
relatively small scale that is ≤ 100 km2 (Agwa, 2000).
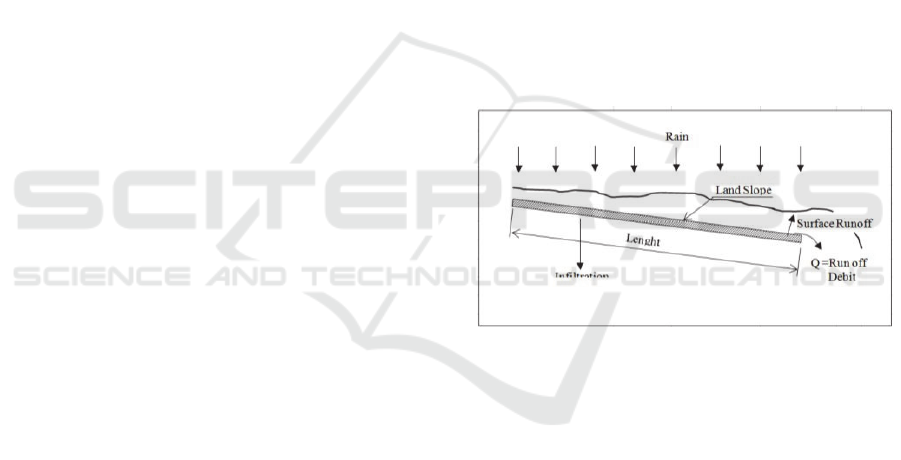
2.2 Philosophical Idea of Kineros
Method
The idea of Kineros method is if a land gets rain with
certain intensity, then the part of water that falls into
land surface will be infiltrated into the land until the
certain saturation limit, whereas the other part will
overrun on the land surface or flooded. This condition
depends on the land ability to absorb the water based
on various factors that influence it, such as the slope
of the land, the components of land structure and the
soil physical properties (
Bisri, 2017).
Figure 1: Basic Philosophy of Surface Water Runoff.
2.2.1 The Processing of Land Type Map and
Land Texture Definition
Each one area of land texture polygon contains some
different land components. These components are
noted on the table that named Comp.dbf. then for each
component has different land component in each
depth and it is noted in the table that named Layer.dbf.
The determination of land structure properties here is
based on the data of land texture that obtained by
using texture triangle as follows.
Analysis of Farmland Potency to Improve Community Economy in Letbaun Village Semau Sub-district Kupang District East Nusa Tenggara
Province
1159
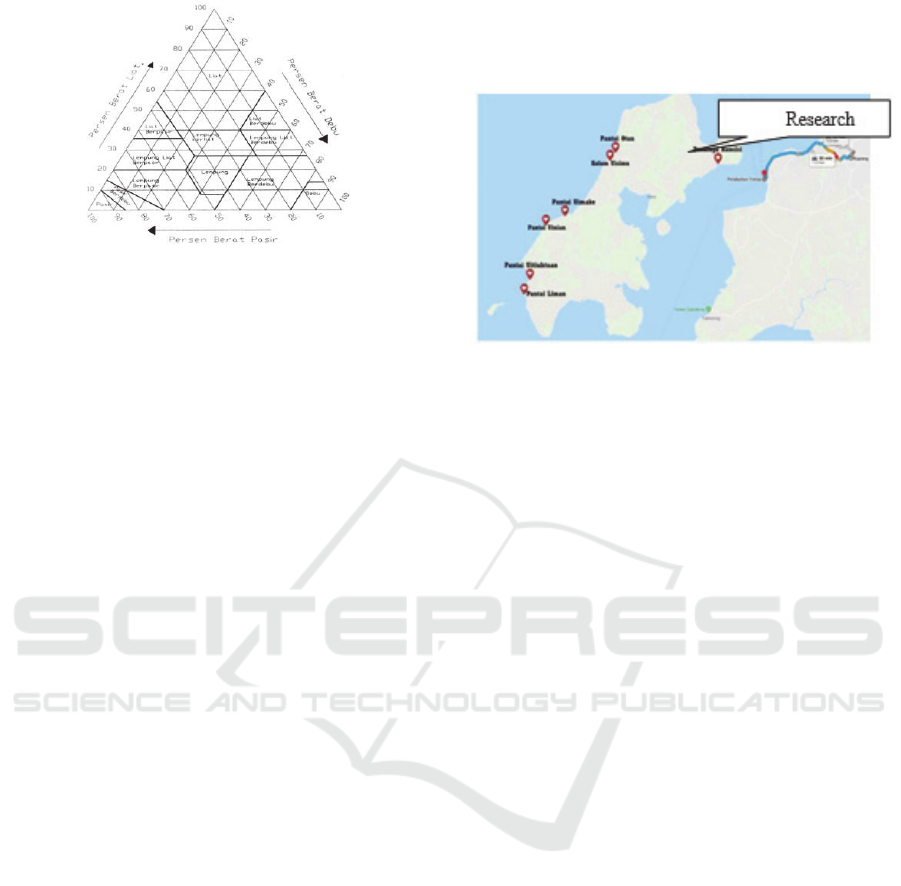
Figure 2: Triangle diagram of Land texture class
.
2.2.2 Research Result – Previous Research
Herawati, 2010. The research result showed that the
erosion danger level in Cisadane DAS covered very
light to very heft with the precentage of land area in a
row from very light to very heft55,85%;15,74%;
6,33%; 0,81%; and n 0,30%. The land with the very
heft erosion danger level covered the area of 316 ha
and the heft level covered the area of 851 ha.
Tamansari was the Sub-district that had land area
with the most serious erosion danger level,that was 87
ha. The others Sub-Districts which had serious
erosion danger level were Tenjolaya, Caringain,
Cijeruk, and Nanggung. This result research can be
used as the basic data to make the better planning of
DAS management.
Sulaiman et al, 2017. His research result showed
that Kupang city had high ground water potency, it
was proved from 49% of total area of Kupang City or
about 8070.74 ha had high ground water potency.
And only 561.85 Ha or about 3.42 % which had low
ground water potency. Most of spread of ground
water in Kupang city was influenced by the
topography condition in Kupang city. The wavy relief
made the spread of ground water in Kupang city was
randomly scattered from the flat topography area to
sloping area. Beside the topography condition, the
spread of ground water in Kupang city was also
influenced by the land usage in Kupang city, the kind
of land usage would influence in surface flow and
infiltration capacity that occured in some areas in
Kupang city which had high ground water potency.
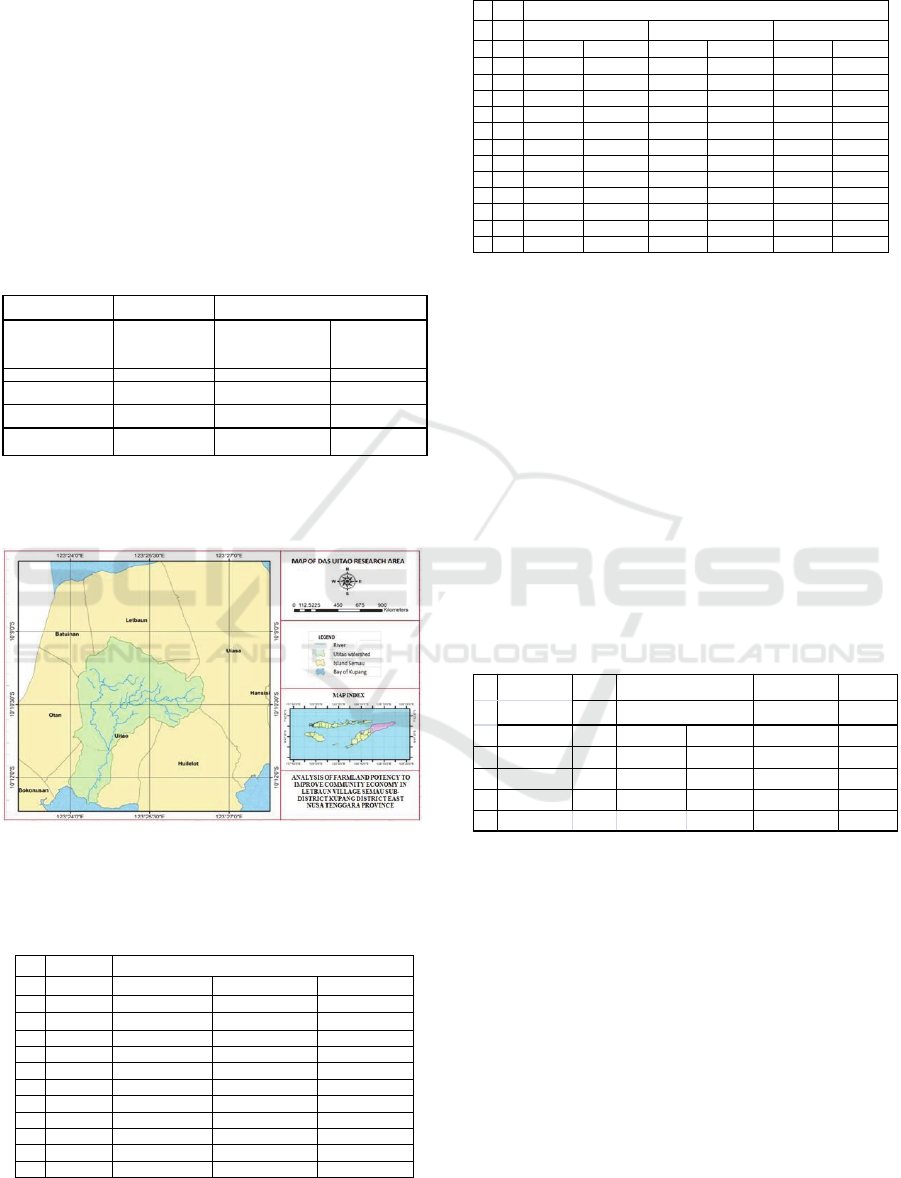
2.3 Research Method
2.3.1 Research Location
This research location was in Uitiuh Tuan Village
South Semau Sub-District Kupang District. To reach
the research location, it was traveled through cruise
ship by speed boat or ferry then continued by
motorcycle or car from Semau Port to Letbaun
Village Semau Sub-District for at least 30 minutes
with the distance of 60 Km.
Figure 3: Research Location.
2.3.2 The Necessary Data and Data Sources
1. The data of daily rainfall in 2011 until 2020 that
sourced from Meteorology and Geophysics
Agency Kupang. the data of rainfall from the
Station observation result that located around
DAS Semau
2. Watershed (DAS) map and river network in
Timor island that sourced from BP DAS Benain
Noelmina as the comparing tool in making DAS
border.
3. RBI map with the scale of 1: 50.000 used to
know the nature condition, elevation, and flow
direction.
4. Remote sensing image of Lansat7 ETM
Satellite+ and Lansat 8 (OLI) location in
recording years of 2004, 2009, and 2020 that
sourced from USGS (U.S. Geological Survey)
used to identify the condition of land usage in
DAS Noel Amabi.
5. Land usage map in 2020 Kupang District as the
comparing tool, land usage map that obtained
from processing Remote sensing image.
6. Land type map used to know the land type in
DAS Semau and to determine land erodibility
value.
7. Rain station map used to know the spread of rain
gauge station. Beside that to know the area of
rain station influence.
iCAST-ES 2021 - International Conference on Applied Science and Technology on Engineering Science
1160
3 RESULT AND DISCUSSION
3.1 Hidrology Analysis
The research location located in DAS Uitao, there are
three nearest rainfall stations that influenced to DAS
Uitao region. Those stations are the nearest station in
DAS Uitao region. Rainfall data used in that analysis
consisted of daily rainfall with the observation period
from 2011 until 2020.
The location of coordinate and elevation for each
raifall station in research area are as follows
Table 1: Rainfall Stations of Research Area.
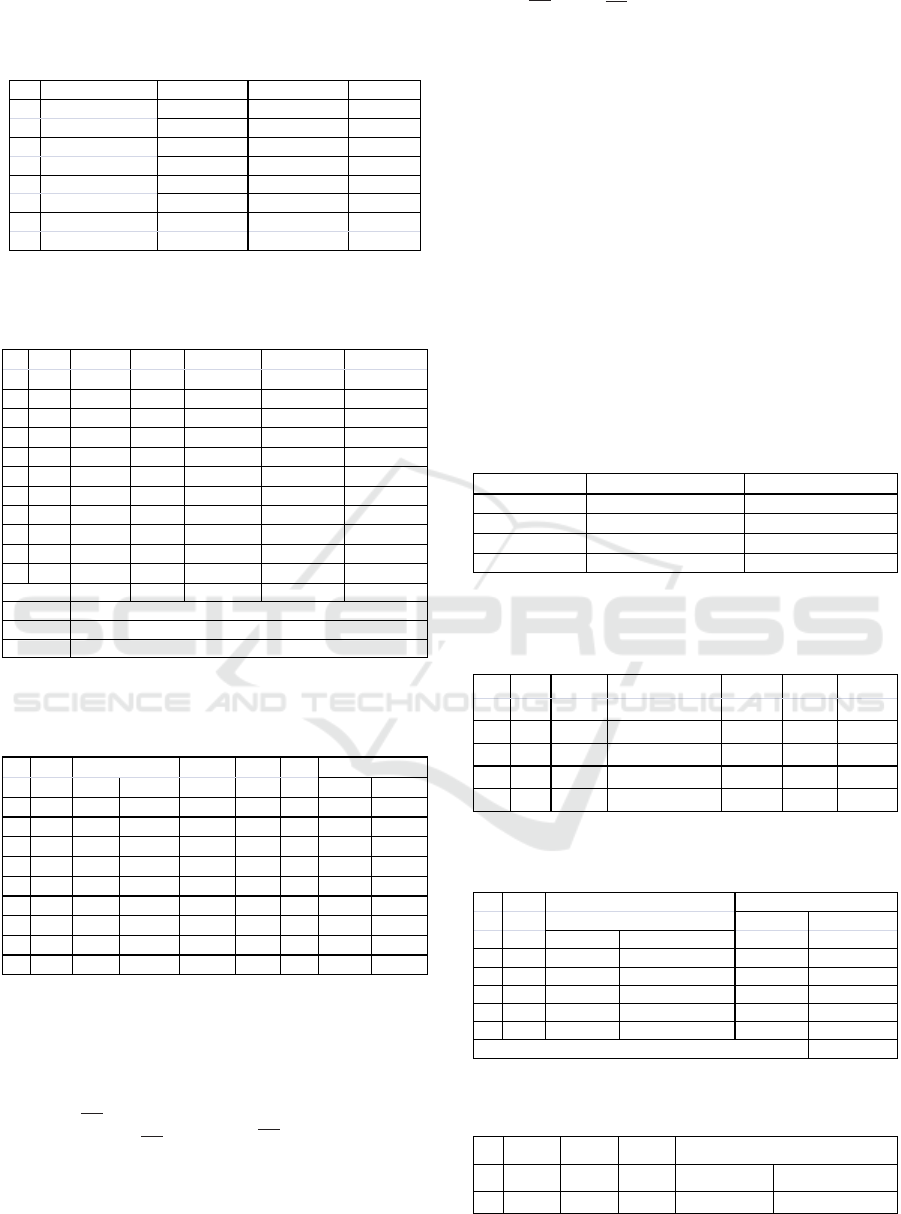
Whereas for spread map of rainfall station in DAS
Uitao research area can be seen in figure 4
Figure 4: Map of DAS Uitao Rainfall Station
Influence
Source: Analysis Result, 2021.
Table 2: Yearly maximum rainfall of study area
(2011-
2020).
Source: BMG Stasiun Klimatologi Lasiana Kupang,2021
Table 3: Total rainfall and rain day of study area
2011-
2020.
Total Rainfall and Monthly Rain Day
Batakte Station Tenau Station Manulai Station
No Yea
r
Total Rainfall Total Rain Day Total Rainfall Total Rain Day Total Rainfall Total Rain
D
(mm) ( day) (mm) (dayi) (mm) (day)
1 2 3 4 5 6 7 8
1 2011 1,383.00 76.00 1,412.30 91.00 1,276.30 84.
2 2012 1,715.30 69.00 1,346.00 71.00 1,009.80 68.
3 2013 1,317.20 70.00 1,483.30 69.00 1,350.50 82.
4 2014 1,065.50 67.00 387.50 42.00 1,331.50 74.
5 2015 1,999.00 92.00 4,241.00 62.00 1,222.00 58.
6 2016 914.00 60.00 1,950.30 79.00 2,055.00 55.
7 2017 2,015.00 71.00 2,445.00 67.00 1,047.50 35.
8 2018 1,635.50 82.00 1,951.00 99.00 1,277.60 56.
9 2019 1,737.00 60.00 2,288.00 112.00 1,006.50 50.
10 2020 1,555.00 89.00 1,662.00 81.00 1,179.00 79.
Source : BMG Stasiun Klimatologi Lasiana Kupang,
2021.
3.2 Regional Average Rainfall
The determination of regional average rainfall
uses
Polygon Thiessen method. The description of
Polygon Thiessen done by inserting each coordinate
into the table to obtain rain station spread map. Then
made the Polygon Thiessen by activating extension
spatial analyst with border of influence area is Rain
Station map of Uitao DAS by producing DAS Uitao
Polygon Theissen map (Figure.5). The Influence
area of Polygon Thiessen with Thiessen coefficient of
each Rain Station in research area of DAS Uitao is
presented in Table 4.
Table 4: The Area of Influence Spread to Rain Station in
DAS Uitao.
Elevation
Coordinate(Geography)
RainStation
Thiessen
No.
Rain
(m)
Tgeography
InfluenceArea
Coefficient
Name
(m)
EastLongitude
S
outhLatitude
(Ha)
(C)
1
TenauStation
418
1.233,912
‐101,631
526.057
0.381
2
ManulaiStation
20
1.234,476
‐101,855
41.053
0.298
3
BatakteStation
380
1,234,340
‐102,038
442.615
0.321
Total
1009.725
1.000
Source : Calculation Result, 2021
From the data of Yearly Maximum Rainfall of
Research Area (2010-2019) Table 6. Multiplied by
precentage of Thiessen coefficient. The calculation
result of Software ArcView GIS Software obtained
the value of Regional Average Maximum Rainfall,it
can be seen on the table below:
From the calculation result of Average Yearly
Maximum Rainfall of Research Area with the
influence of Thiessen Coefficient obtained the yearly
average rainfall and it has been sorted, it is presented
on the table below:
Name Elevatio
n
Coordinate( Geography)
Rain Station (m) East Longitude South
Latitude
Tenau 418 1.233,912 -101,631
Manulai 20 1.234,476 -101,855
Batakte Station 380 1,234,340 -102,038
Maximum Rainfall
No Year
Batakte Station Tenau Station
Manulai Station
(mm)
(mm)
(mm)
1
2011
180.00
161.00
53.50
2
2012
159.00
102.00
72.00
3
2013
94.00
108.00
125.00
4
2014
74.00
80.00
154.00
5
2015
289.00
310.00
63.00
6
2016
98.00
90.00
275.00
7
2017
145.00
190.00
204.00
8
2018
171.00
210.00
130.00
9
2019
195.00
201.00
75.00
10
2020
125.00
183.00
140.00
Analysis of Farmland Potency to Improve Community Economy in Letbaun Village Semau Sub-district Kupang District East Nusa Tenggara
Province
1161
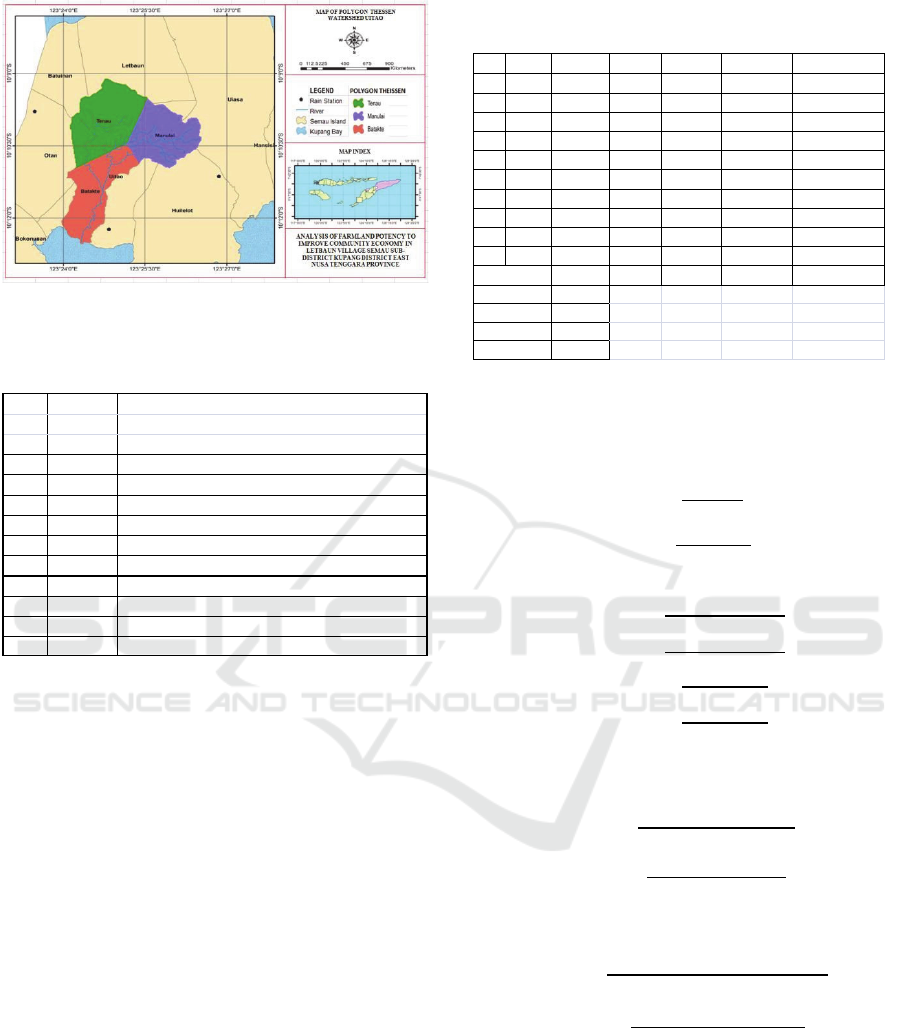
Figure 5: Polygon Theissen Map
Source: Analysis Result,
2021.
Table 5: Average Rainfall after sorted.
No
Year
Average Rainfall
1
2014
100.101
2
2013
108.567
3
2012
111.363
4
1011
135.099
5
2020
151.587
6
2019
161.570
7
2018
173.672
8
2016
147.634
9
2017
179.726
10
2015
229.740
Source : Calculation Result, 2021
3.3 Planning Rainfall Analysis
Planning rainfall is the biggest rainfall that is possible
to occur in an area with certain chance. The analysis
of planning rainfall is a procedure to predict the
frequency of raining in the past and in the future. With
the analysis of rainfall frequency, it can be known rain
distribution type that can represent the spread of daily
rain data so that it can be determined the planning rain
with various repeated period (Suripin, 2018).
3.4 Statistic Parameter
By calculating the statistic parameter such as average
value, deviation standard, variation coefficient, and
skewness coefficient from the available data and
followed by statistic test, then the suitable rain
probability distribution can be determined
Table 6: The Determination of Statistic Parameter of
Research Area.
No Year Xi ( mm) (Xi-X)
(Xi -?)
2
(Xi -?)
3
(Xi -?)
?
1 2014 100.10 -49.8 2,480.52 -123541.88 6,152,981.62
2 2013 108.57 -41.34 1,708.88 -70,642.66 2,920,267.91
3 2012 111.36 -38.54 1,485.56 -57,257.88 2,206,888.14
4 1011 135.10 -14.81 219.23 -3,245.96 48,060.75
5 2020 151.59 1.68 2.83 4.75 7.99
6 2019 161.57 11.66 136.05 1586.86 18,509.15
7 2018 173.67 23.77 564.81 13423.11 319,010.07
8 2016 147.63 -2.27 5.16 -11.73 26.65
9 2017 179.73 29.82 889.22 26516.53 790,719.26
10 2015 229.74 79.83 637.43 508814.02 40,620,621.80
Total 1,499.06 0.00 13,865.69 295.646,19 53.077.098,35
X 149,906
iation Standard 39,251
Cs 0,679
Ck 4,437
Source : Calculation Result, 2021
The calculation step on Table 11 to determine the type
of that probability distribution is as follows:
1. Determine Average Value
𝑋
∑
𝑋𝑖
𝑛
𝑥
1.499,06
10
X = 149,906
2. Determine Deviation Standard Value (Sd)
𝑆𝑑
∑
𝑋𝑖 𝑋
𝑛1
𝑆𝑑
13.865,69
10 1
Sd = 39,251
3. Determine Skewness Coefficient Value (Cs)
𝐶𝑠
𝑛 𝑥
∑
𝑋𝑖 𝑋³
𝑛1
𝑛2
𝑆𝑑³
𝐶𝑠
10 𝑥 295.646,19
9 𝑥 8 𝑥 39,251
𝐶𝑠0,679
4. Determine Kurtosis Coefficient Value (Ck)
𝐶𝑘
𝑛²
∑
𝑋𝑖 𝑋⁴
𝑛1
𝑛2
𝑛 3𝑆𝑑⁴
𝐶𝑘
10
𝑥 53.077.093,35
9 𝑥 8 𝑥 7 𝑥 32,036
𝐶𝑘4,437
3.5 Distribution Type Election
In Statistic knowledge, it is known some types of
frequency distribution and four types of distribution
that widely used in hidrology field that are Normal
Distribution, Log-Normal distribution, Gumbel
Distribution and Log-Person Type III Distribution
iCAST-ES 2021 - International Conference on Applied Science and Technology on Engineering Science
1162
(Suripin, 2018).
Table 7: Distribution Type Election of Research Area.
No
Distribution Type
Requirement
Calculatio n Res ult
Description
Cs = 0
Cs = 0,679
1
Normal
Ck = 0
Ck = 4,437
Ineligible
Cs = 1,14
Cs = 0,679
2
Gumbel
Ck = 5,4
Ck = 4,437
Ineligible
Cs = 0,688
Cs = 0,679
3
Log Normal
Ck = 3,14
Ck = 4,437
Ineligible
4
Log Pearson Type III
Besides the value
Cs = 0,679
Eligible
Source : Analysis Result, 2021
Table 8: The calculation of Deviation Standard and
Skewness Coefficient (Cs) of Research Area.
No
Year
Rainfall
Log Xi
Log Xi - Log X
(Log Xi - Log X)
2
(Log Xi - Log X)
3
Xi ( mm)
1
2014
100.101
2.000
-0.162
0.026
-0.004
2
2013
108.567
2.036
-0.217
0.016
-0.002
3
2012
111.363
2.047
-0.136
0.013
-0.002
4
1011
135.099
2.131
-0.032
0.001
0.000
5
2020
151.587
2.181
0.018
0.000
0.000
6
2019
161.570
2.208
0.046
0.002
0.000
7
2018
173.672
2.240
0.077
0.006
0.000
8
2016
147.634
2.169
0.006
0.000
0.000
9
2017
179.726
2.255
0.092
0.008
-0.001
10
2015
229.740
2.361
0.199
0.099
-0.008
Total
1,499.059
21.628
0.000
0.113
0.001
Log X
2,163
S Log X
0.112
Cs
0.100
Source : Analysis Result, 2021
Table 9: The Calculation of Planning Rain with various
repetition.
No Tr
DeviationStand
Skewness Chance
PlanningRainfall
(Year) LogX (S.LogX) (Cs) (%) K LogX X( mm)
1 2 3 4 5 6 7 8
9
1 1.01 2.163 0.112 0.1 99 ‐2.252 1.91
81.319
2 2 2.163 0.112 0.1 50 ‐0.03 2.159 144.334
3 5 2.163 0.112 0.1 20 0.84 2.257
180.688
4 10 2.163 0.112 0.1 10 1.29 2.307 202.951
5 25 2.163 0.112 0.1 4 1.79 2.363 230.92
0
6 50 2.163 0.112 0.1 2 2.11 2.399 250.811
7 100 2.163 0.112 0.1 1 2.4 2.432
270.314
8 1000 2.163 0.112 0.1 0.1 3.24 2.526
335.788
Source : Analysis Result, 2021
Information
[1) = Number
[2] = Repeat
[3] = (S.Log Xi)/n
[4] = ((S.Log Xi)/n))//(n-1)
0,5
[5] = (n.S.(Log Xi-LogX)
3
/(n-1(n-2)(LogX))
3
[6] = ( 1/Tr)*100
[7] = Table of Pearson III. log distribution properties
factor table Based on Cs Value and Opportunity or
Repeat Time
[8] = LogX + K.S.Log X
[9] = Antilogue of X
3.6 Distribution Suitability Test
Distribution suitability test means to know whether
the selected distribution can be used or not, for the
available data series. In this study, to the requirement
of distribution suitability test analysis used two
statistic methods, that are Chi Square test and
Smirnov Kolmogorov test.
3.7 Chi Square Test
Chi Square test means to determine whether the
selected chance distribution equation can represent
analyzed sample data statistic distribution. The
decision of this test uses parameter.
Table 10: Interpolation of G Value.
No.
Pr (%)
G
1
80
-0,830
2
75
-0,697
3
50
-0,032
4
25
0,695
Source : Calculation Result, 2021.
Table 11: Recapitulation of Rainfall for each Research
Area.
No Pr
Lo g X
Deviation Standard
Skewnes s
G Rainfall
(%)
(Log X)
(Cs) Tabel
( mm)
1 25 2.153 0.112 0.100 0.695 170.15
2 50 2.153 0.112 0.100 -0.032 141.58
3 75 2.153 0.112 0.100 -0.697 118.84
4 80 2.153 0.112 0.100 -0.830 114.83
Source : Calculation Result, 2021
Table 12: Calculation of Chi-Square Test.
Source : Calculation Result, 2021
Table13: Calculation of Chi-Square Test.
Source : Calculation Result, 2021
No A
X
2
Teble
X
2
Count
1 1% 13.277 3
X
2
Count
< X
2
Teble
Distribution is acceptable
2 5% 14.860 3
X
2
Count
< X
2
Teble
Distribution is acceptable
Information
Frequency
No
Class
Class
Theoretical
Observation
(%)
( mm )
(Ea)
(Oi)
1
I
0 - 25
0 - 118,62
2
3
2
II
25 - 50
118,62 - 122,13
2
0
3
III
50 - 75
122,13 - 141,58
2
2
4
IV
75 - 80
141,58 - 165,59
2
3
5
V
80 ~
165,59 ~
2
2
Total
10
Analysis of Farmland Potency to Improve Community Economy in Letbaun Village Semau Sub-district Kupang District East Nusa Tenggara
Province
1163
The calculation of K value is presented in the
Table completely as follows:
Table 14: Interpolation of Pr Value.
Pr (%)
No
K
Pr
(Pr/100)
1
-1,606
94,462
0,945
2
-1,235
88,955
0.890
3
-1,119
80.000
0,800
4
-0.235
57,696
0,577
5
-0.291
37,955
0,380
6
0,583
28,871
0,289
7
0,913
17,485
0,175
8
0,170
43,091
0,431
9
1,070
14,898
0,149
10
2,192
-0.823
-0.008
Source : Calculation Result, 2021
Table 15: Calculation of Smirnov Kolmogorof Test.
No
Year
Planning Rainfall
Log Xi
Pe
K
Pr
Pt
(Pt-Pe)
1
2
3
4
5
6
7
8
9
1
2014
100.101
2.000
0,091
-1,606
0,945
0,055
-0.036
2
2013
108.567
2.036
0,182
-1,235
0.89
0,110
-0.071
3
2012
111.363
2.047
0,273
-1,119
0,800
0,200
-0.073
4
1011
135.099
2.131
0,364
-0.235
0,577
0,423
0.059
5
2020
151.587
2.181
0,455
-0.291
0,380
0,620
0.166
6
2019
161.570
2.208
0,545
0,583
0,289
0,711
0.166
7
2018
173.672
2.240
0,636
0,913
0,175
0,825
0.189
8
2016
147.634
2.169
0,727
0,170
0,431
0,569
0.158
9
2017
179.726
2.255
0,818
1,070
0,149
0,851
0.033
10
2015
229.740
2.361
0,909
2,192
-0.008
1,008
0.099
Jumlah
21.627
Log X
2.153
S Log X
0.095
D Max
0.1989
Cs
0.1
Source : Calculation Result, 2021
Table 16: The Decision of Smirnov Kolmogorof Test.
C
Δcritical
ΔMax
Description
0,2
0,32
0,189
Accepted
0,1
0,37
0,189
Accepted
0,05
0,41
0,189
Accepted
0,01
0,49
0,189
Accepted
Source : Calculation Result, 2021
3.8 The Drawing of DAS Uitao Map
The drawing of DAS Uitao border map by using the
assistance of ArcView GIS software and ArcSWAT
extension.This drawing generates DEM (Digital
Elevation Model) which is taken from topography
map that has the shape of contour line that modified
into cell shape (grid). The use of digital surface model
in surface runoff analysis process which presents the
earth relief surface will give accuracy in identifying
the land slope, flow accumulation, flow line lenght
and flow area detemination.
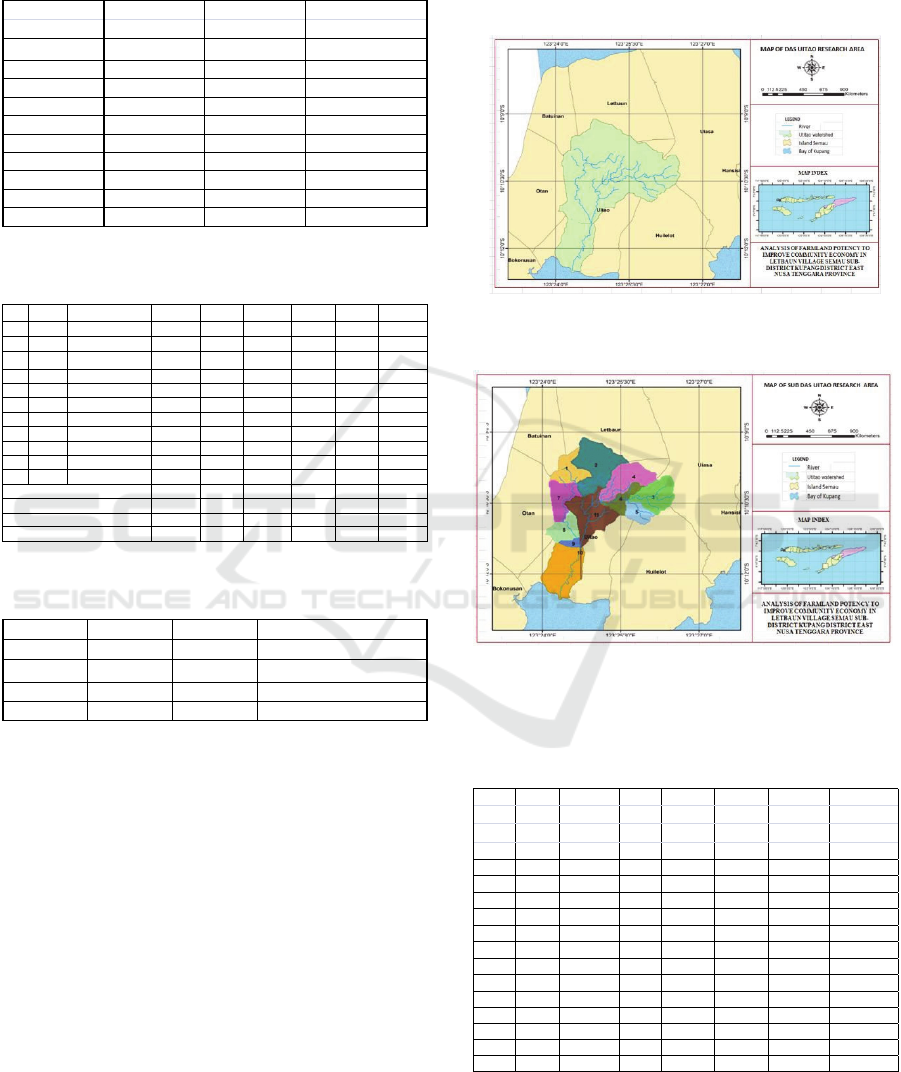
The drawing of water catchment area is done after
generating DEM is over, in this case is DAS Uitao
drawing. This drawing aimed to find Sub DAS from
DAS Uitao and its attribute and generating synthetic
river network. The computer will translate the basins
or mound by using DEM. The result of DAS Uitao
drawing can be seen in Figure 6 and Sub DAS can be
seen in figure 7 whereas its attribute data is presented
on table 17.
Source: Analysis Result, 2021
Figure 6: Research Area Watershed Map.
Figure 7: Map of DAS Uitao Research Area Source:
Analysis Result, 2021.
Table 17: DATA of Sub-DAS Attribute, the Result of
Making DAS Border by using DEM.
Strem Reach
Subbasin
Stream Reach
Stream Reach
Stream Reach
Elevation
Area
Slope Lenght
Slope
Slope
Width
Depth
Subbasin Controid
Subbasin Subbasin
( LEN1)
(SL01)
(SLL)
(WID1)
(DEP1)
(ELEV)
( ha )
( m)
(%)
(%)
(m)
(m)
(m)
1
2
3
4
5
6
7
8
1
98.125
1.967,635
3.466
91,436
1.2754
0.1290
51.9484
2
234.438
3.132,412
3.209
91,436
2.1508
0.1828
64.0555
3
138.688
2.646,168
20.434
15,239
1.5697
0.1482
116.3659
4
157.000
3.117,767
8.183
60,957
1.6909
0.1557
91.9773
5
61.750
1.484,772
25.522
15,239
0.9660
0.1072
115.6407
6
63.500
2.098,681
17.675
18,287
0.9823
0.1084
85.5157
7
104.438
3.277,082
2.058
91,436
1.3240
0.1323
3.7135
8
83.000
1.489,949
1.317
121,914
1.1536
0.1207
29.6032
9
19.375
851,777
3.307
91,436
0.4819
0.0674
24.1000
10
215.571
400,000
1.494
121,914
0.0844
0.0211
12.0000
11
203.750
4.297,056
4.728
91,436
1.9772
0.1728
37.8644
Total 1379.634
Source : Analysis Result, 2021
Runoff Debit Analysis of Rational Method The
iCAST-ES 2021 - International Conference on Applied Science and Technology on Engineering Science
1164
Determination of Runoff Coefficient (C) The big
coeffricient value of runoff/flow (C) shows the
quantity of surface runoff that occurs in the land is
big, in other words the water management condition
and land usage in that land is damaged.
Table 18: Runoff Coefficient in Existing Land Usage in
DAS Uitao.
Sub Sub
Land
Area
Runoff
Average
DAS
Usage
(ha)
Coefficient C )
Runoff Coefficient
Meadow
10.8929
0.200
1
Bush es
84.9673
0.010
0.034
Rainfed Rice field
1.4434
0.150
Farm
0.8213
0.020
Bush es
190.9824
0.010
Meadow
17.3568
0.200
2
Plantation/farm
8.8219
0.020
0.026
Field
15.6944
0.020
Rainfed Rice field
1.5819
0.150
Bush es
5.3534
0.010
3
Jungle
132.2407
0.030
0.031
Meadow
1.0934
0.200
Bush es
132.2926
0.010
4
Plantation
5.2532
0.020
Meadow
3.0872
0.200
0.021
Jungle
15.2375
0.030
Settlement
1.1295
0.700
5
Bush es
35.4504
0.010
0.019
Jungle
26.2996
0.030
6
Bush es
32.3945
0.010
0.020
Jungle
31.1055
0.030
Meadow
20.1485
0.200
7
Bush es
56.5264
0.010
0.095
Rainfed Rice field
25.7082
0.150
Settlement
2.0545
0.700
8
Meadow
17.615
0.200
0.050
Bush es
65.385
0.010
Bush es
182.3029
0.010
9
Settlement
1.0399
0.700
0.014
Meadow
0.1049
0.200
Bush es
181.5992
0.010
Settlement
9.7486
0.700
10
Meadow
16.0342
0.200
0.058
Field
3.4027
0.020
Rainfed rice field
2.7872
0.150
Bush es
136.1688
0.010
Meadow
50.8111
0.200
11
Settlement
6.1475
0.700
0.079
Rainfed Rice field
0.0544
0.150
Plantation
7.768
0.020
Lake
2.5736
0.000
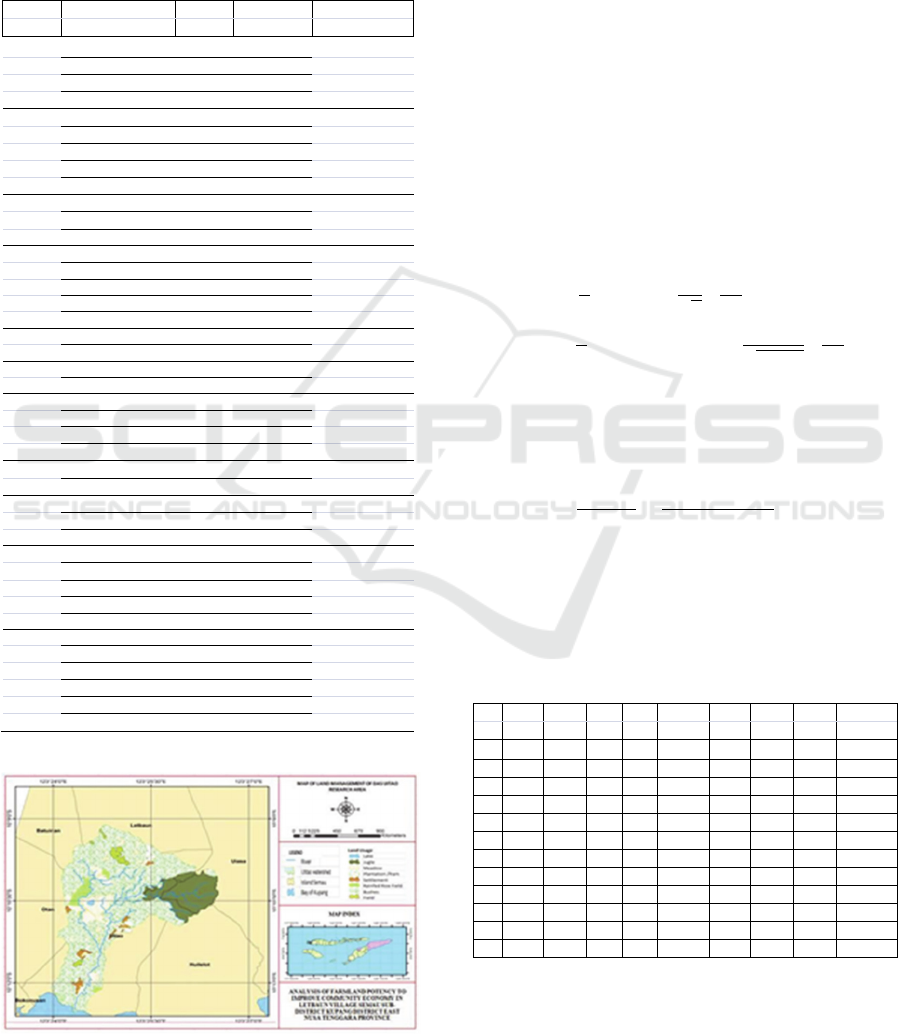
Source : Analysis Result, 2021
Source : Analysis Result, 2021
Figure 8: Map of Land Management of DAS Uitao
Research Area.
3.9 Determination Concentration Time
(Tc) and Rain Intensity (I)
Below is the calculation example of Concentration
time (Tc) and Rain Intensity (I) in Sub-DAS 1
The data :
Land slope (Sloland) = 3,466 Slope lenght (L) =
1.967,61 m, River slope (Sloriver) = 0,100
River lenght (S) = 268,57 m. manning special number
(n) = 0,025
R
24
repetition 2 years = 144,34 mm
R
24
repetition 5 years = 180,688 mm
R
24
repetition 10 years = 202,951 mm
R
24
repetition 25 years = 230,920 mm
R
24
repetition 50 years = 250,811 mm
The Calculation Analysis is as folows:
1. Calculating To (Overland flow time)
𝑇𝑜
2
3
𝑥3,28𝑥𝐿𝑥
𝑛
√
𝑆
𝑥
1
60
𝑇𝑜
2
3
𝑥3,28𝑥1.967,61 𝑥
0,025
√
0,100
𝑥
1
60
To = 0,963 hours
2. Calculating v (flow speed)
v = 4,918(S)
1/2
v = 4,918 (0,100)
1/2
= 1,555 m/dt
3. Calculating Td (Drain flow time)
𝑇𝑑
1
3.600𝑣
1
3.600𝑥1,555
Td = 0,351 jam
4. Calculating Tc ( Concentration time)
Tc = To + Td
Tc = 0,963 + 0,351
Tc = 1,314 hours
Table 19: Concentration Time Calculation (Tc).
SubSub LandSlope
RiverSlope
Slope
River
SpecialNumber
Overland
Flow
DrainFlow
Concentration
DAS
(Slo.Land)
(Slo.River)
Lenght(L)
Lenght(S)
Manning(n)
FlowTime
Speed(V)
Time(Td)
Time(Tc)
1
2
3
4
5
6
7
8
9
10
1
3,466
0,100
1.967,61 268,57 0,025
0,963
1,555
0,351
1,314
2
3,209
0,688
3.967,61 1.817,09 0,025
1,593
4,079
0,213
1,806
3
20,434
1,916
2.646,17 130,50 0,025
0,533
6,807
0,108
0,806
4
8,183
2,776
3.117,77 1.682,63 0,025
0,933
8,195
0,106
1,099
5
25,522
0,100
1.484,77 138,39 0,025
0,268
1,555
0,265
0,533
6
17,625
2,053
2.098,68 121,75 0,025
0,455
7,047
0,083
0,538
7
2,058
0,514
3.277,08 1.996,02 0,025
2,081
3,524
0,258
2,340
8
1,317
0,245
1.489,95 919,97 0,025
1,183
2,432
0,170
1,353
9
3,307
2,929
851,78 426,78 0,025
0,427
8,417
0,028
0,455
10
1,494
0,100
400,00 425,00 0,025
0,298
1,555
0,072
0,370
11
4,728
0,646
4.297,06 387,03 0,025
1,801
3,953
0,302
2,103
Source : Calculation result, 2021
Rain intensity calculation of Mononobe method
Analysis of Farmland Potency to Improve Community Economy in Letbaun Village Semau Sub-district Kupang District East Nusa Tenggara
Province
1165
a). I =
3/2
24
24
24
Tc
R
, with R
24
for repetition
2 th = 144,34 mm
I =
,
,
/
= 40,902 mm/hour
b). I =
3/2
24
24
24
Tc
R
,with R
24
for repetition
5 th = 180,688 mm
I =
,
,
/
= 49,472 mm/hour
c) I =
3/2
24
24
24
Tc
R
, with R
24
for repetition
10 th = 202,951 mm
I =
,
,
/
= 54,587 mm/hour
d) I =
3/2
24
24
24
Tc
R
, with R
24
for repetition
25 th = 230,920 mm
I =
,
,
/
= 60,893 mm/ hour
e). I =
3/2
24
24
24
Tc
R
, with R
24
for repetition
50 th = 250,811 mm
I =
,
,
/
= 65,307 mm/hour
The quantity of Rain intensity (I) added to
attribute data of Sub- DAS Uitao map. Then the
calculation result can be seen on Table 20 as follows:
Table 20: Rainfall Intensity Calculation (I).
Sub -
Concentration
R24
R24
R24
R24
R24
Rainfall Intensity
Sub
Time (Tc)
(2 Years)
(5 Years)
(10 Years)
(25 Years) (50 Years)
(2 Years)
(5 Years)
(10 Years (25 Years) (50 Years)
DAS
( Hour)
(mm)
(mm)
(mm)
(mm)
(mm)
(mm/jam)
(mm/jam)
(mm/jam) (mm/jam) (mm/jam)
1
2
3
4
5
6
7
8
9
10
11
12
1
0,351
141.427
171.06
188.747
210.553
225.813
40.902
49.472
54.587 60.893 65.307
2
0,213
141.427
171.06
188.747
210.553
225.813
33.085
40.017
44.155 49.256 52.826
3
0,108
141.427
171.06
188.747
210.553
225.813
66.008
79.838
88.003 98.271 105.393
4
0,106
141.427
171.06
188.747
210.553
225.813
46.095
55.754
61.518 68.625 73.599
5
0,265
141.427
171.06
188.747
210.553
225.813
74.681
90.329
99.668 111.183 119.241
6
0,083
141.427
171.06
188.747
210.553
225.813
74.198
89.744
99.023 110.463 118.46
7
0,258
141.427
171.06
188.747
210.553
225.813
27.198
33.674
37.156 41.449 44.453
8
0,170
141.427
171.06
188.747
210.553
225.813
40.116
48.521
53.538 59.723 64.052
9
0,028
141.427
171.06
188.747
210.553
225.813
83.008
100.401
110.782 123.58 132.537
10
0,072
141.427
171.06
188.747
210.553
225.813
95.332
115.306
127.229 141.928 152.214
11
0,302
141.427
171.06
188.747
210.553
225.813
29.898
36.163
39.902 44.512 47.738
Source : Calculation result, 2021
3.10 The Determination of Runoff Debit
and the Drawing of Runoff Debit
Spread Map
The formula used based on the equation of runoff
debit of Rational Method is as follows:
Q = 0,278.C.I.A
Its calculation example is as follows:
In Sub DAS 1 with the data:
1. Land area for Sub DAS 1= 98,125 Ha
2. Runoff Coefficient (C) = 0,034
3. Rainfall Intensity (I) :
2 years = 40,902 mm/hour
5 years = 49,472 mm/hour
10 years = 54,587 mm/hour
25 years = 60,893 mm/hour
50 years = 65,307 mm/hour
The calculation of surface runoff debit (Q
2,
Q
5,
Q
10,
Q
25,
Q
50
) in Sub DAS 1 location is as follows:
Q = 0,278.C.I.A
Q
2
= 0,278 x 0,034 x 40,902 x 98,125
= 37,395 m
3
/second
Q
5
=
0,278 x 0,034 x 49,472 x 98,125
=
45,230 m
3
/second
Q
10
=
0,278 x 0,034 x 54,587 x 98,125
=
49,907 m
3
/second
Q
25
=
0,278 x 0,034 x 60,893 x 98,125
=
55,673 m
3
/second
Q
50
=
0,278 x 0,034 x 65,307 x 98,125
=
59,708 m
3
/second
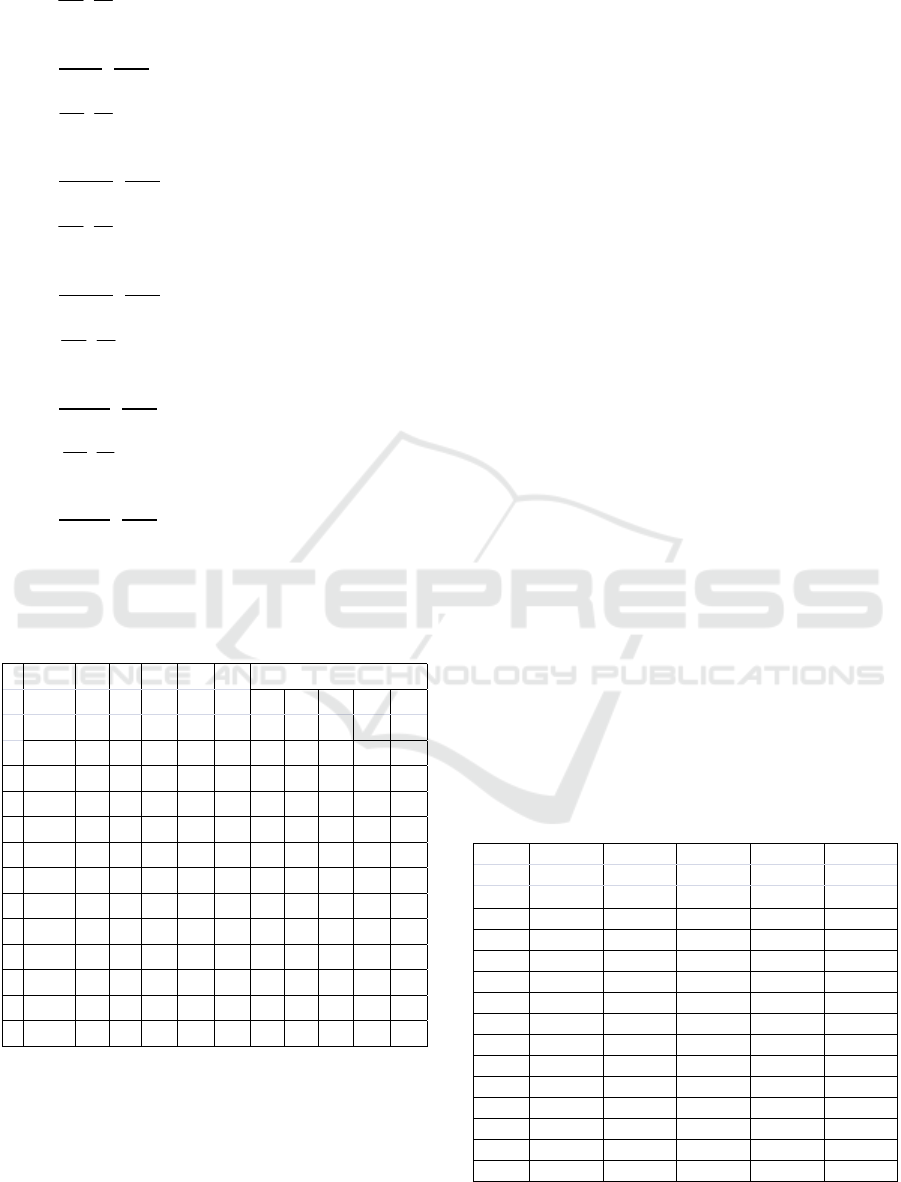
Its calculation recapitulation result can be seen on
Table 21 and Runoff Debit Graphic (Q) of DAS Uitao
is presented in Figure 9. And its drawing result for
Runoff Debit with 10 years repetition can be seen in
the figure below:
Table 21: Calculation of Runoff Debit of DAS Uitao.
Sub Sub
Q
Q
Q
Q
Q
DAS
(2 Years)
(5 Years)
(10 Years)
(25 Years)
(50 Years)
(m
3
/second) (m
3
/second) (m
3
/Second)
(m
3
/Second)
(m
3
/second)
1
2
3
4
5
6
1
37.395 45.230 49.907
55.673
59.708
2
56.186 67.959 74.985
83.649
89.711
3
77.795 94.095 103.824
115.819
124.213
4
42.201 51.043 56.321
62.827
67.381
5
24.358 29.462 32.508
36.364
38.892
6
26.196 31.685 34.961
39.000
41.827
7
76.791 92.880 102.484
114.324
122.610
8
46.282 55.979 61.767
68.903
73.897
9
6.259 7.571 8.354
9.319
9.994
10
331.361 400.790 442.23
493.321
529.075
11
133,787 161.819 178.551
199.179
213.614
Total 858.610
1.038.513 1.145.892
1.278.277
1.370.921
Source : Calculation result, 2021
iCAST-ES 2021 - International Conference on Applied Science and Technology on Engineering Science
1166
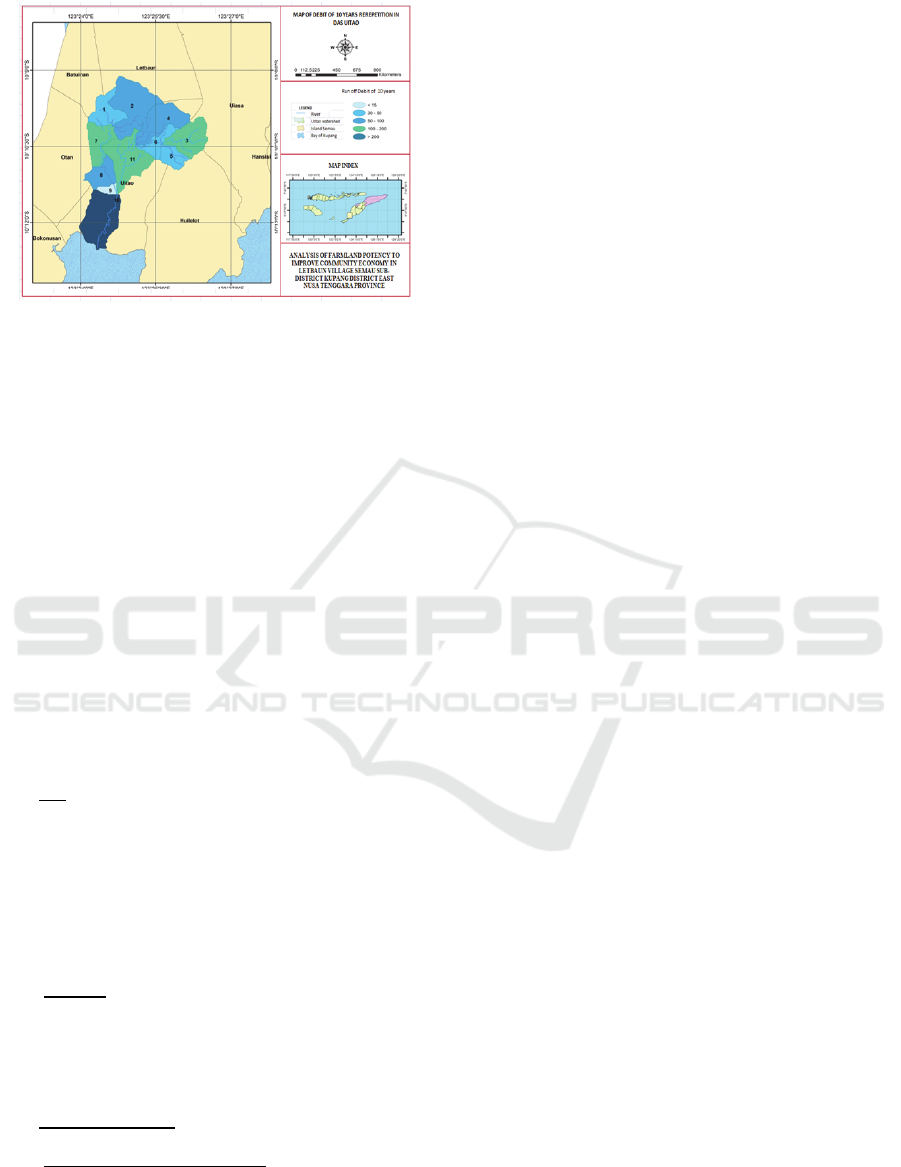
Figure 9: Map of Runoff Debit of 10 years repetition in
DAS Uitao.
3.11 The Factors of Slope Lenght (L)
and Slope Slant (S) and the
Drawing of Slope Slant Map of
DAS Uitao
The factors of Slope Lenght (L) and Slope slant (S)
influence the quantity of erosion that occurred. The
slant influences the speed and volume of surface
runoff. Basically if the slope is getting steeper, so the
precentage of slope slant is bigger, therefore the
surface runoff rate is getting faster. The average of
slope lenght quantity in DAS Uitao can be seen
through the measurement on digital contour map with
the assistance of ArcView software and measure
facilities. The slope slant can be known from Sub
DAS map attribute data that has been made by DEM
method.
L =
,
With :
L = value of Slope Lenght factor
Lo = Slope lenght (obtained from result attribute of
making DAS border /subbasin through software).
Data on Sub DAS 1 :
Lo = 1.967,615 m from Analysis measurement
then ;
L =
.,
,
,
= 9,436%
The slant influences speed and volume of surface
runoff.
= 9,436%
Slope slant factor (S) can be calculated
𝑆
,,,
,
𝑆
, , ,, ,
,
= 0,295
3.12 The Potency of Land Usage as the
Farmland in Letbaun Village
In Letbaun Village Semau Sub-District, there is DAS
Uitao that influenced the Letbaun village itself and it
has productive land to be processed as farmland.
The usage of ideal farmland is in the lowland area
with the slope slant < 10%, the steep land is not ideal
to use as farmland. Based on calculation from each
Sub DAS Uitao with each slope slant, there are some
some Sub DAS with the slope slant < 10% which is
ideal for farmland, the area is= 900,126 Ha from total
area of DAS = 1379,634 Ha. The land potency for
farmland in accodance with Sub DAS is below :
Sub DAS 1 Slope Slant 2,831 %
Extensive Area = 98,125 Ha
Sub DAS 2 Slope Slant 3,301 %
Extensive Area = 234.438 Ha
Sub DAS 4 Slope Slant 8,183 %
Extensive Area = 157,000 Ha
Sub DAS 7 Slope Slant 2,058 %
Extensive Area = 104.438 Ha
Sub DAS 8 Slope Slant 1,317 %
Extensive Area = 83.000 Ha
Sub DAS 9 Slope Slant 3,307 %
Extensive Area = 19.375 Ha
Sub DAS 11 Slope Slant 4,728 %
Extensive Area = 203.750 Ha
3.13 Reservoir Location for Agricultural
Water Supply
To support the problem of limited water supply , it is
required the usage of water resourse in that location
to control the excess water in the rainy season and it
becomes the source of irrigation water in dry season.
In Sub- DAS 10 based on the calculation result of
fairly big surface runoff debit and Land slope > dari
10 % is planned to build Reservoir ( Retention basin)
to fulfill the water need supply in the land of 900,126
Ha. The covered land (catchment area) is 215,571 Ha.
The location of the Reservoir (Retention Basin)
building is at coordinates 123°24'23.41” East
Longitude and 10°11'44.23” South Latitude with a
water capacity of 442,230 m3/second every 10 years,
493,321 m3/second a Chatment Area of 215,571 Ha.
The map image is presented in Figure 10.
Analysis of Farmland Potency to Improve Community Economy in Letbaun Village Semau Sub-district Kupang District East Nusa Tenggara
Province
1167
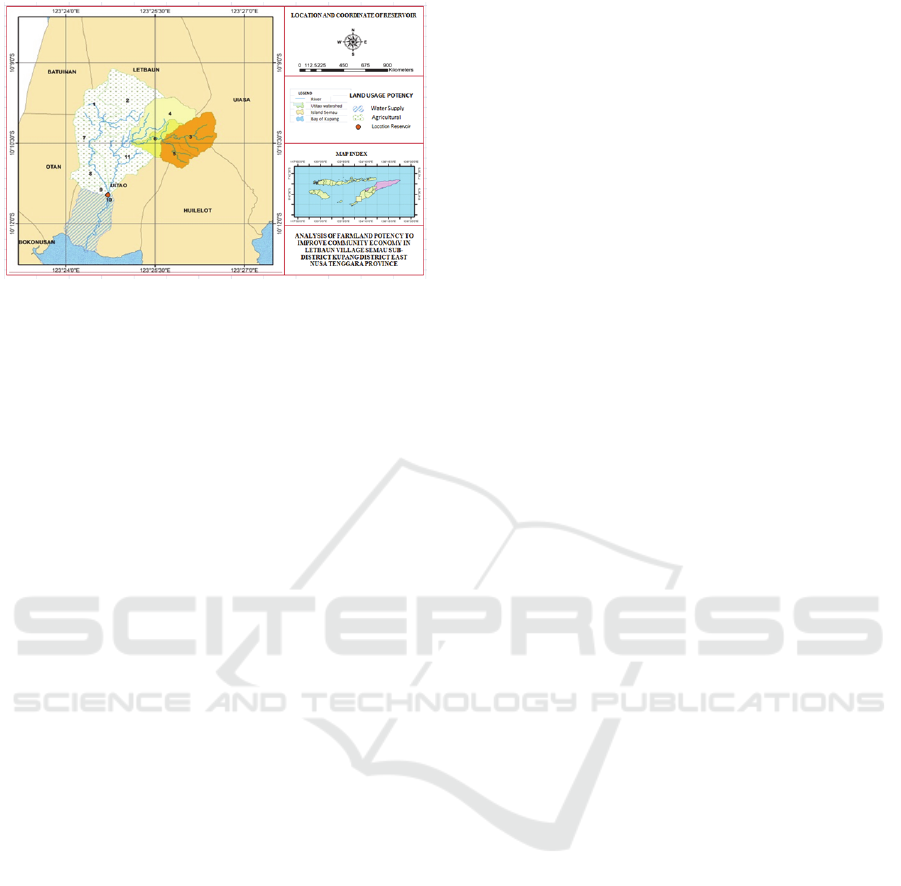
Figure 10: The Map of Land Usage Potency and Location
and Coordinate of Reservoir.
4 CONCLUSIONS
The farmland potency in Letbaun Village Semau Sub-
District Kupang District of area = 900,126 Ha from
the total area of =1.379,634 Ha, it means 65,24 %
from total region. And to fulfill the need of water in
reservoir building(retention basin) in Sub DAS 10 in
coordinate of 123°24’23.41” East Longitude and
10°11’44.23” South Latitude with the covered area
(catchment area) of 215,571 Ha. In the DAS which
has land slope > of 10 % is made the construction of
water path that made parallel to the contour line with
the distance of 10 - 20 m and the width size of 0,50,
the depth of 0,50m to minimize surface runoff debit.
REFERENCES
Aronoff. 1989. Geographic Information System – A
Management Perspective. Ottawa: WDL Publications.
Asdak, Chay. 2004. Hidrologi Dan Pengelolaan Daerah
Aliran Sungai. Yogyakarta: Gajah Mada University
Press.
ESRI (Environmental System Research Institute, Inc).
1996. ArcView GIS, The Geographic Information
System for Everyone. New York: ESRI. Dampit,
Kabupaten Malang”. Skripsi tidak diterbitkan. Malang:
Jurusan Pengairan FT Unibraw, 2003.
Marwan, Achmad. 2003. “Implementasi Sistem Informasi
Geografis Dalam Penentuan Batas Genangan
Bendungan Genteng Kecamatan Dampit, Kabupaten
Malang”. Skripsi tidak diterbitkan. Malang: Jurusan
Pengairan FT Unibraw, 2003.
Prahasta, Eddy. 2001. Konsep-Konsep Dasar Sistem
Informasi Geografis. Bandung: CV Informatika.
Prahasta, Eddy. 2005. Sistem Informasi Geografis.
Bandung: CV Informatika.
Soemarto, CD. 1999. Hidrologi Teknik Edisi Kedua.
Jakarta: Erlangga.
Sulaiman dkk, 2017 Pemetaan Potensi Air Tanah
Menggunakan Penginderaan Jauh dan Sistem Informasi
Geografis. Prosiding Seminar Nasional seri 7“Menuju
Masyarakat Madani dan Lestari” Yogyakarta, 22
November 2017, e-ISBN: 978-602-450-211-9, p-ISBN:
978-602-450-210-2.
Ervina Rouska, dkk, 2017 Tingkat Bahaya Erosi dan Faktor
Kemanan Lereng Pada Jalan Banda Aceh – Calang,
Journal Teknik Sipil Usyiah Kuala, Vol Vol 6 N. 2
(2017) .
Utomo, Wani Hadi. 1994. Erosi Dan Konservasi Tanah.
Malang: IKIP Malang.
Tuti Herawati, 2010. Analisis Spasial Tingkat Bahaya Erosi
Di Wilayah DAS Cisadana Kabupaten Bogor. Journal
Penelitian Hutan dan Konservasi Alam Volume 2.
Juditha, C. (2016). Peace Journalism in News Tolikara
Religion Conflict in Tempo. co-Jurnalisme Damai
Dalam Berita Konflik Agama Tolikara Di Tempo. co.
Jurnal Penelitian Komunikasi dan Opini Publik, 20(2).
Hardjowigeno, S. (1995). Kesesuaian Lahan untuk
Pengembangan Pertanian, Daerah Rekreasi dan
Bangunan. Lembaga Pengabdian Kepada Masyarakat.
IPB. Bogor, 200.
Agwa, H. E. (2000). Arbuscular mycorrhizal fungi
(glomales) in Egypt. I. A field survey of Arbuscular
mycorrhizal fungi associated with medicinal plants and
effect of inoculation on growth of some plants. African
Journal of Mycology and Biotechnology, 8(3), 1-12.
Bisri, M., Limantara, L. M., Prasetyorini, L., &
Chasanawati, D. (2017). Application of the Kineros
model for predicting the effect of land use on the
surface run-off Case study in Brantas sub-watershed,
Klojen District, Malang City, East Java Province of
Indonesia. Journal of Water and Land Development.
Suripin, S., Sangkawati, S. S., Pranoto, S. A., Sutarto, E.,
Hary, B., & Dwi, K. (2018). Reducing stormwater
runoff from parking lot with permeable pavement. In
E3S Web of Conferences (Vol. 73, p. 05016). EDP
Sciences.
iCAST-ES 2021 - International Conference on Applied Science and Technology on Engineering Science
1168
