
The Implementation of the Placement of Health Workers in Health
Centers using K-Means Clustering Method: Case Study in the City of
Samarinda
Damar Nurcahyono and Tien Rahayu Tulili
Department of Informatics Engineering, Politeknik Negeri Samarinda, Jl. Cipto Mangun Kusumo, Samarinda, Indonesia
Keywords: Health Personnel, Health Centers, K-Means.
Abstract: Health centers and health workers is a relationship that cannot be separated during this division process of
health workers in health centers has not been evenly distributed because of the absence of a system that can
split health workers evenly to the health center. There is a way that can be used to divide the health workers
evenly by using a clustering method to create a decision support system divides the health workers at the
health center. The method that will be used for clustering decision support system is the K-Means algorithm,
the method is very suitable to divide the number of data in accordance with the criteria required for the
distribution of the location of the health center are evenly distributed in accordance with the criteria that have
been determined. The results of the research that has been conducted K-Means algorithm can be used as a
way out to divide the 30 health workers to 10 locations puskesmas more evenly and in accordance with the
criteria to improve the quality of health of the local community.
1 INTRODUCTION
Health workers have a very important role in
providing services at the health center. The health
center as the main door health services to the
community should be able to provide basic health
services for the optimal and appropriate standards of
competence. Health workers according to the Law
Health Law No. 36 Year 2009 is someone who has
the knowledge, skills and permission to perform
actions or health efforts and are willing to devote
themselves to the community in the field of health
(Indonesia, 2009) (Indonesia, 2014). While based on
the Regulation of the Minister of Health No. 75
Tahun 2014 said that health workers who work based
on standards of personnel at health centers have at
least 9 different types of health workers (World
Health Organization, 2014). The ratio for health
workers is still very much in the distribution of health
personnel, so that in the distribution of health
personnel to the health center is still widely found not
meet the standards, then the necessary planning and
the procurement of health workers so that in the
distribution of health workers can meet the standard
of competence. To undergo placement of health
workers require decision support systems by the
method of K-means Clustering. K-Means Clustering
is included in the partitioning clustering of each data
should be entered in a certain cluster and allows for
any data included in the cluster in a particular stage
of the process, in the next step move to other clusters.
K-Means splitting the data into k regions separate
section where k is an integer positive. K-Means
algorithm is very famous because of its ease and its
ability to classify big data and outliers with very
quickly. (Kusumadewi, 2009).
Classic problem faced by Indonesia in an effort to
realize the health care fair and equitable for the
community is the availability of health workers at the
level of basic service that is not evenly amount and its
distribution in the health center. The goal is to apply
the placement of health workers in health centers in
the City of Samarinda.
2 LITERATURE REVIEW
Research conducted referring to the previous research
by Besse Faradibah entitled “ Design of decision
support systems power distribution medical health
center in south Sulawesi by using the Method of
Analytical Hierarchy Process (Case Study Maros).
1146
Nurcahyono, D. and Tulili, T.
The Implementation of the Placement of Health Workers in Health Centers using K-Means Clustering Method: Case Study in the City of Samarinda.
DOI: 10.5220/0010961100003260
In Proceedings of the 4th International Conference on Applied Science and Technology on Engineering Science (iCAST-ES 2021), pages 1146-1152
ISBN: 978-989-758-615-6; ISSN: 2975-8246
Copyright
c
2023 by SCITEPRESS – Science and Technology Publications, Lda. Under CC license (CC BY-NC-ND 4.0)

1
The second is made by Tri Afriliyanti and Sri
Matheus with the title “Design of Decision Support
System for the Determination of the healthy Home”.
K-Means Clustering is included in the partitioning
clustering of each data must be entered preformance
cluster specific and allows for any data included in
the cluster in a particular stage of the process, in the
next step move to other clusters. K-Means splitting
the data into k regions separate section where k is an
integer positive. K-Means algorithm is very famous
because of its ease and its ability to classify big data
and outliers with very quickly (Kusumadewi, 2009).
There are many methods that can be used in
clustering example K-means clustering method.
Grouping can be used as a grouping of non-hierarchy
that divides the data into two or more groups. K-
means clustering is a method of cluster analysis
which leads to the division of N objects of
observations into K groups (clusters) and any of the
object of observation is owned by a group with
average (mean) nearby (Prasetyo et al., 2012).
Calculate the distance between the middle point
with the point of each object Using the distance
formula Euclidean
.D (i,j) =
√(𝑋1𝑖 − 𝑋 𝑗)2 + (𝑋2𝑖 + 𝑋2𝑗)2+ ..+ (𝑋𝑖 − 𝑋𝑗)2 (2.1)
Where :
D (i, j) = The distance data to the i to the center of
cluster j
𝑋𝑘𝑖 = Data to the i on the attributes of data to k 𝑋𝑘𝑗
= Point a to j on attributes into k
Grouping object to determine the members of the
cluster is to take into account the minimum distance
of the object.
1. Back to phase-2, do looping up to the value of the
centroid of the resulting fixed and a member of the
cluster does not move to the other clusters. K-Means
Clustering method can only process data in the form
of numbers, then to data in the form of nominal
should be initialized first in the form of numbers. His
pace is:
1. Sort data based on the frequency of its
appearance.
2. Initialize the data starting from the data of the
highest with a value of 1. Then the next data 2, 3
and so on.
2.1 Clustering
Clustering is a method of analyzing the data or objects
which enter as one of the methods that the goal is to
classify the data with the same characteristics in a
region of the same data and with different
characteristics in the territory of the other. There are
several approaches used in developing a clustering
method. Two main approaches are clustering
approach to partition and clustering with the approach
of the hierarchy. Clustering approach to partition or
often called the partition-based clustering groups the
data (objects) with the selected data are analyzed in
clusters that exist. Clustering with the approach of the
hierarchy or often referred to as hierarchical
clustering to classify the data by creating a hierarchy
of the form of a dendogram which the data are similar
will be placed in a hierarchy within easy reach and
not on the hierarchy are far apart. In addition to the
second approach, there is also a clustering approach
with automatic mapping (Self-Organising
Map/SOM).
3 RESEARCH METHOD
This study uses a model of the process is the Waterfall
or often also referred to as the waterfall model, the
waterfall method includes two stages, namely :
3.1 Stage Definition and Requirements
Analysis
The analysis is carried out to collect data centers and
health workers, and then specify criteria for the
determination of which is used in the process of
placement of health workers. The analysis includes
input, process and output.
3.2 Stage of System Design and
Software
At the design stage is done the design process which
can then be used for the construction of the system.
The design process itself consists of the design of the
groove decisions, the design of the decision table, the
design of process modeling, design data modeling
and perencangan user interface.
4 RESULT AND DISCUSSION
4.1 System Design
This system helps in taking the decision to
determine the placement of health workers who are
already in the count based on the criteria that has been
set. This system will ensure that all required data has
The Implementation of the Placement of Health Workers in Health Centers using K-Means Clustering Method: Case Study in the City of
Samarinda
1147
been available, then the system will process using
K-Means Clustering algorithm, the output of which
is produced in the form of reports the location of the
placement of health workers at the health center
that has been set i.e. Puskesmas Sidomulyo,
Puskesmas Lempake, Puskesmas Mangkupalas,
health centers Trauma Centra, Puskesmas
Pasundan, Puskesmas Teen, Puskesmas Sungai
Kapih, health center New Hope, health centers,
Water, and health centers Spe.
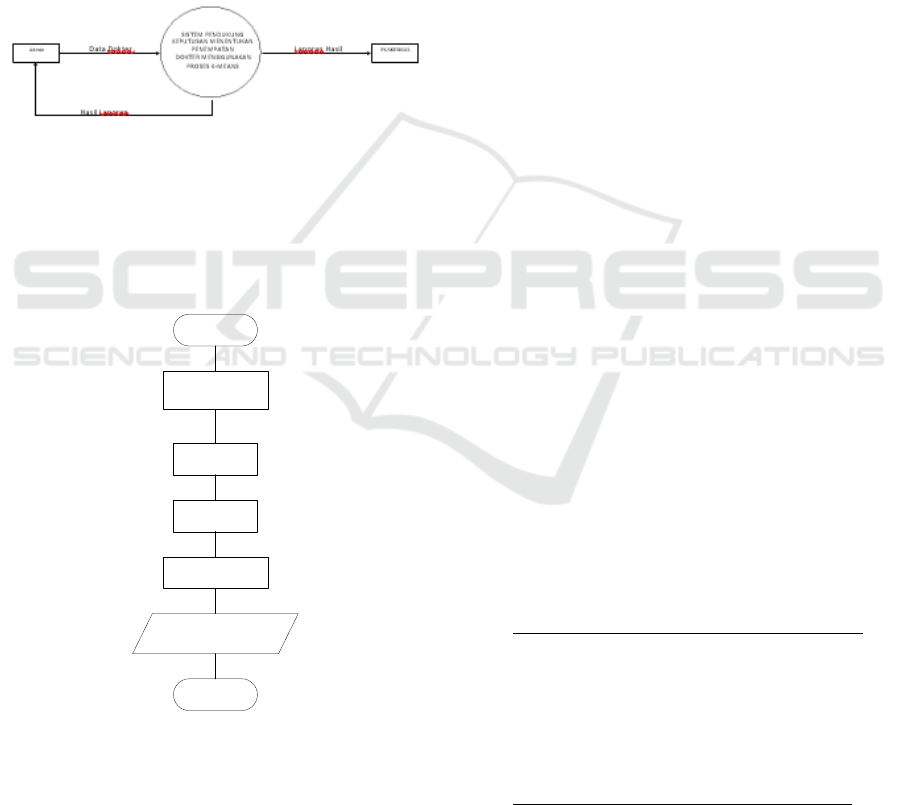
4.2 Context Diagram
Describe the contex diagram and entity –entity
outside of the other which gives the input output is.
Figure 1: Context Diagram Determine Power Health.
In the design flow chart on decision support system
placement of Health Workers in health centers of the
city was using the method of k-means clustering aims
to provide a general overview on the flow diagram or
flowchart in figure 2.
Mulai
Riset Awal
Analisa Dat a
Clustering Data Metode K-
Mea ns
Hasil Clustering Metode
K-Means
Selesai
Pengumpulan Data
Figure 2: Flow diagram.
4.3 Calculation Data
The Parameters of The Placement of Health Workers
The limits given in the completion of the placement
of Health workers in health centers of the city was as
follows:
1. The Data used as a reference or parameter in
determining the placement of health workers is work
experience, quality of work, cooperation,
responsibility.
2. In this study, only using 30 data health workers
drawn from the office of the City health department
Was as a sample calculation of the K-Means
Clustering.
4.4 The Calculation of The K-Means
Clustering
Determine a centroid randomly with values between
the lowest value to the highest value on the initial data
contained in table 1 is the centroid of the first that will
be used is a:
Table 1: Is The Centroid Of The Initial.
CENTROID V W Y Z
C1 10 90 90 90
C2 9 95 90 95
C3 7 80 79 84
C4 1 78 95 87
C5 7 75 70 75
C6 4 69 69 70
C7 3 86 78 90
C8 1 78 80 85
C9 2 90 84 96
C10 5 80 78 86
Description :
V = Work Experience
W = Quality Of Work
Y = Cooperation
Z = Responsibility
Calculation of the distance of the object to the
centroid by using the formula ecludien with the
formula contained in equation 1.
Calculation of the distance data of Health Workers
one with a centroid 1 is
𝑥
(,)
=
(
1−10
)
+
(
69 − 90
)
+
(
96 − 90
)
+
(
100
−90
)
= 25.65
Calculation of the distance data of Health Workers
one with a centroid 2 is
𝑥
(,)
=
(
1−9
)
+
(
69 − 95
)
+
(
96 − 90
)
+
(
100
−95
)
= 28.30
iCAST-ES 2021 - International Conference on Applied Science and Technology on Engineering Science
1148

Calculation of the distance data of Health Workers
one with the center of the centroid of the 3 is
𝑥
(,)
=
(
1−7
)
+
(
69 − 80
)
+
(
96 − 79
)
+
(
100
−84
)
= 26.50
Calculation of the distance data of Health Workers
one with a centroid 4 is
𝑥
(,)
=
(
1−1
)
+
(
69 − 78
)
+
(
96 − 95
)
+
(
100
−87
)
= 15.84
Calculation of the distance data of Health Workers
one with a centroid 5 is
𝑥
(,)
=
(
1−7
)
+
(
69 − 75
)
+
(
96 − 70
)
+
(
100
−75
)
= 37.05
Calculation of the distance data of Health Workers
one with a centroid 6 is
𝑥
(,)
=
(
1−4
)
+
(
69 − 69
)
+
(
96 − 69
)
+
(
100
−70
)
= 40.47
Calculation of the distance data of Health Workers
one with a centroid 7 is
𝑥
(,)
=
(
1−3
)
+
(
69 − 86
)
+
(
96 − 78
)
+
(
100
−90
)
= 26.78
Calculation of the distance data of Health Workers
one with a centroid 8 is
𝑥
(,)
=
(
1−1
)
+
(
69 − 78
)
+
(
96 − 80
)
+
(
100
−85
)
= 23.71
Calculation of the distance data of Health Workers
one with a centroid 9 is
𝑥
(,)
=
(
1−2
)
+
(
69 − 90
)
+
(
96 − 84
)
+
(
100
−96
)
= 24.54
Calculation of the distance data of Health Workers
one with a centroid 10 is
𝑥
(,)
=
(
1−5
)
+
(
69 − 80
)
+
(
96 − 78
)
+
(
100
−86
)
= 25.63
The results of the clustering method K-Means
algorithm at iteration 1 with the point of the centroid
of the early that has been in the specify the data to be
members due to have the closest distance to the center
point to the centroid.
Table 2: The results of the Calculation Iteration 1.
No. Point Centroid Name of Health Workforce Result
1 C1 A1
A2
A3 3
2 C2 B1
B2 2
3 C3 C1
C2
C3
C4 3
4 C4 D1
D2
D3
D4 4
5 C5 E1
E2
E3 3
6 C6 F1
F2
F3 3
7 C7 G1
G2 2
8 C8 H1
H2
H3 4
9 C9 I1
I2
I3 3
10 C10 J1
J2
J3 3
To see whether there is a change point centroid at
iteration 1, then do the calculation of the search is the
centroid of the new, if not there is a change in the
point of centorid before and after, then the calculation
at the point of the centroid is considered finished.
The Implementation of the Placement of Health Workers in Health Centers using K-Means Clustering Method: Case Study in the City of
Samarinda
1149
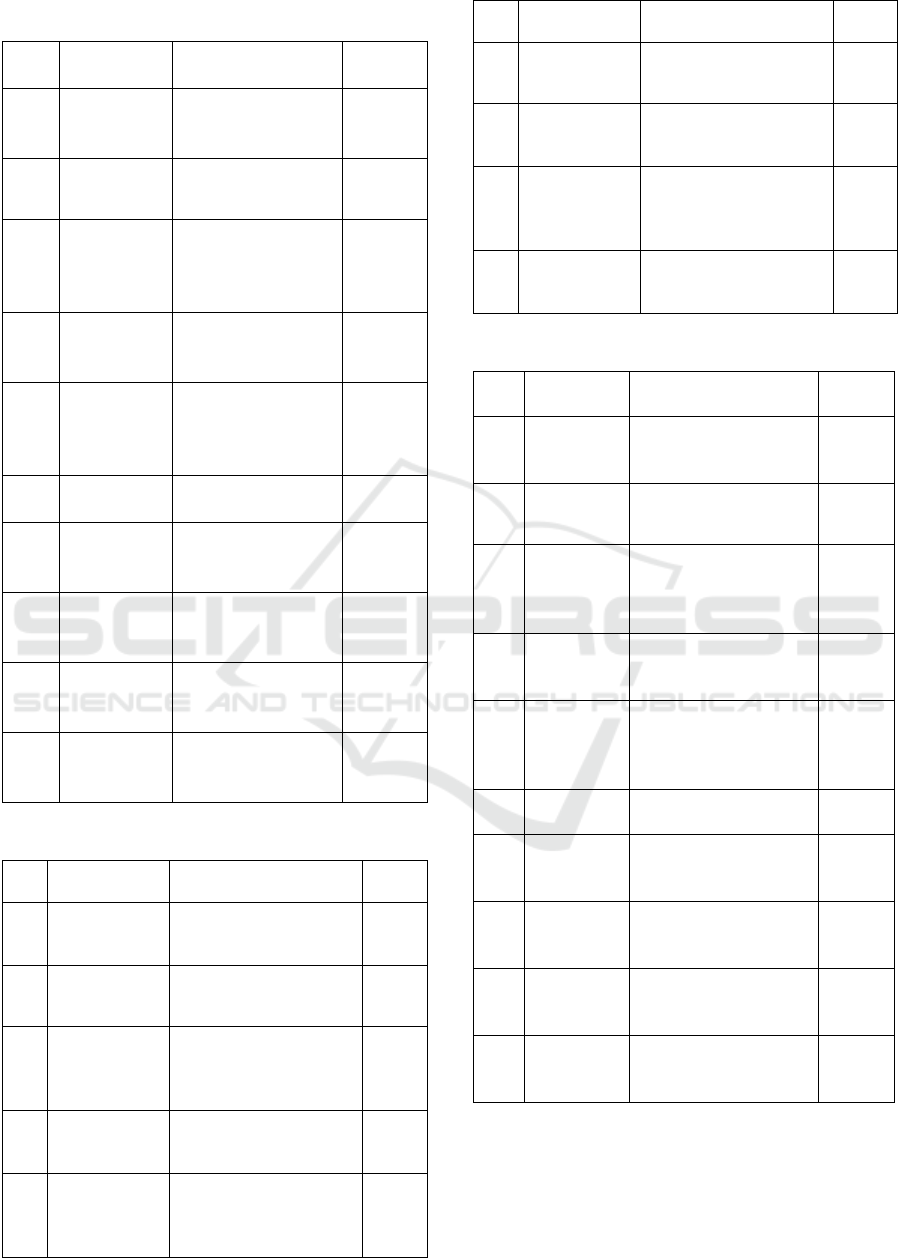
Table 3: The Results of the Calculation Iteration 2.
Table 4: The Results of the Calculation Iteration 3.
No
.
Point
Centroid
The Name Of The
Health
Resul
t
1 C1 A1
A2
A3
3
2 C2 B1
B2
2
3 C3 C2
C3
H3
C4
4
4 C4 D1
D2
D3
4
5 C5 F3
E1
E2
E3
3
6 C6 F1
F2
2
7 C7 G1
G2
2
8 C8 H1
H2
C1
3
9 C9 I1
I2
I3
D4
4
10 C10 J1
J2
J3
3
Table 5: The Results of the Calculation Iteration 4.
No. Point
Centroid
The Name Of The
Health
Result
1 C1 A1
A2
A3
3
2 C2 B1
B2
2
3 C3 C2
C3
H3
C4
4
4 C4 D1
D2
D3
3
5 C5 F3
E1
E2
E3
4
6 C6 F1
F2
2
7 C7 I3
G1
G2
3
8 C8 H1.
H2
C1
3
9 C9 I1
I2
D4
3
10 C10 J1
J2
J3
3
Looping stopped because of the results of the
calculations on iteration 3 and iteration to 4 does not
change, then the results of clustering using the
placement of Health Workers in health centers of the
city was using the method of K-Means to get results.
No. Point
Centroid
The Name Of
The Health
Result
1 C1 A1
A2
A3
3
2 C2 B1
B2
2
3 C3 C2
C3
C4
H3
4
4 C4 D1
D2
D3
3
5 C5 F3
E1
E2
E3
4
6 C6 F1
F2
2
7 C7 I3
G1
G2
3
8 C8 H1
H2
C1
3
9 C9 I1
I2
D4
3
10 C10 J1
J2
J3
3
iCAST-ES 2021 - International Conference on Applied Science and Technology on Engineering Science
1150
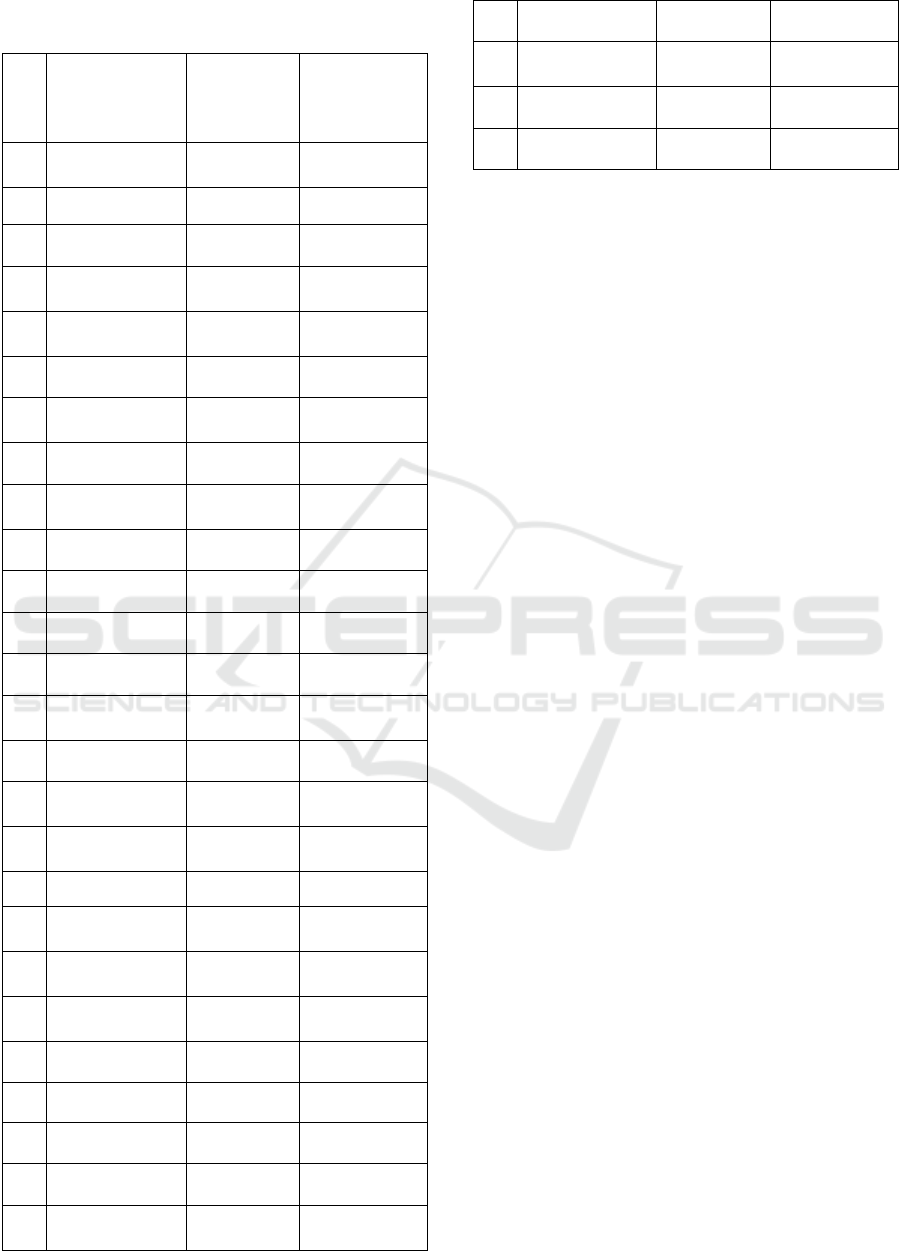
Table 6: The Results of the Placement of Health Workers
Using the Method of K-Means.
N
o The Name O
f
The Health
Power
Health
The
Location Of
The Health
Center
1 D1
N
urse Trauma
Cente
r
2 I1
N
urse Air Putih
3 I2
N
urse Air Putih
4 D2
N
urse Trauma
Cente
r
5 H1
N
urse Harapan
Baru
6 F1
N
urse Remaja
7 H2
N
urse Harapan
Baru
8 A1
N
urse Sidomulyo
9 C1
N
urse Harapan
Baru
10 B1
N
urse Lempake
11 J1
N
urse Sambutan
12 F2
N
urse Remaja
13 A2
N
urse Sidomulyo
14 I3
N
urse Sungai
Kapih
15 F3
N
urse Pasundan
16 C2
N
urse Mangkupala
s
17 D3
N
urse Trauma
Cente
r
18 B2
N
urse Lempake
19 C3
N
urse Mangkupala
s
20 H3
N
urse Mangkupala
s
21 G1
N
urse Sungai
Kapih
22 D4
N
urse Air Putih
23 E1
N
urse Pasundan
24 J2
N
urse Sambutan
25 J3
N
urse Sambutan
26 G2
N
urse Sungai
Kapih
27 E2
N
urse Pasundan
28 C4
N
urse Mangkupala
s
29 E3
N
urse Pasundan
30 A3
N
urse Sidomulyo
5 CONCLUSIONS
From the research that has been done, it can be
concluded that the:
1. The method of K-Means can be applied to the
decision support system the placement of Health
Workers in health centers of the city of samarinda.
2. The First Cluster is the health personnel will be in
place at puskesmas sidomulyo, the second cluster
is the health personnel will be in place at
puskesmas lempake, cluster the third is the health
personnel will be in place at the health center
mangkupalas,cluster fourth is the health workers
who will be placed on health trauma center,
cluster fifth is the health workers that will be in
place at puskesmas pasundan, cluster sixth is the
health personnel will be in place at the health
center teen, the cluster of the seven is the most
health will be in place at puskesmas sungai kapih,
cluster eighth is the health personnel will be in
place at the health center new hope, the cluster of
the ninth is the most health will be in place at the
health center white water, and cluster the tenth is
the health personnel will be in place at the health
center welcome.
REFERENCES
Afriliyanti, T., & Winiarti, S. (2013). Perancangan Sistem
Pendukung Keputusan Penentuan Rumah Sehat
(Doctoral dissertation, Universitas Ahmad Dahlan).
Besse Faradibah. (2017). Design build Decision Support
System for the Distribution of Medical health center in
South Sulawesi By Using the Method of Analytical
Hirearchy Process (Case Study Maros).
Indonesia, R. (2009). Undang-undang Republik Indonesia
nomor 36 tahun 2009 tentang Kesehatan. Jakarta
Republik Indones.
Indonesia, P. R. (2014). Undang-Undang Republik
Indonesia Nomor 5 Tahun 2014 Tentang Aparatur Sipil
Negara.
Kusumadewi, S. (2009). Klasifikasi Status Gizi
Menggunakan Naive Bayesian Classification. CommIT
(Communication and Information Technology)
Journal, 3(1), 6-11.
The Implementation of the Placement of Health Workers in Health Centers using K-Means Clustering Method: Case Study in the City of
Samarinda
1151

Prasetyo, P. K., Lo, D., Achananuparp, P., Tian, Y., & Lim,
E. P. (2012, September). Automatic classification of
software related microblogs. In 2012 28th IEEE
International Conference on Software Maintenance
(ICSM) (pp. 596-599). IEEE.
Romadhona, Y. S., & Siregar, K. N. (2018). Analisis
sebaran tenaga kesehatan puskesmas di indonesia
berdasarkan peraturan menteri kesehatan nomor 75
Tahun 2014 tentang Puskesmas. Jurnal Kesehatan
Manarang, 4(2), 114-121.
World Health Organization. (2014). Ministry of Health of
the Republic of Indonesia. Prevention and control of
dengue fever and dengue fever, World Health
Organization and Ministry of Health of the Republic of
Indonesia, Jakarta.
iCAST-ES 2021 - International Conference on Applied Science and Technology on Engineering Science
1152
