
Response Spectrum Analysis of RC Bridge using Indonesian
Earthquake Map 2017: Case Study - Bonak RC Bridge, TTU, NTT,
Indonesia
Valentinus E. Bano, Albert Aun Umbu Nday and Matheus R. Sodanango
Civil Engineering Program, State Polytechnic of Kupang, Kupang, Indonesia
Keywords: Respons Spectrum, Earthquake Map, RC Bridges.
Abstract: The use of the 2017 Indonesia Earthquake Map has not been massively used by the relevant stakeholders.
Even the regulations SNI 2833 : 2016 regarded Indonesia Earthquake Map 2012. Updating maping recently
must be followed by newly regulations. However, structural designed must accomodating newly Indonesia
Earthquake based on SNI 2833 : 2016. This structural planning made significantly changes of earthquake
loads. This reseacrh did newly Earthquake Map to Bonak Bridge with new respons analysis using SAP 2000
as Program analysis. Design to the structure including plate, beam and abutment. This research showed
changes of earthquake loads and resulting changed of dimensions and steel reinforcement on structural
system.
1 INTRODUCTION
The use of the 2017 Indonesia Earthquake Map
(Asrurifak, 2017), has not been massively used by the
relevant stakeholders. Even the regulation on the use
of Earthquake maps has not been updated, which still
uses the old Earthquake map (Umum, 2010). It can be
seen in the latest regulation, SNI 2833: 2016 (2016,
2016)], that is appeared in 2016. As is known,
Indonesia is located in an area of tectonic and
volcanic earthquakes which is meeting of three
tectonic plates, there are the Indo-Australian Plate,
the Eurasian Plate and the Pacific Plate (Mallisa,
2010). This condition will affecting all of
infrastructure designs. The development of research
on earthquake conditions is inversely proportional
with the newly regulations. Therefore the subject of
this research is given describes of influeting newly
Indonesian Eartquake Map to the bridge behaviors. It
is considerable impacted to the earthquake loads and
is possible changes dimensions and steel
reinforcement of the structural designs.
2 LITERATURE RIVIEW
A. Indonesian Earthquake Maping
According to the design of structural requirement,
Indonesian Government through “Badan Standarisasi
Nasional (BSN)” produced regulations of structural
design. Started from design, loading, and structural
analysis. One of the regulations is implementation of
earthquake loads to structural analysis. Therefore, it
is necessary to have a common perception and
understanding in field of structural planning.
Similarity of designers perceptions have seen in
Indonesian Earthquake Map. The newly Indonesian
Earthquake Map, as in (Asrurifak, 2017) however it is
aplicated according to SNI 2833 : 2016, as in (2016,
2016) has not been accomodated of newly regulations.
B. Seismic Analyses
Modelling on bridges seismic analysis was highly
produce in a lot of bridges research. A three-
dimensionan model of bridges was developed by
using SAP 2000 in many parrameters such as
changing the superstructure mass, changing the
concrete compressive strength, changing the plastic
hinge length, and damping results descibes of briges
seismic behaviors (Gao, 2018). A type of irregular-
continuous bridges and prediction of displacement
based seismic design was resulted that pushover curve
Bano, V., Nday, A. and Sodanango, M.
Response Spectrum Analysis of RC Bridge using Indonesian Earthquake Map 2017: Case Study - Bonak RC Bridge, TTU, NTT, Indonesia.
DOI: 10.5220/0010960800003260
In Proceedings of the 4th International Conference on Applied Science and Technology on Engineering Science (iCAST-ES 2021), pages 1133-1137
ISBN: 978-989-758-615-6; ISSN: 2975-8246
Copyright
c
2023 by SCITEPRESS – Science and Technology Publications, Lda. Under CC license (CC BY-NC-ND 4.0)
1133

resulted by analysis of capacity of spectrum (Li,
Xiang, Wei, Yan, & Xia, 2020). A seismic isolators
can effective to stiffness and damping compared to the
multi-mode response spectrum analysis (MMRSA).
The isolators incuded laminated elastomeric bearings,
elasto-plastic devices, and fiction pendulums (Simon
& Vigh, 2013). The parameter of respons spectrum
which is describe in 2017 Indonesia Earthquake Map
it shown in Fig. 1, as in (Asrurifak, 2017)
Figure 1: Respons spectrum graph parameter.
3 MODELING OF BRIDGE
STRUCTURE
Modelling has used by SAP 2000 Program. A three-
dimensional model incuding the shape of bridges,
loads, and structure analysis done in this research. For
earthquake loads used respons spectrum analysis from
newly Indonesia Earthquake Map was appeared in
2017.
C. Materials Spesification
A bridge planned with the spesifications i.e. age of
bridge 50 years; length 15 m; trotoar way 2x1 m;
concrete compressive strength (fc’) 33 MPa; and
tensile steel reinforcement 400 MPa.
D. Regulations
The newly indonesian regulations of bridges design
was used in this research to established of legal
standing. Regulations such as bridges loads
regulation SNI 1725 : 2015 [8]; Bridges planned for
resisted eartquake behaviors SNI 2833 : 2016.
E. Bridge Modelling
A bridge planned named Bonak Bridge is RC bridge
and located in TTU, Indonesia. With long-span model
have been seen in Fig. 2 and short-span model have
been seen in Fig. 3.
Figure 2: Long-span model.
Figure 3: Short-span model.
A SAP 2000 bridge model have been seen in Fig, 4. It
has inputs loaded from Dead Load, Live Load,
Moving Vehicle Loads and Earthquake Loads.
Figure 4: A three-dimensional model.
4 RESULTS AND DISCUSSIONS
F. Earthquake Loads
• PGA grades with probabilty 7% in 75 years.
With range 0.3 – 0.4 g. And the grade in the
location of bridge is 0.35 g. PGA map it shown
in Fig. 5.
iCAST-ES 2021 - International Conference on Applied Science and Technology on Engineering Science
1134
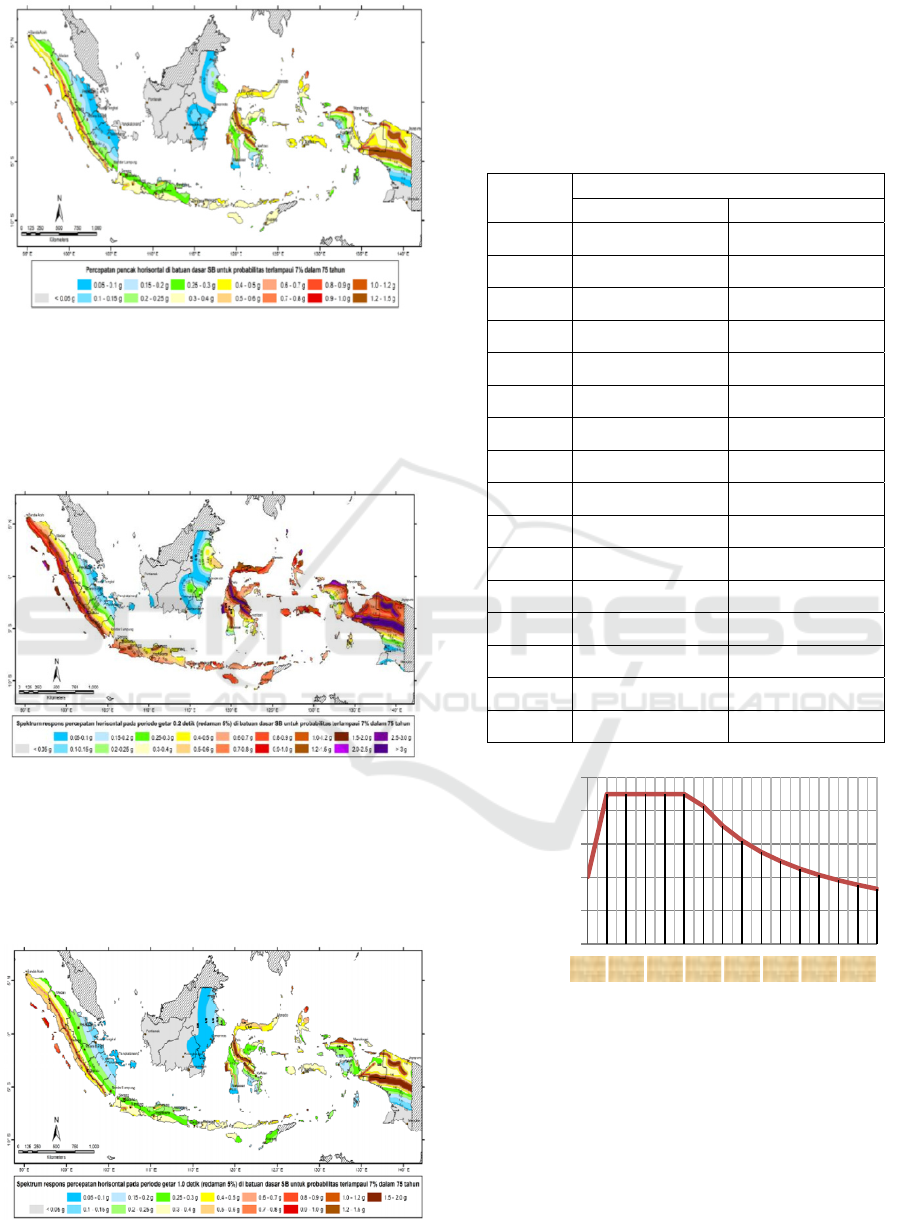
Figue 5: PGA grades of Indonesian Earthquake Map.
• Ss grades (respon spektra 0.2 second) on bed
rock condition with probabilty 7% in 75 years
with range 0.7 – 0.8 g. And Ss grade in the
location of bridge is 0.75 g. Ss map it shown in
Fig. 6.
Figue 6: Ss grades of Indonesian Earthquake Map.
• S
1
grades (respon spektra 1 second) on bed
rock condition with probabilty 7% in 75 years
with range 0.25 – 0.3 g. And S
1
grade in the
location of bridge is 0.27 g. S
1
map it shown in
Fig. 7.
Figure 7: S
1
grades of Indonesian Earthquake Map.
• Based on the earthquake map, the analysis of
respons spectrum can obtained the period and
the acceleration and it shown on Table 1. And
the graph of Respons Spectrum it shown in Fig
8
Table 1: Period and Acceleration of Respons Spectrum.
Number
Respons Spectrum Data
Period Acceleration
1 0 0.4025
2 0.1111 0.9
3 0.2222 0.9
4 0.3333 0.9
5 0.4444 0.9
6 0.5558 0.9
7 0.6667 0.828
8 0.7778 0.710
9 0.8889 0.621
10 1.0000 0.552
11 1.1111 0.497
12 1.2222 0.452
13 1.3333 0.414
14 1.4444 0.382
15 1.5556 0.355
16 1.6667 0.331
Figure 8: Respons spectrum graph.
G. Bridge Structure Design
• Design of trototoar way used steel reinforment
at longitudinal bars is 4 D 10; then traversal
bars used ϕ 8 – 100. As a part with trotoar way,
cantilever slab was design used longitudinal
bars D13 – 220; then transversal bars used ϕ10
0,0000
0,2000
0,4000
0,6000
0,8000
1,0000
0,00 0,22 0,44 0,67 0,89 1,11 1,33 1,56
Cs,m
Periode (T second)
Response Spectrum Analysis of RC Bridge using Indonesian Earthquake Map 2017: Case Study - Bonak RC Bridge, TTU, NTT, Indonesia
1135

– 260. The design of trotoar way and
cantilever slab shown in Fig. 9
Figure 9: Design of trotoar way and cantilever slab.
• Bridge slab has 200 mm of thickness and was
used two level steel reinforment on top level
and bottom level. At top level used
longitudinal bars D13 – 180 and trasversal
bars ϕ10 – 200. And bottom level used
longitudinal bars D13 – 220 and trasversal
bars ϕ10 – 200. Bridge slab detailed shown in
Fig. 10.
Figure 10: Bridge slab detailing.
• Diafragma beams as a transversal beams of
bridge structure have a major functional to
avoid deeply deflection of longitudinal beams
and to increase the stifness of bridges. A 300
x 500 mm of diafragma beam dimensions was
used at top steel bars 2D19 and bottom steel
bars 4D19. And traversal steel bars used ϕ13 –
100. The detailed of diafragma beams shown
in Fig. 11.
Figure 11: Detailing of diafragma beams.
• Main girders as a longitudinal beams which
are resisted to diafragma beams and bridges
plate. This main girders with dimensions 600
x 1200 mm was used 15D32 as steel
reinforment at longitudinal bars and used ϕ13
– 140 at trasversal steel bars. The detailed of
mai girdesrs shown in Fig. 12.
Figure 12: Detailing of main girders.
• Detailing of head abutment and body of
abutment are shown in Fig. 13 and Fig. 14.
Figure 13: Detailing of head abutment.
iCAST-ES 2021 - International Conference on Applied Science and Technology on Engineering Science
1136

Figure 14: Detailing of body abutment.
5 CONCLUSIONS
The conclusions of this research is describing a three-
dimensional bridge model with SAP 2000 program
and answered behaviors of structure when use others
earthquake loads in Indonesian teritory. The main
conclusions from this study are summarized as
follows :
• Newly updating of earthquake map can
changes earthquake loads
• Changing in earthquake loads can possible
changes dimensions and steel reinforment
• Updating earthquake map must followed by
the newly regulations
REFERENCES
2016, S. 2. (2016). Standar Nasional Indonesia
Perencanaan Jembatan Terhadap Berban Gempa
(2016 ed.). Jakarta, Indonesi: Badan Standarisasi
Nasional.
Asrurifak, M. (2017). PETA GEMPA INDONESIA 2017
DAN APLIKASINYA UNTUK PERENCANAAN
GEDUNG DAN INFRASATRUKTUR TAHAN
GEMPA. Workshop, Bidang Pengembangan Standar,
Manual dan Pedoman HATTI, Surabaya.
Gao, Y. (2018, January). EFFECTS OF MODELLING
PARAMETERS ON THE SEISMIC ANALYSIS OF
BRIDGES. Int. J. Comp. Meth. and Exp. Meas, 6(5),
868-879.
Li, S., Xiang, P., Wei, B., Yan, L., & Xia, Y. (2020,
September). A Nonlinear Static Procedure for the
Seismic Design of Symmetrical Irregular Bridges.
Shock and Vibration , 2020(1), 1-16.
Mallisa, Z. (2010, September). PERKEMBANGAN
ARAH FALSAFAH DESAIN SEISMIK STRUKTUR
BANGUNAN GEDUNG BERTINGKAT . Media
Litbang Sulteng III, 2, 96-103.
Simon, J., & Vigh, L. G. (2013, June). Response spectrum
analysis of girder bridges with seismic isolators using
effective stiffness . researchgate publication, 1(1), 1-
11.
Umum, K. P. (2010, 01). Retrieved from pustaka.pu.go.id:
https://pustaka.pu.go.id/biblio/peta-hazard-gempa-
indonesia-2010-sebagai-acuan-dasar-perencanaan-dan-
perancangan-infrastruktur-tahan-gempa/EB4G9
Response Spectrum Analysis of RC Bridge using Indonesian Earthquake Map 2017: Case Study - Bonak RC Bridge, TTU, NTT, Indonesia
1137
