
Visualization of the Spread Covid-19 Spread in East Nusa Tenggara
using the K-Means Data Mining Classification Method
Lita A. Ndoloe, Petrisia W. Sudarmadji and Christa E. B. Bire
Department of Informatic Engineering, Kupang State Polytechnic, Jalan Adji Sucipto, Indonesia
Keywords: Covid19, Mining Data, Kmeans, Web Applications.
Abstract: Covid-19 is a contagious disease, and is characterized by acute respiratory symptoms (SARS-CoV-2). The
COVID-19 is easily transmitted from one human to another through coughing or sneezing droplets (droplets).
The spread of COVID-19 cases in Indonesia is categorized as quite fast and has a negative impact on all fields.
The large area of the State of Indonesia is a problem in tracking the spread rate of Covid-19 in each province.
K-Means is a clustering algorithm that is used to group data into several groups by maximizing the similarity
of the data in a cluster. The implementation of k-means in a web-based application system aims to facilitate
the analysis of the spread of Covid-19 in East Nusa Tenggara Province. With this convenience, not only the
system can display information on the spread rate of Covid-19 informatively but also attract readers' interest
through a graphic display that makes it easier for readers to get complete information in one view.
1
INTRODUCTION
Covid-19 is a contagious disease, and characterized
by acute respiratory symptoms (SARSCoV-2). The
Covid-19 is easily transmitted from one human to
another through coughing/sneezing droplets
(droplets) originating from an infected human body.
Droplets containing the covid-19 virus can stick to
objects that are often touched. Consequently, humans
can get infected by touching the surface of the object
and then touching the face parts (For example, eyes,
nose, and mouth). Due to the ease of transmission, as
of April 3rd, 2021, the number of positive cases in
Indonesia has reached 1.5 million cases with 40
thousand deaths (Asroni, 2012).
The spread of Covid-19 cases that is evenly
distributed throughout Indonesia is a fairly rapid
spread and has a negative impact on all fields. The
vast territory of Indonesia allows the need for
grouping parts based on provinces in Indonesia.
Information regarding the level of spread of Covid-19
cases in each province of Indonesia can be found on
online media or news. However, the current delivery
of information tends to be textual, making it less
informative. With the large number of levels of the
spread of The COVID-19 Virus, the delivery of
information is textually irrelevant and does not attract
readers’ interests.
K-Means is one of the clustering algorithms
included in the unsupervised learning group which is
used to group data into several groups with a partition
system. This algorithm groups the data based on the
cluster center point (centroid) closest to the data. The
purpose of k-means is to group data by maximizing
the similarity of data in one cluster and minimizing
the similarity of data among clusters (Fitri Larasati,
2017).
The application of k-means in cases of the Covid-
19 spread can be used as a way to measure the level
of the Covid-19 virus spread in each province in
Indonesia. With accurate information on the level of
the Covid-19 spread, it can provide efforts for those
who take action to prevent the spread of this virus. It
also becomes a reference for the public to avoid places
that are the centre of the Covid-19 virus spread.
2
RESEARCH METHODS
In this study, the author uses the k-means algorithm
method to analyze the results of data on the spread of
the Covid-19 virus and the stages of the System
Development Life Cycle (SDLC) for system
development (Muhammad Ikbal, 2021).
1112
Ndoloe, L., Sudarmadji, P. and Bire, C.
Visualization of the Spread Covid-19 Spread in East Nusa Tenggara using the K-Means Data Mining Classification Method.
DOI: 10.5220/0010960400003260
In Proceedings of the 4th International Conference on Applied Science and Technology on Engineering Science (iCAST-ES 2021), pages 1112-1116
ISBN: 978-989-758-615-6; ISSN: 2975-8246
Copyright
c
2023 by SCITEPRESS – Science and Technology Publications, Lda. Under CC license (CC BY-NC-ND 4.0)
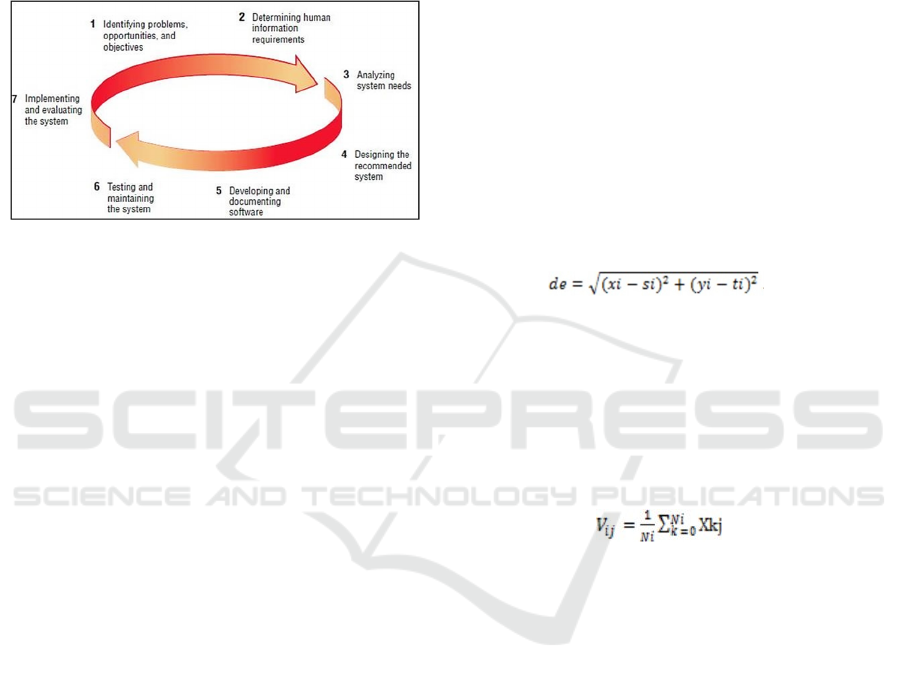
2.1 System Development Life Cycle
(SDLC)
SDLC or Systems Development Life Cycle is the
process of creating and modifying systems, models
and methodologies used to develop a software A.
engineering system. This concept generally refers to
a computer or information system.
Figure 1: Systems Development Life Cycle.
This study aims at implementing the k-means method
to measure the level of the covid-19 virus spread in
the province of East Nusa Tenggara (NTT) into a
website-based system. The system informatively
displays information on the level of the covid-19 virus
spread. In addition, it attracts readers' interest with
infographic displays that make it easier for readers to
obtain comprehensive information in one view.
The following are seven stages of system
development using the SDLC method employed this
study (Nayuni Dwitri, 2020):
1)
By displaying data on the spread of covid in
the form of infographics, it tends to attract the
readers' interests to get more complete
information.
2)
The data on the spread of covid 19 was
obtained from http://www.covid19.nttprov.
go.id per August 2021 containing of a city and
every districts in the province of East Nusa
Tenggara.
3)
The data that is needed is the positive
confirmation cases in East Nusa Tenggara
Province
4)
The design of the system employed the Unified
Modeling Language (UML) design diagram.
5)
The stage of making the system used the PHP
programming language and the bootstrap
framework.
6)
The system is tested using Blackbox testing
method that focuses on the accuracy of system
functions.
7)
The implementation of the system was applied
to the relevant government agencies as well as
evaluating it.
2.2 Algorithm K-Means
One of the Clustering algorithms is K-means which is
used to group data into several groups with several
clusters. The data is selected into several groups with
predetermined criteria and then collected into one
cluster. Where each cluster has a central point called
Centroids. The following are the steps to perform
optimization using the K-Means Algorithm (Windha,
2015):
1)
Choose the desired number of Clusters (k) in
the dataset
2)
Determine the center point (Centroid)
randomly at the initial stage
3)
Calculate the closest distance of each data to
the Centroid. Euclidean distance (d) is
calculation of the closest distance to the
Centroid. Use the formula below:
(1)
Description :
(x ,y) = Object Coordinate
(s ,t ) = Centroid Coordinate
i = amount of object
4)
Recalculate the Cluster center with the current
Cluster member. The Cluster Center is the
average of all data in a Cluster. It is calculated
using the formula:
(2)
Description:
Vij = Centroid on Cluster – i for variable –j
Ni = Amount of member in Cluster –i
i,k = Index from the Cluster
j = Index of variable
Xkj = Value of data –k variable – j for the
Cluster
5)
Recalculate each object using the new Cluster
center (new Centroid), this is the initial stage
of opening a new iteration. If the Cluster
members do not move to another Cluster, then
the Clustering process is declared complete.
However, if the Cluster members move to
another cluster, then return to step c until the
Cluster members do not move to another
cluster.
3
RESULTS AND DISCUSSION
When calculating the k-means algorithm, the system
Visualization of the Spread Covid-19 Spread in East Nusa Tenggara using the K-Means Data Mining Classification Method
1113
requires sample data of 22 districts and cities in the
province of East Nusa Tenggara that have been
affected by the spread of COVID-19. The following
is a sample data on the spread of Covid-19 obtained
from http://www.covid19.nttprov.go.id as of August
23, 2021.
Table 1: The Spread Rate of Covid-19 Virus in Cities and
Districts.
No
Kota / Kabupaten
Kasus Positif
1 Kabupaten Alo
r
978
2 Kabupaten Belu
1389
3 Kabupaten Ende 3804
4 Kabupaten Flores
1208
5 Timur Kabupaten
2055
6 Kupang Kabupaten
1049
7 Lembata Kabupaten
481
8 Malaka Kabupaten
1619
9 Manggarai
3399
10 Kabupaten Manggarai
1636
11 Barat Kabupaten
1210
12 Manggarai Timur
1712
13 Kabupaten Nagekeo
1614
14 Kabupaten Ngada
1124
15 Kabupaten Rote Ndao
3710
16 Kabupaten Sabu Raijua
644
17 Kabupaten Sikka
1191
18 Kabupaten Sumba Barat 1401
19 Daya Kabupaten Sumba
5180
20 Tengah Kabupaten Sumba
1595
21 Timur Kabupaten Timor
200
22 Tengah Selatan Kabupaten 14282
Based on the sample data, a pandemic
classification group was determined, these were
high and low levels of the virus spread. Then the
amount of clusters is 2 and the amount of data is 22.
According to the calculation of the k-means
algorithm, it is necessary to determine the initial
centroid point randomly. C1 (Kupang City) = 14282
and C2 (Ngada Regency) = 1712. In the Cluster of
the spread of COVID-19 which is the high level of
spread, the data is taken from the 22nd data, which
is Kupang City and for the Cluster with low spread
is the 12th data, which is Ngada Regency. This
value can be changed through the system.
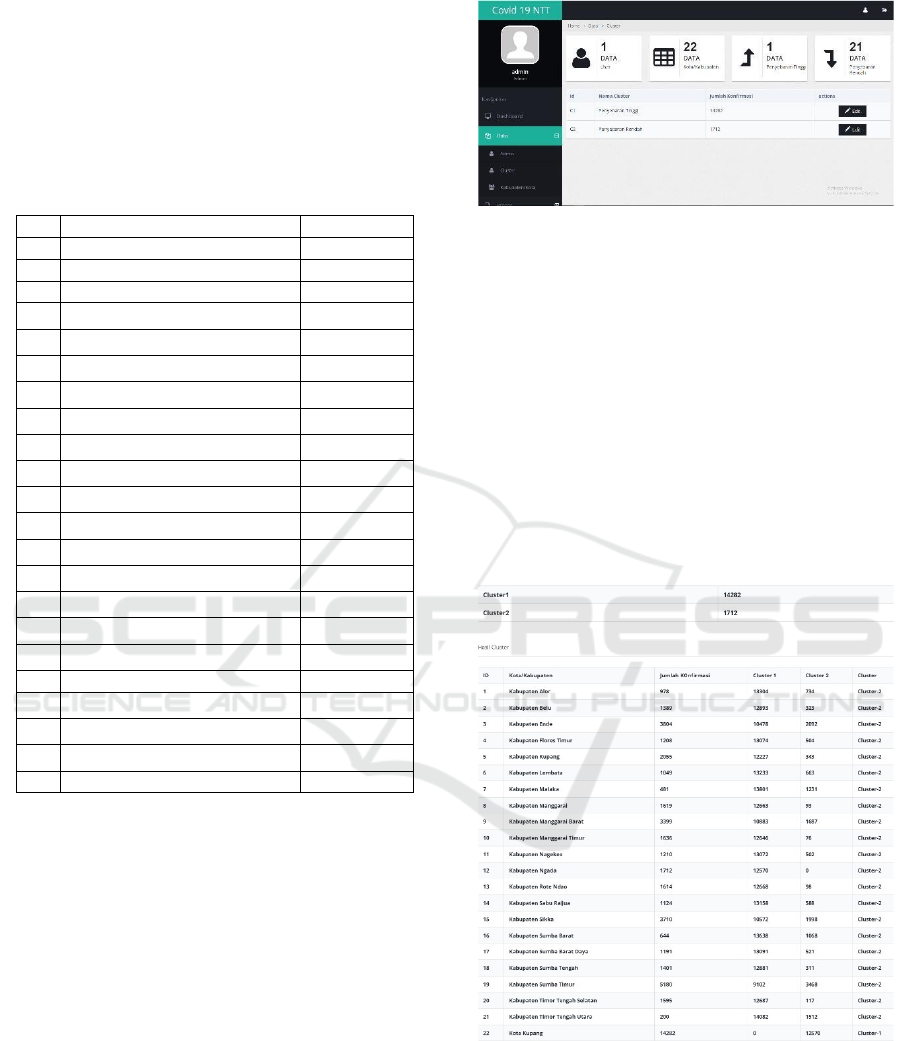
Figure 2: The Data Cluster Display.
The next stage is to calculate the distance of each
data with the Centroid. At this stage, the closest
distance between the data and the cluster will
determine which data belongs to the cluster. This
process is found in the process menu in the
calculation section. there are also several sub menus,
namely the recalculation menu, view calculation and
print. The recalculation
menu function works when
there are updates to Covid
cases in each region. The
system will recalculate. The view calculation menu
provides information or how to calculate k-means in
grouping a number of data by repeating iterations
until there are no different data. Here are the results
of the distance calculation in the 1st Iteration.
Figure 3: The Calculation of the Iteration.
The iteration results can be seen in the process
menu. There are 21 data that are in the low level of
transmission and 1 data that is in the high level of
trasnmission. In the process menu, the system
displays the results of the calculations in the form
of a table that describes which areas are included in
iCAST-ES 2021 - International Conference on Applied Science and Technology on Engineering Science
1114
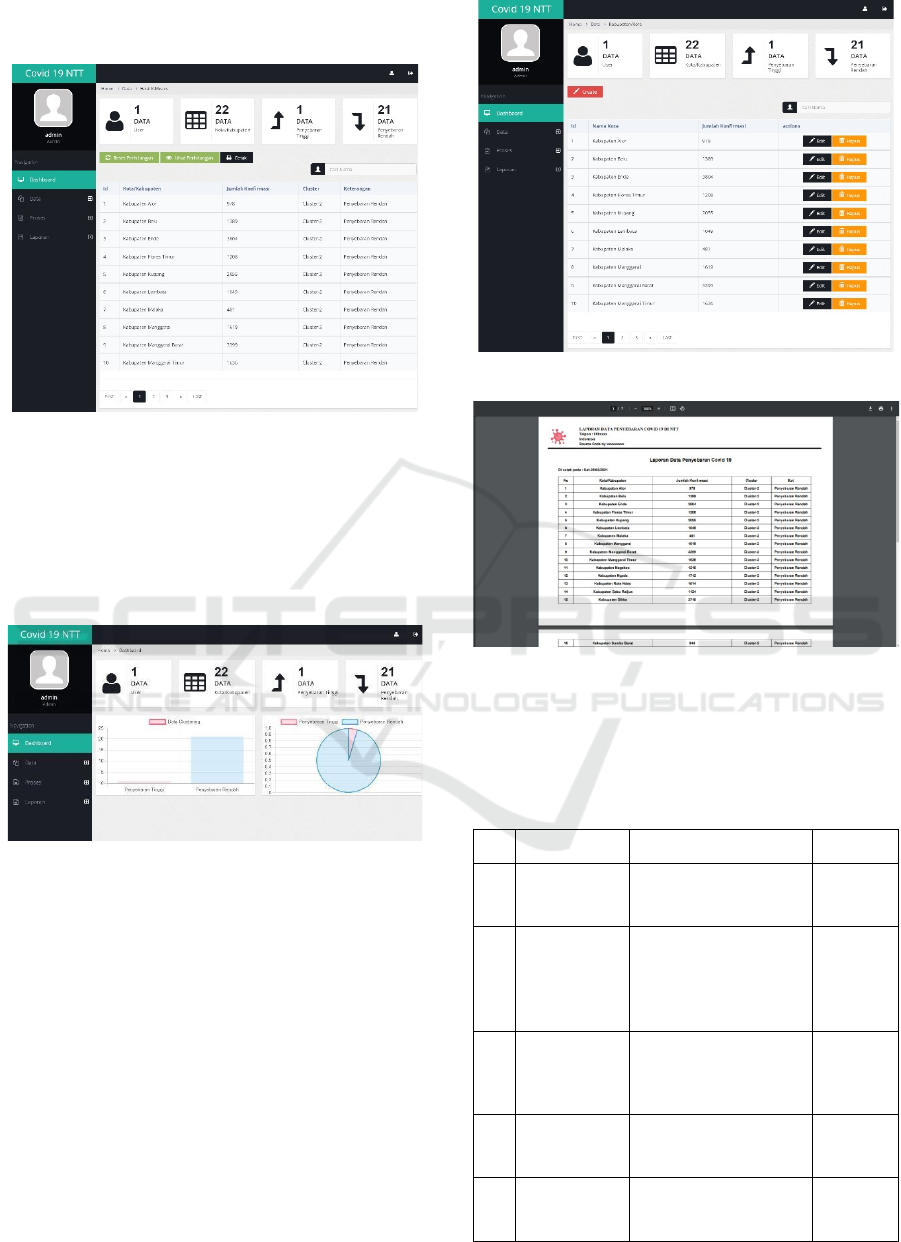
the cluster of high or low levels of spread. This can
be seen in Figure 4 below.
Figure 4: The Display of Process Menu.
Visually, it can be seen directly on the dashboard
menu which displays information in the form of a
graph of the level of spread of COVID-19 in the
province of East Nusa Tenggara. There are 4 main
menus, those are dashboard, data, processes and
reports in this section.
Figure 5: The Display of Dashboard Menu.
One of the sections or menus for processing data on
confirmation of positive COVID-19 cases can be seen
in the data menu in the city or district section which
displays information about the number of cases of the
COVID-19 spread in each area of the province of East
Nusa Tenggara. The data displayed can be updated
according to the development of Covid-19 cases.
The last menu is the report menu which is divided
into two parts, namely the district and city data report
and the clustering result report which is converted in
PDF form. This form can later be printed. The
following is the result of the clustering report in PDF
format which can be seen in Figure 7.
Figure 6: The Display for Cities and Districts.
Figure 7: Cluster Result Report.
The display of the application was then tested using
the black box method to find system loopholes/bugs.
The result of the black box test is shown in Table 2.
Table 2: Black Box Test.
No Test Scenario
Result Summary
1 Login form Verifying username and
password in order to
access the application
Valid
2 Dashboard
Menu
Displaying user data
information, district &
city data and displaying
a graph of the level of
the covi
d
sprea
d
Valid
3 Data Menu Displaying information
in the form of user data,
cluster data, district and
city data
Valid
4 Process Menu Showing the results of
calculation with the -
means metho
d
Valid
5 Report Menu Converting table data
to PDF format for
p
rintin
g
Valid
Visualization of the Spread Covid-19 Spread in East Nusa Tenggara using the K-Means Data Mining Classification Method
1115

4 CONCLUSIONS
This research succeeded in producing a visual
information system for the spread of Covid cases
throughout the province of East Nusa Tenggara.
Submission of information is displayed in the form of
a graph that can display information on the number of
high and low levels of a Covid case spread in all
regions. The proposed system also succeeded in
providing the results of the classification of covid
pandemic cases based on the total value of covid
cases in each region inputted by the user using the k-
means method. The results of the analysis provide
information on the status of the pandemic in the region
with a high or low level of spread. This research can
be developed as a covid case analysis system, so that
the regional covid data can always be updated.
REFERENCES
Asroni, Ronald Adrian., 2012. Penerapan Metode K-
Means Untuk Clustering Mahasiswa Berdasarkan
Nilai Akademik Dengan Weka Interface Studi Kasus
Pada Jurusan Teknik Informatika Umm Magelang.
Jurnal Ilmiah Semesta Teknika
Fitri Larasati Sibuea., Andy Sapta., 2017. Pemetaan Siswa
Berprestasi Menggunakan Metode K-Means
Clustering. Jurteksi (Jurnal Teknologi Dan Sistem
Informasi)
Muhammad Ikbal., Septi Andryana., Ratih Titi Komala
Sari., 2021. Visualisasi Dan Analisa Data Penyebaran
Covid-19 Dengan Metode Klasifikasi Naïve Bayes.
Jurnal Teknologi Informasi Dan Komunikasi
Nayuni Dwitri., Jose A Tampubolon., Sandi Prayoga.,
Fikrul Ilmi R.H Zer., Dedy Hartama., 2020. Penerapan
Algoritma K-Means Dalam Menentukan Tingkat
Penyebaran Pandemi Covid-19 Di Indonesia. Jurnal
Teknologi Informasi.
Windha Mega Pradnya Dhuhita. 2015. Clustering
Menggunakan Metode K-Means Untuk Menentukan
Status Gizi Balita. Jurnal Informatika
iCAST-ES 2021 - International Conference on Applied Science and Technology on Engineering Science
1116
