
The Utilization Fly Ash as Material Substituon for Filler Asphalt
Concrete Wearing Coarse (AC-WC) Mixed with Percentage Refusal
Density (PRD) Method
Archenita, Marzah, Liliwarti and Aqilah
Civil Engineering Department, Padang State Polytechnic, PNP Padang, Indonesia
Keywords: Asphalt Concrete Wearing Coarse (AC-WC), Filler, Fly Ash, Marshall Method, Optimum Asphalt Content
(OAC), Percentage Refusal Density (PRD) Method.
Abstract: Asphalt Concrete Wearing Coarse (AC-WC) consists of asphalt and aggregate mixed, that largest composition
is aggregate (90% from the total weight of mixture). The availability of mixed-forming materials is very
important in ensuring smooth implementation in the field, apart from the quality of the material. In some
areas, the availability of filler is considered quite difficult because the filler usually comes from rock ash, so
it takes a replacement material that has the same specifications as the filler from rock ash. The possible
material is fly ash which is waste in coal mines and has not been utilized to the fullest. This research will
analyze the performance of AC-WC coarse that make use of filler substitution material using fly ash with
variation FA-0%, FA-5%, and FA-10%. The samples made by Marshall Method will give the Optimum
Asphalt Content (OAC) value on each mix variation. While the performance of these AC-WC mixtures on
secondary compaction by traffic was carried out using the Percentage Refusal Density (PRD) Method. The
analysis result shows that the OAC value at 0% fly ash variation is 5.95%, at 5% fly ash variation is 6.25%,
and at 10% fly ash variation is 6.32%. While the performance of AC-WC mixture indicated by the PRD value
meets the specifications, namely the PRD test gives a minimum VIM value of 2%. Based on the results of the
study, it can be seen that with the addition of fly ash there is an increase in the asphalt content used but the
increasing is not too big. So the fly ash can recomended to use as substitution filler on AC-WC mixture.
1 INTRODUCTION
Asphalt Concrete Wearing Coarse (AC-WC) is one
type of coating on flexible pavement. Similar to other
flexible pavement layers, AC-WC is also composed
of a mixture of asphalt and aggregate. As a material
with the largest percentage amount (about 90% -
95%), aggregate is divided into coarse aggregate, fine
aggregate, and filler. The quality of the material
forming the road pavement layer, AC-WC mixture, is
one of the determining factors for the performance of
road pavement layers (AASHTO, 1993), especially
the aggregate, considering that the percentage of
aggregate in the pavement mixture can reach 75-85%
of the total volume of the mixture or around 90% of
the total weight of the mixture. In addition to material
quality, the availability of mixed-hforming materials
is also very important in ensuring smooth
implementation in the field. Filler is one part of the
aggregate and is quite difficult to obtain because
usually, the filler used comes from rock ash. In some
locations, the availability of such a filler is felt to be
very difficult, so it is necessary to replace material
that has the same specifications as the filler from the
rock ash. One possible material is fly ash. Fly ash is a
waste material in coal mines, the availability of which
is quite a lot and has not been utilized and is found in
the West Sumatra area, precisely in the Sijantang
area, Sijunjung Regency.
The performance of the AC-WC layer using filler
material substitution using fly ash with variations in
the substitution of 0% fly ash (FA-0%) or without fly
ash, 5% fly ash (FA-5%), and 10% fly ash (FA-10%)
will be known in this research. This percentage will
be mixed later in the asphalt mixture (test object) at a
temperature of 150oC. This specimen is compacted in
a mold measuring 152-153 mm (6 inches) by
Marshall compaction 2x75 impact. Furthermore, to
see the performance of this AC-WC layer after the
mixture was secondarily compacted by traffic during
the design life, without undergoing any plastic
Archenita, ., Marzah, ., Liliwarti, . and Aqilah, .
The Utilization Fly Ash as Material Substituon for Filler Asphalt Concrete Wearing Coarse (AC-WC) Mixed with Percentage Refusal Density (PRD) Method.
DOI: 10.5220/0010960200003260
In Proceedings of the 4th International Conference on Applied Science and Technology on Engineering Science (iCAST-ES 2021), pages 1103-1111
ISBN: 978-989-758-615-6; ISSN: 2975-8246
Copyright
c
2023 by SCITEPRESS – Science and Technology Publications, Lda. Under CC license (CC BY-NC-ND 4.0)
1103

deformation, a test was carried out using a field
condition approach using the Percentage Refusal
Density (PRD) Method. In the PRD method,
compaction of the mixture is carried out manually
with a number of 2x400 collisions, which is
equivalent to compaction using an electric vibrating
compactor (BS 598 Part 104 1989). The test object
used is a test object with asphalt content which gives
a Marshall VIM value of 6% (VIM6%), and 0.5%
above and below the asphalt content. While the
asphalt used is asphalt PEN 60/70 that produced by
Pertamina.
2 RESEARCH METHOD
The research was carried out in two laboratories, the
material testing laboratory Civil Engineering
Department-Padang State Polytechnic and the road
laboratory of Public Work Department. The material
for forming the AC-WC mixture is aggregate
obtained from the quarry in the Padang area, while fly
ash as a filler replacement material is obtained from
the Sijantang area, Sijunjung Regency. Another
material that also forms the AC-WC mixture, namely
asphalt, is used from Pertamina's production with
PEN 60/70 specification.
2.1 The Aggregate Properties Testing
This test is carried out in the Material Testing
Laboratory of Civil Department - Padang State
Polytechnic. The aggregates referred to here whose
properties are tested are coarse aggregate, fine
aggregate, and filler including fly ash. The properties
testing of aggregates consists of:
‒ Specific gravity and absorption of coarse
aggregate, fine aggregate, filler and fly ash.
‒ Aggregate Impact Value (coarse aggregate)
‒ Aggregate Crushing Value (coarse aggregate)
‒ Aggregate Abrasion Value By Los Angeles
Machine
‒ Flakiness And Elongation Index
‒ Soundness Test By Sodium Sulfat/
Magnesium Sulfat
Specification of coarse aggregate and fine
aggregate according to 2018 specifications are shown
in Table 1 and Table 2.
Table 1: Coarse Aggregate Specification.
Testing Method Value
Soundness by natrium
sulfat/magnesium sulfat
solven
t
SNI 3407: 2008
Max 12%
/ max 18%
Abrasion by Los Angeles
Machine
SNI 2417: 2008 Max 40%
Aggregate adhesiveness
to asphal
t
SNI 2439: 2011 Min 95%
Aggregate rupture field SNI 7619: 2012 95/90
**
Flakiness and Elongation
particles
ASTM D4791-1 0
Ratio 1:5
Max 10%
Material passes sieve
No.200
SNI ASTM C117:
2012
Max 1%
**
95/90 indicates that indicates that 95% of the coarse aggregate has a fracture area of
1 or more and 90% of the coarse aggregate has a fracture area of 2 or more
Source : General Specifications 2018
Table 2: Fine Aggregate Specification.
Testing Method Value
Sand equivalent value SNI 03-4428-1997 Min 50%
Void level test without
campaction
SNI 03-6877-2002 Min 45
Lump of clay and fragile
grains in the aggregate
SNI 03-4141-1996 Max 1%
Aggregate passes sieve
No.200
SNI ASTM C117:
2012
Max 10%
Source : General Specifications 2018
2.2 The Asphalt Properties Testing
This test is carried out in the Road Testing Laboratory
of Public Work Department. The properties testing of
asphalt consists of:
‒ Specific gravity of Asphalt
‒ Penetration Test
‒ Ductility Test
‒ Softening Point Test
‒ Flashing And Burning Point Test
‒ Weight Loss Test
‒ Viscosity Test
‒ Stripping Test
Specification of asphalt are shown in Table 3.
Table 3: asphalt Specification.
Testing Method Value
Penetration at 25
0
C (0.1 mm) SNI 2456: 2011 60 - 70
Kinematic Viscosity 135
0
C (cSt) ASTM D2170-10 ≥ 300
Softening Point (
0
C) SNI 2434 : 2011 ≥ 48
Ductility at 25
0
C , (cm) SNI 2432 : 2011 ≥ 100
Flash Point (
0
C) SNI 2433 : 2011 ≥ 232
Solubility in Trichloroethylene (%) AASHTO T44-14 ≥ 99
Specific Gravity SNI 2441 : 2011 ≥ 1
Source : General Specifications 2018
iCAST-ES 2021 - International Conference on Applied Science and Technology on Engineering Science
1104
2.3 Mixture Design
The mixtures make by Marshall Method. The
procedure design of this method is:
‒ Determine gradation, based on specifications
of Bina Marga 2018. Mix design has taken into
account the substitution of fly ash as a filler.
The gradation used is shown in Table 4 and
Figure 1.
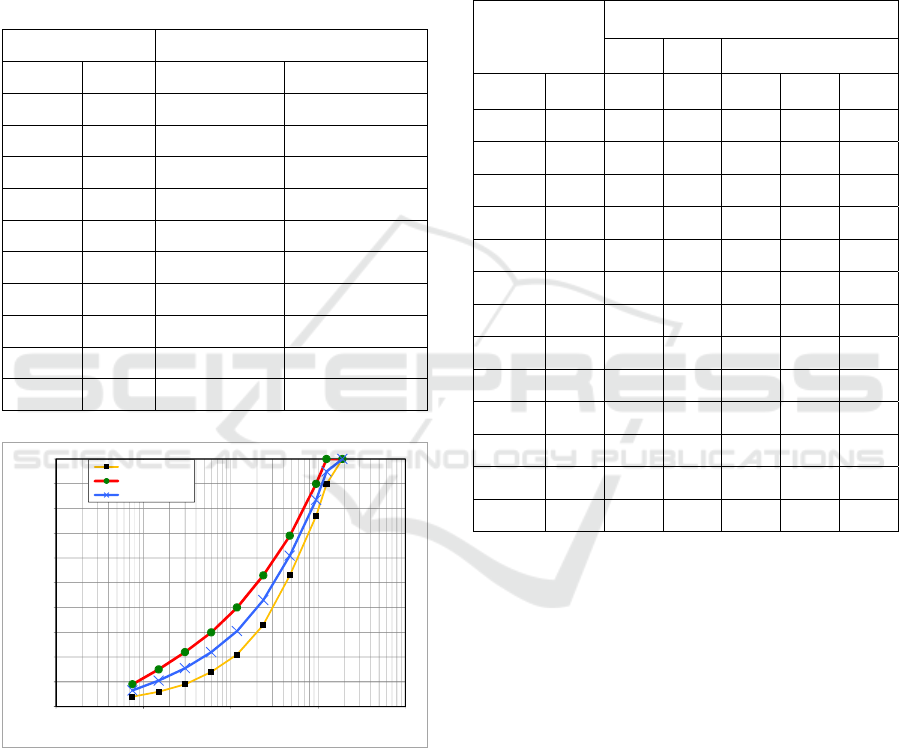
Table 4: Gradation of asphalt concrete wearing coarse.
Sieve Size % of Weight Passed
ASTM Mm
Specification Gradation Design
¾” 19 100 100
½” 12.5 90 – 100 95
3/8” 9.5 77 – 90 83.5
No.4 4.75 53 – 69 61
No.8 2.36 33 – 53 43
No.16 1.18 21 – 40 30.5
No.30 0.600 14 – 30 22
No.50 0.300 9 – 22 15.5
No.100 0.150 6 – 15 10.5
No.200 0.075 4 – 9 6.5
Source : General Specifications 2018
Figure 1: Asphalt Concrete-Wearing Coarse Mixture
Gradation Chart.
The modification of the AC-WC mixture with using
of fly ash as a filler so the composition of the mixture
gradation in Table IV becomes as in Table 5.
‒ Determine middle asphalt content as
approximate asphalt content. Middle asphalt
content depend on gradation of mixture, and
calculated by formula;
Pb = 0.035*%CA + 0.045*%FA + 0.18*%FF + K (1)
Where,
CA = coarse aggregate
FA = fine aggregate
FF = fine filler
K = constant, used 1
Table 5: Gradation of asphalt concrete-wearing coarse
mixture by substitution fly ash as filler.
Sieve Size
Asphalt Concrete-Wearing Coarse
Gradation with
%Pas
sed
%Bat
ed
Mixed Weight (gr)
ASTM mm
0%F
A
5%F
A
10%
FA
¾” 19 100 0 0 0 0
½” 12.5 95 5 60 60 60
3/8” 9.5 83.5 11.5 138 138 138
No.4 4.75 61 22.5 270 270 270
No.8 2.36 43 18 216 216 216
No.16 1.18 30.5 12.5 150 150 150
No.30 0.600 22 8.5 102 102 102
No.50 0.300 15.5 6.5 78 78 78
No.100 0.150 10.5 5 60 60 60
No.200 0.075 6.5 4 48 48 48
Filler 6.5 78 74.1 70.2
Fly ash 3.9 7.8
Total 1200 1200 1200
The middle asphalt content is the basis for
determining other asphalt content in the manufacture
of mixtures. Percentage of coarse aggregate is obtain
from the total percentage of aggregate retained up to
sieve No.4.75 (Table V) i.e 39%.
While the percentage of fine aggregate is obtained
from the percentage of aggregate that passes the
No.4.75 sieve and is retained by the No.200 sieve
(Table V) i.e 54.5%. Percentage of filler is 6.5%. The
asphalt content to be used in making of samples is Pb,
0.5% and 1% above, and also 0.5% and 1% below the
Pb value. So variation of asphalt content that used is
5 variation.
Make a sample of Marshall test with variation 0%
fly ash, 5% fly ash, and 10% fly ash as filler
substitution. Each sample is made with 5 variations of
asphalt content and for each asphalt content 3 samples
are made. So the number of samples for one variation
of the mixture is 15 pieces. With 3 mixed variations
0
10
20
30
40
50
60
70
80
90
100
0,01 0,1 1 10 100
the weight passes the sieve (%)
Aggregate Grain Size (mm)
Bottom limit
Top limit
Gradation design
The Utilization Fly Ash as Material Substituon for Filler Asphalt Concrete Wearing Coarse (AC-WC) Mixed with Percentage Refusal
Density (PRD) Method
1105

(0%FA, 5%FA, and 10%) then the total for all of
samples is 45 pieces.
2.4 Mixture Analysis
A mixed analysis is carried out after sample making
is complete. The analysis carried out on the Marshall
sample includes volumetric analysis and stability
analysis. A volumetric analysis will get the
dimensions and weight of the sample, density, VIM
(Void in Mix), VMA (Void in Mineral Aggregate),
and VFA/VFB (Void Filled Asphalt/Void Filled
Bitumen). Volumetric analysis calculations use the
formula;
• Bulk Specific Gravity of Combined Aggregate
n
n
n
sb
G
P
G
P
G
P
PPP
G
+++
+++
=
.....
.....
2
2
1
1
21
(2)
Where;
G
sb
= Total bulk specific gravity of
aggregate
P
1
,…,P
n
= Percentage of each aggregate
fraction
G
1
,…,G
n
= Bulk Specific Gravity of each
aggregate fraction
• Effective Specific Gravity of Combined
Aggregate
b
b
mm
b
se
G
P
G
P
G
−
−
=
100
100
(3)
Where;
G
se
= Total effective specific gravity of
aggregate
G
mm
= Mixed maximum specific
gravity, zero void (AASHTO T-
209.90)
P
b
= Asphalt content in percent of the
total weight of the mixture
G
b
= Asphalt specific gravity
• The theoretical maximum Specific Gravity of
asphalt mix
b
b
se
s
mm
G
P
G
P
G
+
=
100
(4)
Where;
P
s
= Aggregate content, percent of the
total weight of the mixture
• Void in Mineral Aggregate (VMA)
s
sb
mb
P
G
G
VMA
x−= 100
(5)
Where;
G
mb
= Bulk specific gravity of solid mix
• Void in Mix (VIM)
mm
mbmm
G
GG
VIM
−
=
(6)
• Void Filled Asphalt (VFA)
VMA
VIMVMA
VFA
x )(100 −
=
(7)
• Asphalt Absorption (P
ba
)
()
b
sbse
sbse
G
GG
GG
P x
x
x
ba
)(100 −
=
(8)
Where;
P
ba
= Asphalt absorption, percent of
total aggregate
• Effective Asphalt Content (P
be
)
s
ba
bbe P
P
PP x
100
−=
(9)
Where;
P
be
= Effective Asphalt content,
percent of total mix
While at the stability analysis will get the value of
stability and flow of the mixture. Both analysis will
give the optimum asphalt content value. The analysis
was carried out using a graph of the relationship
between asphalt content with VIM, VMA, VFA,
Stability, Flow, and MQ.
2.5 Percentage Refusal Density (PRD)
Method
Percentage Refusal Density (PRD) is a ratio of
laboratory test density to refusal density in percent.
Absolute density is an approximation to field
conditions after the asphalt mixture has been
secondarily compacted by traffic for several years of
the design life, without undergoing any plastic
deformation. Procedure test of PRD method is;
iCAST-ES 2021 - International Conference on Applied Science and Technology on Engineering Science
1106

‒ Mixture Design; PRD test samples were made
with mixed variations of 0% fly ash, 5% fly
ash, and 10% fly ash, as filler substitution.
Asphalt content used in the manufacture of
samples is asphalt content at 6% VIM
conditions. The other two percentages of
asphalt content that will be used in making the
sample are 0.5% above and 0.5% below of the
asphalt content value at the 6% VIM
condition. PRD sample compaction was
carried out manually with a total of 400
collisions on both sides of the sample used a
4-inch diameter mold.
‒ Mixture Analysis; The point analyzed in the
PRD test is the VIM value, which is known as
the VIM refusal. Refusal VIM value according
to 2018 specification is a minimum 2%.
3 RESULT AND DISCUSSION
The test results on the material forming the AC-WC
mixture i.e. aggregate properties test and asphalt
properties test show on Table 6 and Table 7. The
tables show that the results of testing the properties of
aggregate and asphalt generally meet the
specifications. therefore these materials can be used
for the manufacture of the AC-WC mixtures.
Table 6: The result of aggregate properties test.
No.
Aggregate
Characteristics
The Test
Result
Specification
A. Coarse Aggregate
1.
Bulk specific gr
avity
2.68
Min 2.5
Surface Saturated
Dry (SSD) specific
gravity
2.60
Apparent specific
gravity
2.72
Min 2.5
Effective specific
gravity
2.70
2.
Soundness by
natrium
sulfat/magnesium
sulfat solven
t
3.
Abrasion by Los
Angeles Machine
33.36% Max 40%
4.
Aggregate
adhesiveness to
asphal
t
5.
Aggregate rupture
field
6.
Flakiness and
Elongation particles
7.
Material passes
sieve No.200
No.
Aggregate
Characteristics
The Test
Result
Specification
B. Fine Aggregate
1. Bulk specific gravity 2.66
Min 2.5
Surface Saturated Dry
(SSD) specific gravity
2.60
Apparent specific
gravity
2.70
Effective specific
gravity
2.68
2. Absorption 2.37% < 3%
3. Sand equivalent value
C. Filler
1.
Specific gravity of
stone ash
2.5
Min 2.5
2.
Specific gravity of fly
ash
2.4
Table 7: The result of asphalt properties test.
No.
Asphalt
Characteristics
The Test
Result
Specification
1.
Penetration at 25
0
C
(0.1 mm)
67.3 60 - 70
2.
Kinematic Viscosity
135
0
C (cSt)
463 ≥ 300
3. Softening Point (
0
C) 55.5 ≥ 48
4. Ductility at 25
0
C , (cm) 142 ≥ 100
5. Flash Point (
0
C) 320 ≥ 232
6.
Solubility in
Trichloroethylene (%)
92.723 ≥ 99
7. Specific Garvity 1.047 ≥ 1
The result of kinematic viscosity shows on Table
8 whereas the Saybolt Furol graph shows on Fig.2.
Table 8: The result of kinematic viscosity test.
Temperature (
0
C) Waktu Alir (detik) Sentistokes (cSt)
120 326 656
140 158 338
160 72 150
Figure 2: Saybolt Furol Graph.
10
100
1000
110 120 130 140 150 160 170 180 190
Viskositas Kinematik (Cst)
Temperatur (
O
C)
Relationship Temperature - Viscosity
Mixing
Compaction
280
170
144
158
The Utilization Fly Ash as Material Substituon for Filler Asphalt Concrete Wearing Coarse (AC-WC) Mixed with Percentage Refusal
Density (PRD) Method
1107
The kinematic viscosity value is used to obtain the
mixing temperature and compaction temperature. The
result of kinematic viscosity is plotted on the Saybolt
Furol graph so that the mixing temperature and
compaction temperature are obtained.
Based on the Saybolt Furol graph shows that the
mixing temperature is 158
0
C and the compaction
temperature is 144
0
C.
3.1 Mixture Analysis by Marshall
Method
By using equation (1) obtained the value of the
middle asphalt content is 6%. Thus the asphalt
content used in making the sample is 5%, 5.5%, 6%,
6.5%, and 7%. Volumetric analysis on the Marshall
Method will produce VIM, VMA, VFA values using
equation (2) until (9). The results of calculations
using these equations are shown in Table 9.
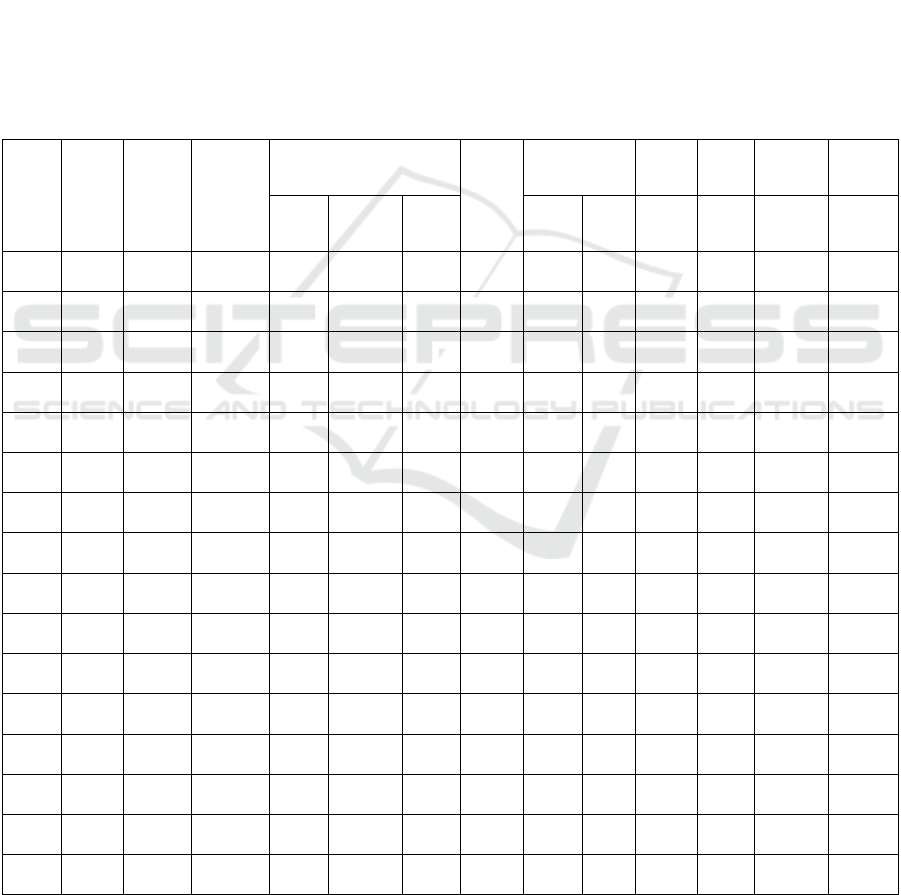
Table 9: Test results marshall Asphalt Concrete-Wearing Coarse mixture without fly ash.
Bulk Specific Gravity of Aggregate
(Gsb)
= 2.655
Effective Specific Gravity of
Aggregate (Gse)
= 2.729
Specific Gravity of Asphalt (Gb)
= 1.047
Sample
Code
Sample
Height
Asphlat
Content
(Pb)
Aggregate
Content
(Pb)
Sample Weight
Sample
Volume
Specific Gravity
of Mix
Density
Void in
Mix
Void in
Mineral
Aggregate
Void
Filled
Asphalt
Dry
Saturated
Surface
Dry (SSD)
In
water
Bulk
G
mb
Max
G
mm
3 – 5 ≥ 15 ≥ 65
mm % % gram gram gram cc % % %
A-1 67.41 5 95 1240.1 1243.7 707.5 536.2 2.313 2.526 2.313 8.45 17.24 50.96
A-2 65.43 5 95 1248.3 1248.9 723.2 525.7 2.375 2.526 2.375 6.01 15.03 60.02
A-3 66.15 5 95 1236.3 1242.6 711.8 530.8 2.329 2.526 2.329 7.80 16.65 53.13
B-1 67.33 5.5 94.5 1250.3 1252.0 723.1 528.9 2.364 2.508 2.364 5.73 15.85 63.84
B-2 68.10 5.5 94.5 1254.4 1256.3 721.9 534.4 2.347 2.508 2.347 6.39 16.44 61.11
B-3 66.50 5.5 94.5 1246.0 1246.4 723.5 522.9 2.383 2.508 2.383 4.98 15.18 67.21
C-1 68.98 6 94 1259.2 1261.3 723.3 538.0 2.341 2.489 2.341 5.98 17.12 65.10
C-2 65.66 6 94 1249.4 1249.5 727.8 521.7 2.395 2.489 2.395 3.79 15.20 75.04
C-3 67.34 6 94 1254.9 1255.6 723.5 532.1 2.358 2.489 2.358 5.26 16.49 68.11
D-1 66.08 6.5 93.5 1254.4 1255.0 726.8 528.2 2.375 2.471 2.375 3.90 16.36 76.17
D-2 67.84 6.5 93.5 1263.6 1264.0 729.0 535.0 2.362 2.471 2.362 4.42 16.81 73.69
D-3 66.25 6.5 93.5 1261.6 1261.2 732.5 528.7 2.386 2.471 2.386 3.44 15.96 78.45
E-1 67.67 7 93 1254.5 1255.2 725.7 529.5 2.369 2.453 2.369 3.43 17.00 79.83
E-2 67.93 7 93 126.05 1265.9 728.9 537.0 2.356 2.453 2.356 3.98 17.48 77.22
E-3 66.40 7 93 1261.6 1261.9 728.3 533.6 2.364 2.453 2.364 3.63 17.17 78.87
iCAST-ES 2021 - International Conference on Applied Science and Technology on Engineering Science
1108
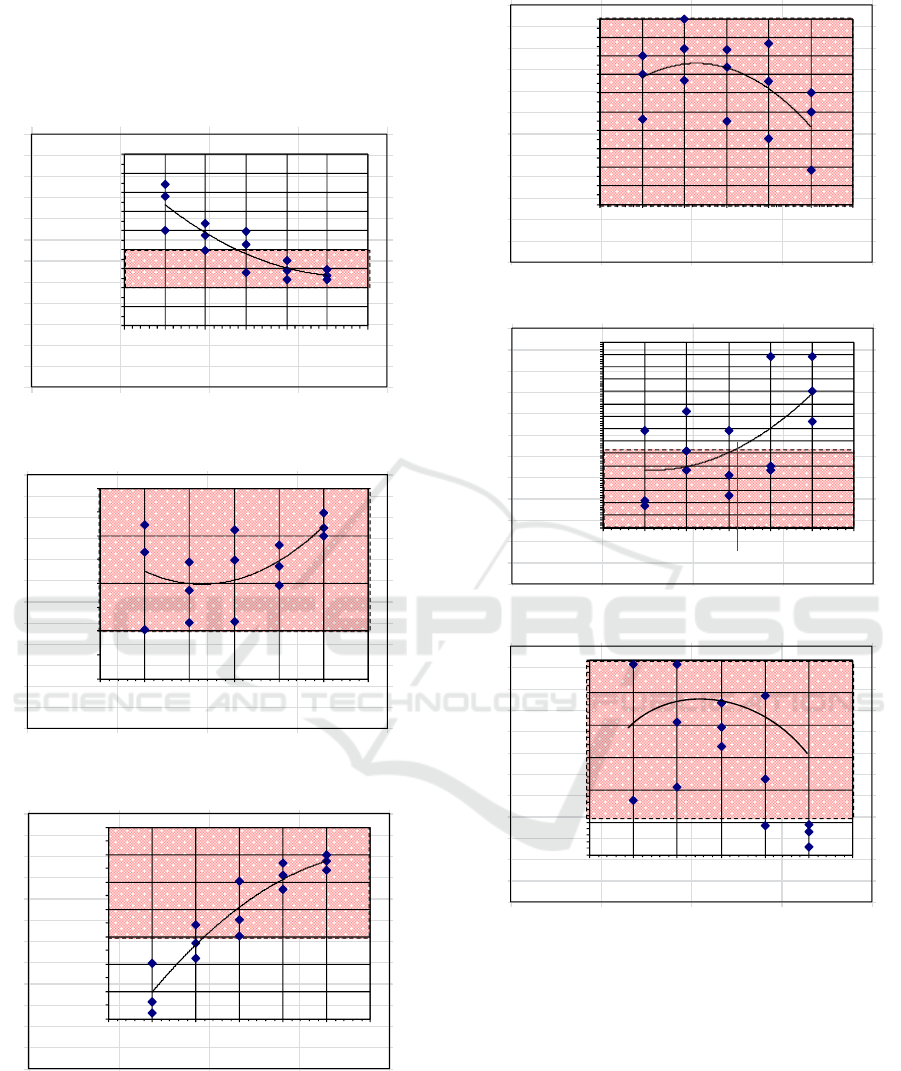
The results of the Marshall test on the AC-WC
mixture shown in Table IX, were analyzed
graphically the asphalt content for the value of VIM,
VMA, VFA, Stability, and flowas shown in Fig.3
until Fig.8.
Figure 3: Graphic Analysis Asphalt Content – Void in
Mix.
Figure 4: Graphic Analysis Asphalt Content – Void in
Mineral Aggregate.
Figure 5: Graphic Analysis Asphalt Content – Void in
Filled Asphalt.
Figure 6: Graphic Analysis Asphalt Content – Stability.
Figure 7: Graphic Analysis Asphalt Content – Flow.
Figure 8: Graphic Analysis Asphalt Content – Marshall
Question.
Based on the graph, it can be seen that the asphalt
content range meets the specifications (shaded part).
The optimum asphalt content is obtained by taking
the median value of the asphalt content range that
meets all specifications that show in Fig.9.
1,00
2,00
3,00
4,00
5,00
6,00
7,00
8,00
9,00
10,00
4,50 5,00 5,50 6,00 6,50 7,00 7,50
V I M (%)
Asphalt Content (%)
14,00
15,00
16,00
17,00
18,00
4,50 5,00 5,50 6,00 6,50 7,00 7,50
V M A (%)
Asphalt Content (%)
50,00
55,00
60,00
65,00
70,00
75,00
80,00
85,00
4,50 5,00 5,50 6,00 6,50 7,00 7,50
V F A (%)
Asphalt Content (%)
800,00
900,00
1000,00
1100,00
1200,00
1300,00
1400,00
1500,00
1600,00
1700,00
1800,00
4,50 5,00 5,50 6,00 6,50 7,00 7,50
Stability (kg)
Asphalt Content (%)
2,50
2,75
3,00
3,25
3,50
3,75
4,00
4,25
4,50
4,75
5,00
5,25
5,50
5,75
6,00
6,25
4,50 5,00 5,50 6,00 6,50 7,00 7,50
Flow (mm)
Asphalt Content (%)
200,00
250,00
300,00
350,00
400,00
450,00
500,00
4,50 5,00 5,50 6,00 6,50 7,00 7,50
M Q ( kg/ mm)
Asphalt Content (%)
The Utilization Fly Ash as Material Substituon for Filler Asphalt Concrete Wearing Coarse (AC-WC) Mixed with Percentage Refusal
Density (PRD) Method
1109

Figure 9: Graphical Analysis for Optimum Asphalt
Content value on Asphalt Concrete-Wearing Coarse
mixture 0% fly ash.
In the same way, calculations and analyzes were
also carried out for the AC-WC mixture with the
substitution of 5% and 10% fly ash as filler. So the
Optimum Asphalt Content (OAC) on the AC-WC
mixture with 5% fly ash is 6.25%, while for the AC-
WC mixture with 10% fly ash is 6.32%.
Based on this results show that the addition of fly
ash substitution will increase the value of the
optimum asphalt content.
3.2 Mixture Analysis by Percentage
Refusal Density Method
The PRD samples were made with asphalt content at
6% VIM conditions obtained on the chart of
Marshall analysis results, which are shown in
Fig. 10.
Figure 10: The marshall analysis chart to determine the
middle asphalt content of the PRD sample on Asphalt
Concrete-Wearing Coarse mixture 0% fly ash.
In the same way is also done for the AC-WC
mixture with the substitution of 5% and 10% fly ash
as filler. Thus the value of PRD Asphalt content in
the AC-WC mixture with 5% fly ash is 5.35%, while
for the AC-WC mixture with 10% fly ash it is 5.4%.
The tests carried out on the PRD samples were
only volumetric tests/analyses, which are shown in
Table 10.
Table 10: the test percentage refusal density (prd) results on Asphalt Concrete-Wearing Coarse mixture without fly ash.
Bulk Specific Gravity of Aggregate
(Gsb)
= 2.655
Effective Specific Gravity of
Aggregate (Gse)
= 2.729
Specific Gravity of Asphalt (Gb)
= 1.047
Sample
Code
Sample
Height
Asphlat
Content
(Pb)
Aggregate
Content
(Pb)
Sample Weight
Sample
Volume
Specific Gravity
of Mix
Density
Void in
Mix
Void in
Mineral
Aggregate
Void
Filled
Asphalt
Dry
Saturated
Surface
Dry (SSD)
In
water
Bulk
G
mb
Max
G
mm
Min 2
mm % % gram gram gram cc % % %
A-1 67.17 5.5 94.5 1234.2 1235.8 713.7 522.1 2.364 2.526 2.364 6.43 15.41 58.28
A-2 65.63 5 95 1241.3 1243.1 724.1 519.0 2.392 2.508 2.392 4.62 14.86 68.89
A-3 65.13 6 94 1241.0 1241.9 724.4 517.5 2.398 2.489 2.398 3.66 15.09 75.70
The Ma r shall OA C
V
oid In Mix
V
oid in M inera l A
gg
re
g
ate
V
oid Filled A s
p
hal
t
St abilit
y
Ke lele han
Marshall
Q
uotien
t
7,05,0 5,5 6,0 6,5
=
5,95
5,80 6,10
1,00
2,00
3,00
4,00
5,00
6,00
7,00
8,00
9,00
10,00
4,50 5,00 5,50 6,00 6,50 7,00 7,50
V I M (%)
Asphalt Content (%)
iCAST-ES 2021 - International Conference on Applied Science and Technology on Engineering Science
1110
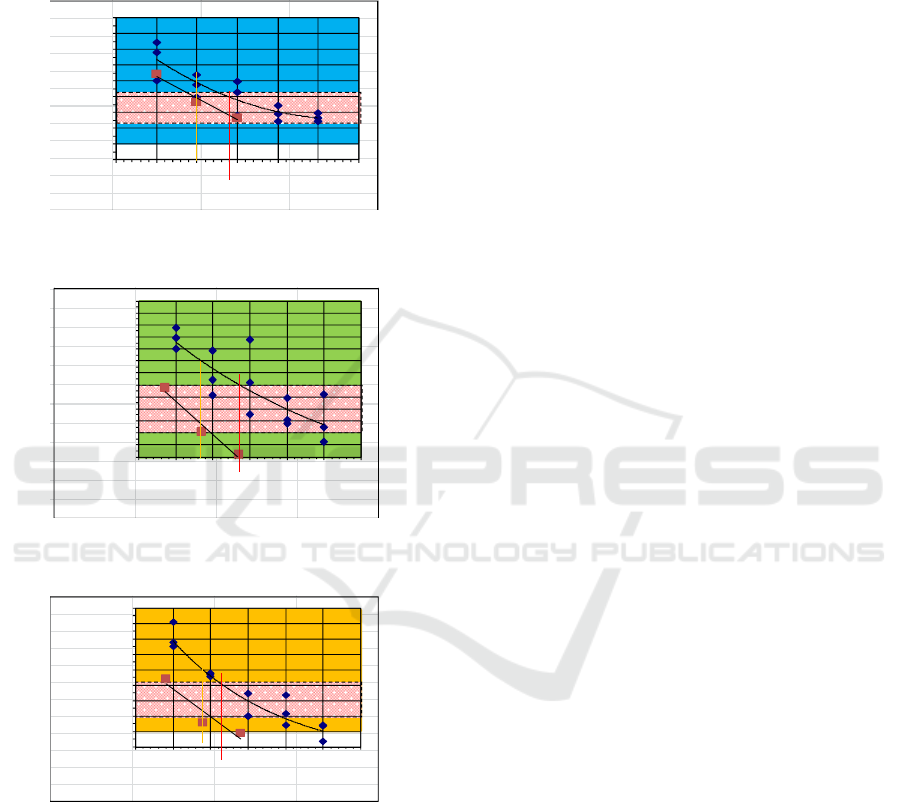
The Void in Mix (VIM) values are plotted on the
Marshall analysis VIM graph so that a refusal VIM
graph is obtained, that shows on Fig.11 for AC-WC
mixture without fly ash (0% FA), Fig.12 for AC-WC
mixture with 5% fly ash (5% FA), Fig.13 for AC-WC
mixture with 10% fly ash (10% FA).
Figure 11: Void In Mix (VIM) refusal on Asphalt Concrete-
Wearing Coarse mixture 0% fly ash.
Figure 12: Void In Mix (VIM) refusal on Asphalt Concrete-
Wearing Coarse mixture 5% fly ash.
Figure 13: Void In Mix (VIM) refusal on Asphalt Concrete-
Wearing Coarse mixture 10% fly ash.
Based on graphical analysis for the refusal VIM
value in all variations of the AC-WC mixture (Fig.11
until Fig.13), it meets the required value of at least 2%.
4 CONCLUSION
According to the result of the utilization fly ash as
material substitution for filler in Asphalt Concrete-
Wearing Course (AC-WC) mixed with Percentage
refusal density (PRD) method can conclude that: The
Optimum Asphalt Content (OAC) increases with the
increase in the percentage of use of fly ash as a filler
substitution and the voids found in all variations of
the AC-WC mixture meet the required specifications
(Percentage Refusal Density Method test result). The
increase in OAC value due to filler substitution in the
mixture is not too large, so use of fly ash as a filler
substitution in the AC-WC mixture is recommended.
ACKNOWLEDGEMENTS
This reseach are fully funded by DIPA Politeknik
Negeri Padang.
REFERENCES
AASHTO, “Standart Specifications for Transportation
Materials and Methods of Sampling and Testing,”, Part
II Tests, 1998, pp. 52-204.
ASTM, “Test Method for Indirect Tension Test for
Resilient Modulus for Bituminous Mixtures,”, D 4123-
82 (1995), Annual Books of ASTM Standards, 1997.
Daniyanto, E., "Pengaruh Campuran Fly Ash Terhadap
Laston Perkerasan Jalan," 2019. https://riset.unisma.
ac.id/index.php/ft/article/download/1776/1673.pdf
Gunawan, G. and Nono, “Potensi Pemanfaatan Bahan
Limbah Fly Ash Dan Bottom Ash Untuk Lapisan
Fondasi Jalan Semen [Journal],” 2017, accessed via
http://repository.its.ac.id/2952/7/3115040616-Undergr
aduate-Theses.pdf.
Kartikasari, D., and Hartantyo, S.D., "Penggantian Filler
Dengan Fly Ash Dan Serbuk Batu Bata Pada Campuran
Aspal (AC-WC)," UkaRsT VOL.1, NO.1 TAHUN
2017 ; p ISSN 2579-4620 ; e ISSN 2581-0855.
Kementerian Pekerjaan Umum dan Perumahan Rakyat,
"Spesifikasi Umum 2018 Untuk Pekerjaan Konstruksi
Jalan dan Jembatan," Seksi 6.4, 2018.
Munir, Misbachul, "Pemanfaatan Abu Batubara untuk
Hollow Block yang Bermutu dan Aman Bagi
Lingkungan," Program Studi Ilmu Lingkungan,
Program Pascasarjana, Universitas Diponegoro,
Semarang, Indonesia, 2008.
SNI No. : 06-2489-1991, "Metoda Marshall," 1991.
The Asphalt Institute, "Principles of Construction of Hot
Mix Asphalt Pavements," Manual Series No.22, The
Asphalt Institute, 1983, pp 9-83.
Yuri, Novebrian, "Pengaruh Penambahan Abu Batubara
(Fly Ash Dan Bottom Ash) Terhadap Karakteristik
Aspal Penetrasi 60/70," [Skripsi] Universitas Andalas
Padang accessed via http://scholar.unand.ac.id/12592/
1,00
2,00
3,00
4,00
5,00
6,00
7,00
8,00
9,00
10,00
4,50 5,00 5,50 6,00 6,50 7,00 7,50
V I M (%)
Asphalt Content (%)
2,00
2,50
3,00
3,50
4,00
4,50
5,00
5,50
6,00
6,50
7,00
7,50
8,00
8,50
4,50 5,00 5,50 6,00 6,50 7,00 7,50
V I M (%)
Kadar aspal (%)
1,00
2,00
3,00
4,00
5,00
6,00
7,00
8,00
9,00
10,00
4,50 5,00 5,50 6,00 6,50 7,00 7,50
V I M (%)
Kadar aspal (%)
The Utilization Fly Ash as Material Substituon for Filler Asphalt Concrete Wearing Coarse (AC-WC) Mixed with Percentage Refusal
Density (PRD) Method
1111
