
Dynamic Web Workload Distribution Test from 0 Rps to 1000 Rps on
Cluster-based Web Server System with Locality-based
Least Connection Algorithm
Nongki Angsar, Maria D. Badjowawo and Marthen Dangu Elu Beily
Electrical Engineering Department, State Polytechnic of Kupang, Kupang, Indonesia
Keywords:
Distribution Test, Web Server, Cluster.
Abstract: The growth of web traffic and network bandwidth which is quicker than the growth of microprocessor these
days cause single server platform no longer be adequate to fulfill the requirement of web server system
scalability. Plural server platform is the answer. One of solutions which have been recognized is cluster-based
web server system. This research did some dynamic web workload distribution tests on a cluster-based web
server system by generating HTTP workloads dynamicly, with continuous changing HTTP request rate from
0 request per second (rps) to 1000 rps, from client to web server system pool. In this research, result of
dynamicly testing with continuous changing HTTP request rate from 0 rps to 1000 rps shows that HTTP
requests were well-distributed to web server system pool by Locality-Based Least Connection Algorithm.
HTTP reply rate, TCP connection rate, and throughput tend to increase linearly with the increase in HTTP
request rate. While response time and error almost equal to zero with the increase of HTTP request rate.
Correlation between linearity and the zero of error is, at the point 0 rps to 1000 rps, almost all of HTTP
requests were replied by the pool of servers.
1 INTRODUCTION
Along with the complexity of web service and
application in so many areas, hence web service
request from user become progressively high.
Example of popular web services and applications are
business service and application (e-business),
education (e-learning), news (e-news), and others.
Also with the growth of network infrastructure
and computer communication become progressively
good in recent years. Application of optical fibre on
cables (Roger, 1998), Gigabit Ethernet on LAN
(William, 2000), broadband- ISDN on WAN
(William, 2000), xDSL digital transmission on
telephone line (William, 2000), and cable modem
make network bandwidth become bigger. Even a
prediction which is
made by George Gilder in 1995
said that the growth of network bandwidth will be
multiply thrice every year (Gray, 2000). This
prediction still go into effect, special for the optical
fibre, refers to article made in 2008 (Gilder, 2008).
On the other side, computer growth (sum of
transistors in a microprocessor chip), according to the
prediction of Intel founder, Gordon Moore in 1960
will only be multiply twice every 18 months (Intel,
2003). This
prediction have been proven through years untill now,
and usually referred as Moore’s Law.
According to these two predictions, the network
bandwidth growth will be multiply twice than
computer growth, and the possible bottle-neck will
lay in server side.
2 LITERATURE REVIEW
According to Cardellini et al (Valeria, 2001), there
are two efforts which can be done: (1) scale-up effort
(single
platform server and (2) scale-out effort
(plural
platform server). First effort is good enough,
however having some weakness. First, requiring big
expense
to keep pace with recent technology. Second,
can not
eliminate the fact that single point of failure
(SPOF) is on server itself. Third, availability and
continuity will be disturbed at the time of server
scalability improvement. Fourth, replacement to new
hardware
cause old hardware tends to be useless in
system.
While second effort, on the contrary, cheaper
Angsar, N., Badjowawo, M. and Beily, M.
Dynamic Web Workload Distribution Test from 0 Rps to 1000 Rps on Cluster-based Web Server System with Locality-based Least Connection Algorithm.
DOI: 10.5220/0010958700003260
In Proceedings of the 4th International Conference on Applied Science and Technology on Engineering Science (iCAST-ES 2021), pages 1049-1053
ISBN: 978-989-758-615-6; ISSN: 2975-8246
Copyright
c
2023 by SCITEPRESS – Science and Technology Publications, Lda. Under CC license (CC BY-NC-ND 4.0)
1049
and do not own SPOF. One of the popular plural web
server system is cluster-based web server system.
3 BASIC THEORY
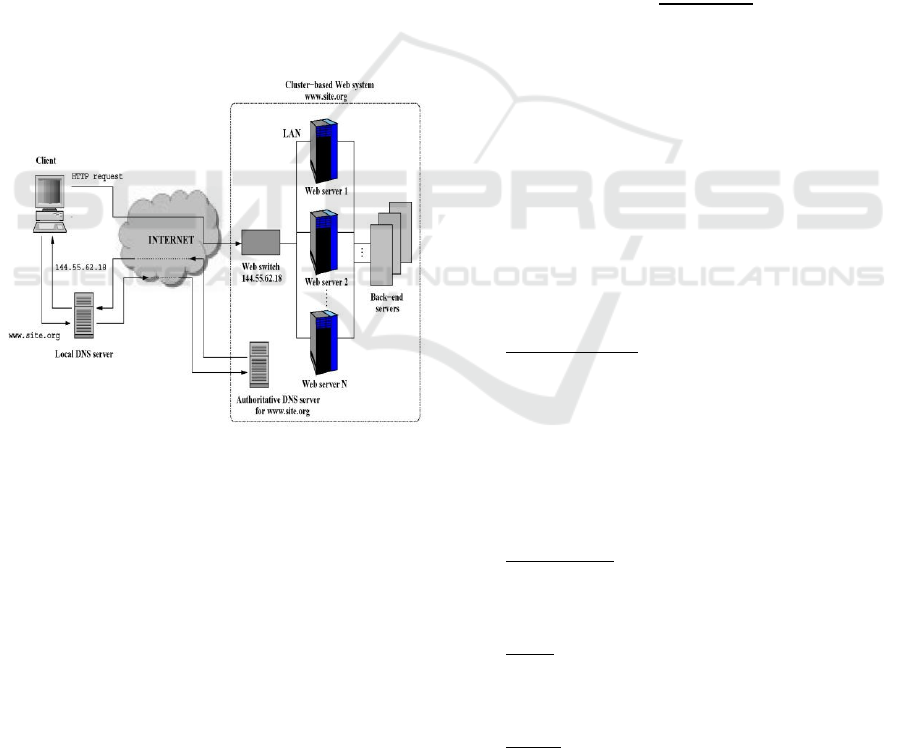
A cluster-based web server system is a set of
heterogeneous web server that work under
coordination of load balancer to serve HTTP request
from client. Web server cluster is visible from client
as one single system with one domain name and IP
address.
This system consist of (Valeria, 2001):
a.
Load Balancer, is a digital device which
intentionally be placed at 7
th
or 4
th
layer of
ISO/OSI to share workload among servers.
b.
Server Pool, is a cluster of real-servers which
doing real service, such as: web, ftp, e-mail.
c.
Back-end Server, is backside system which save
service data and content from server, such as:
database and NFS.
Figure 1: Cluster-based Web Server System
Architecture.
There are two main function of load balancer in
cluster-based web server system, those are: routing
function (which realized in routing mechanism) and
delivery function (which realized in dispatching
algorithm.
A.
Routing Mechanism
Routing mechanism functioning to package and
direct client request to a real-server. Routing
mechanism which is used in this paper is Network
Address Translation (NAT).
B.
Dispatching Algorithm
Dispatching algorithm functioning to choose a
real-
server to reply client request (Shivaratri, 1992).
Dispatching
algorithm which is used in this paper
is Locality- Based Least Connection Algorithm.
C.
Weight Determination
Weight determination influenced by web content
type provided by web server. If web content type is
static hence the weight will only be influenced by
storage media speed factor, P
m
. If web content type is
dynamic hence the weight will only be influenced by
processor speed factor, P
p
. If web content type is a
mix between static and dynamic, hence its formula
will become
𝑤=𝛼𝑃
+
1−𝛼
𝑃
(1)
𝛼
is a ratio which determine contribution of
𝑃
and
𝑃
to the weight
𝑤
𝛼=
(2)
with 𝑁
and 𝑁
are number of dynamic and static
web content access statistic.
4 RESEARCH METHODS
Methodology which is used in this paper covers
tools and materials, the way of research, system
design, and analysis.
A. Tools and Materials
Tools specification which are used in this paper are:
1. Load Balancer: Intel
®
Celeron
®
Dual-Core
N3060 1,6 GHz x 2, DDR3 SDRAM 2 GB, HD
Toshiba
®
SATA 500 GB x 1, NIC Realtek PCI
Fast Ethernet, Linux 4.8.6-300
2. Real-server 1: AMD
®
A4-1200 APU with
Radeon
®
HD Graphics 1GHz x 2, DDR3
SDRAM 2 GB, HD Seagate
®
Barracuda
®
ATA
500 GB x 1, NIC Realtek PCI Fast Ethernet,
Windows 8 Pro, Apache 2.2.25.
3. Real-server 2: AMD
®
Dual Core Processor C-50
1 GHz x 2, DDR3 SDRAM 2GB, HD Hitachi
®
ATA 320GB x 1, NIC Atheros Family PCI,
Windows 7 Ultimate, Apache 2.2.25.
4. Client: Intel
®
Celeron
®
M CPU 430 1,73 GHz,
DDR2 SDRAM Visipro
®
512 MB, HD Seagate
®
Barracuda
®
60 GB 5400 rpm x 1, NIC Broadcom
440x 10/100 Mbps, Linux 2.6.25-14
5. Switch: SMC
®
5-port 10/100Mbps Auto-MDIX
Switch - SMC-EZ6505TX (store-and-forward
transmission)
6. UTP cable (Cat 5) 15 meters.
iCAST-ES 2021 - International Conference on Applied Science and Technology on Engineering Science
1050
Materials which will be researched is the average
HTTP reply rate of cluster-based web server system
if HTTP request rate from client are dynamic.
B.
The Way of Research
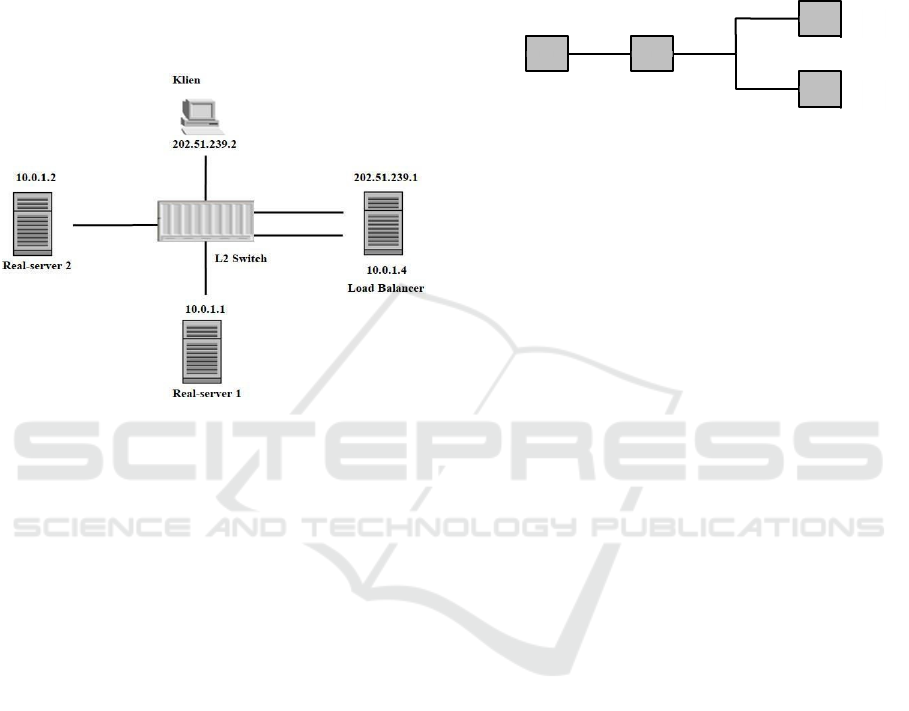
1. Hardware configuration.
In this research, there were only two real- servers
that being used, because it was hard to
find real-
servers with different specification in
laboratorium.
Real-servers with different
specification was more
suitable with real world
condition.
Figure 2: Hardware configuration.
2. Software configuration.
a.
Load Balancer (LB)
● Network interface configuration and masking
(NAT)
● Load Balancer software configuration
● Define dispatching algorithm
● Load Balancer to Real-server 1 and 2 Address
and Port Mapping
● Weight configuration
b.
Real-server
● Network interface configuration and web server
configuration on Real-server 1
● Network interface configuration and web server
configuration on Real-server 2
c.
Client
● Network interface configuration
● Web workload testing software
configuration on
client
3. Doing dynamic web workload distribution test
on cluster-based web server system. On this test,
HTTP request rate produced was as big as 0 rps
to 1.000 rps, and distributed to both real-server in
the cluster-based web server system with
Locality-Based Least Connection Algorithm.
The number 1,000 HTTP request per second was
achieved by trial and error mechanism. From trial
and error process, we got this number 1,000
HTTP request per second. At this number of
HTTP request rate, HTTP reply rate from server
began to stable or saturated, not fluctuated. By
the end of the test there will be a data recording.
C.
System Design
System which is designed in this paper is:
RS
Clie
LB
RS
Figure 3: Network of cluster-based web server system.
D.
Analysis
Web server system in this paper is evaluated
according to five test parameters, those are: HTTP
reply rate, response time, throughput, TCP
connection rate, and error. Those five test parameters
are tested for Locality-Based Least Connection
Algorithm. The test is done by producing HTTP
request rate from client dynamicly, and then record
HTTP reply rate, response time, throughput, TCP
connection rate and error between load balancer and
real-servers.
The data recording are presented in data table.
Presentation of those five parameters is done by
presenting text data recording of Locality-Based
Least Connection Algorithm result test. Then, there
will be a graphic chart consist of HTTP reply rate,
response time, throughput, TCP connection rate,
error, etc.
5 RESULTS AND DISCUSSION
After hardware and software configurations on
cluster-based web server system are finished, the next
step is dynamicly web workload distribution test
(with continuous changing HTTP request rate from 0
rps to 1000 rps).
A.
Results of Dynamic Web Workload Test
In this test, HTTP request rate which is produced is
0 rps to 989.6 HTTP request per second, then
distributed to real-server with Locality-Based Least
Connection Algorithm.
The data recording of Dynamic web workload test
results for Locality-Based Least Connection
Algorithm are:
Dynamic Web Workload Distribution Test from 0 Rps to 1000 Rps on Cluster-based Web Server System with Locality-based Least
Connection Algorithm
1051
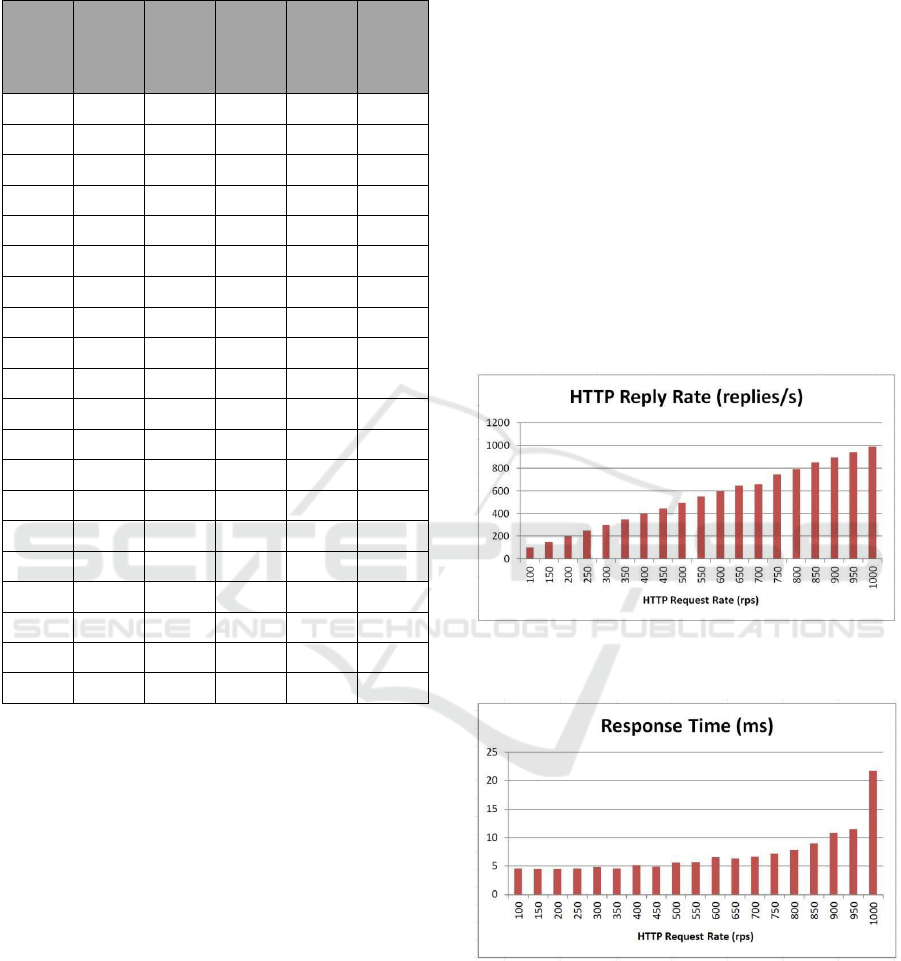
Table 1: Data Table Recorded for Dynamic Test
from 0
rps to 1000 rps with Locality-Based Least
Connection
Algorithm.
HTTP
request
rate
(rps)
HTTP
reply rate
(replie
s/s)
Response
Time
(ms)
Throug-
hput
(kBps)
TCP
Connec
-
tion Rate
(cps)
Errors
(err
or)
0 0 0 0 0 0
100 99.8 4.6 35.1 10 0.016
150 149.1 4.5 52.4 15 0.058
200 198.5 4.5 69.8 20 0.077
250 248.5 4.6 87.4 25 0.060
300 298.4 4.8 104.9 30 0.054
350 347.7 4.6 122.3 35 0.062
400 397.2 5.2 139.6 40 0.070
450 446.3 4.9 156.8 45 0.081
500 495.2 5.6 171 49.1 0.091
550 547.1 5.7 192.3 55 0.050
600 596.5 6.6 209.7 60 0.054
650 646.1 6.3 227.1 65 0.056
700 658.4 6.7 227.4 65.5 0.126
750 744.6 7.2 261.7 74.9 0.066
800 793.1 7.8 271.2 77.7 0.075
850 849.2 9.0 298.2 84.8 0
900 892.3 10.9 313.7 89.9 0.077
950 940.5 11.5 330.6 94.8 0.085
1000 989.9 21.8 347.9 99.9 0.091
From Table 1 above, we can see that HTTP
request rates were generated from 0 rps to 1000 rps
with step 50 rps. For each of HTTP request rate
generated, there will be five parameters recorded.
1. The first was HTTP reply rate (in unit of
replies per second) parameter which is
recorded
and presented in second column of Table 1.
2. The second was Response Time (in unit of
millisecond) parameter which is recorded and
presented in third column of Table 1.
3. The third was Throughput (in unit of kilo Bytes
per second) parameter which is
recorded and
presented in fourth column of Table 1
4. The fourth was TCP Connection Rate (in
unit
of connections per second) parameter which is
recorded and presented in fifth
column of Table
1
5. The fifth was Errors (in unit of error) parameter
which is recorded and presented
in sixth column
of Table 1
The next step we take from Table 1 was, we
created and processed those five parameters above
and presented it in five different graphics.
1. The first graphic (see Figure 4) describes
HTTP Reply Rate parameter versus HTTP
Request Rate parameter
2. The second graphic (see Figure 5) describes
Response Time parameter versus HTTP Request
Rate parameter
3. The third graphic (see Figure 6) describes
Throughput parameter versus HTTP Request
Rate parameter
4. The fourth graphic (see Figure 7) describes TCP
Connection Rate parameter versus HTTP
Request Rate parameter
5. The fifth graphic (see Figure 8) describes Errors
parameter versus HTTP Request Rate parameter
Each of graphic was presented bellow.
Figure 4: HTTP Reply Rate parameter versus HTTP
Request Rate parameter.
Figure 5: Response Time parameter versus HTTP Request
Rate parameter.
iCAST-ES 2021 - International Conference on Applied Science and Technology on Engineering Science
1052
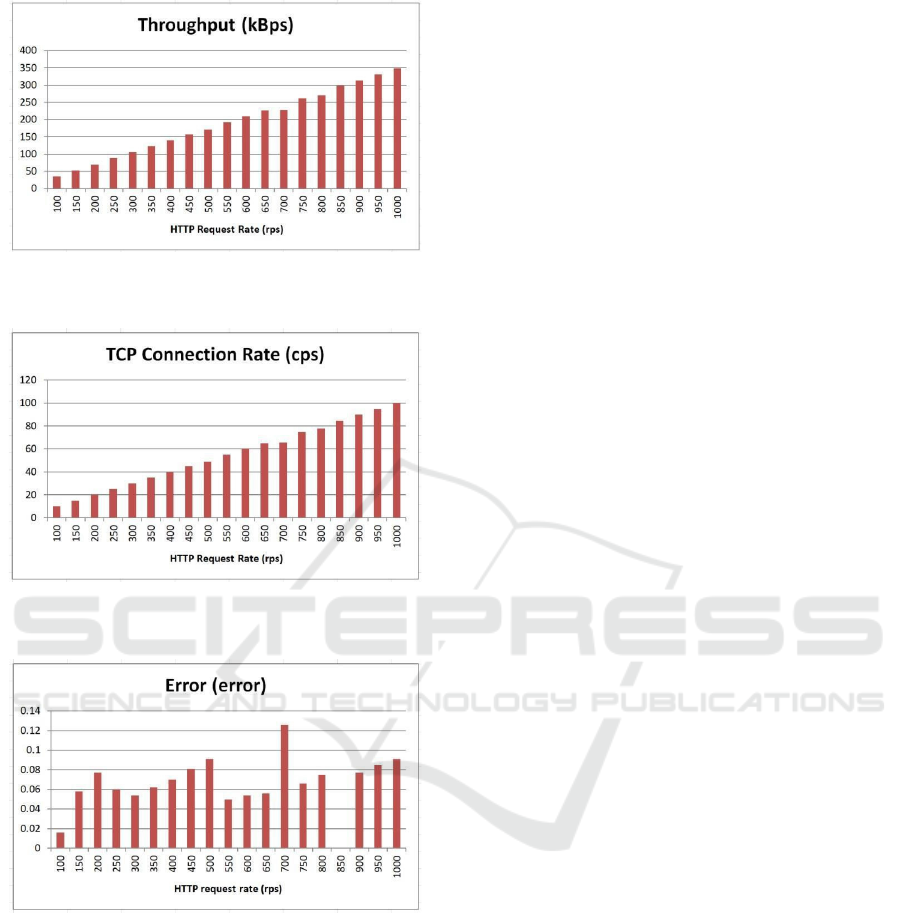
Figure 6: Throughput parameter versus HTTP Request
Rate parameter.
Figure 7: TCP Connection Rate parameter versus HTTP
Request Rate parameter.
Figure 8: Errors parameter versus HTTP Request Rate
parameter.
Result of dynamicly testing with continuous
changing HTTP request rate from 0 rps to 1000 rps in
the data recording above shows that HTTP requests
were well-distributed to web server system pool by
Locality-Based Least Connection Algorithm. It
means that all of HTTP requests were replied by pool
of web servers in the cluster. Web server cluster
working together to reply almost all of the request in
certain sequence, according to Locality-Based Least
Connection Algorithm. Locality-Based Least
Connection was working to assigns jobs (directing
HTTP requests from client) destined for the same IP
address to the same server if the server is not
overloaded and available; otherwise assign jobs to
servers with fewer jobs, and keep it for future
assignment.
We can see from Figure 4, Figure 6, and Figure 7
that these three graphics of parameters were
increasing linearly.
Response times were relatively low (see Figure
5). And errors was nearly 0 (see Figure 8).
6 CONCLUSION
Conclusion which can be taken from this research is:
Result of dynamicly web workload testing with
continuous changing HTTP request rate from 0 rps to
1000 rps shows that HTTP requests were well-
distributed to and well-replied from web server system
pool by Locality-Based Least Connection Algorithm.
REFERENCES
Roger L. Freeman. (1998). Telecommunication
Transmission Handbook, 4th edition. Canada: John
Wiley & Sons, Inc.
William Stallings. (2000). Data and Computer
Communication, 6th edition. Upper Saddle River,
New Jersey: Prentice-Hall.
H. Kaplan, B. Noseworthy. (2000). The Ethernet
Evolution: 10 to 10,000 Mbps. Atlanta: Networld
Interop.
J. Gray, P. Shenoy. (2000). Rules of Thumb in Data
Engineering. In IEEE 16th International Conference on
Data Engineering. San Diego, California: IEEE.
IA-32 Intel®. (2003). Architecture Software
Developer’s
Manual Vol. 1: Basic Architecture, Order Number
24547-012. Illionis: Intel Corporation.
Valeria Cardellini, Emiliano Casalicchio, Michele
Colajanni, Philip S. Yu. (2001). The State of the Art
in Locally Distributed Web-server Systems. IBM
Research Report.
G. Gilder. ( 2008) . The Coming Creativity Boom.
http://www.forbes.com/forbes/2008/1110/036.html
N. G. Shivaratri, P. Krueger, M. Singhal. (1992) . Load
Distributing for Locally Distributed Systems. IEEE
Computer.
Dynamic Web Workload Distribution Test from 0 Rps to 1000 Rps on Cluster-based Web Server System with Locality-based Least
Connection Algorithm
1053
