
Determination of Student Satisfaction Perceptions at Bali State
Polytechnic using the TF-IDF Method with Linear Regression and
Logistic Regression Classifier
I Gusti Ngurah Bagus Caturbawa, I Wayan Suasnawa, Ni Gusti Ayu Putu Harry Saptarini,
Anak Agung Ngurah Gde Sapteka, Kadek Amerta Yasa and I Komang Wiratama
Department of Electrical Engineering, Politeknik Negeri Bali, Badung, Bali, Indonesia
Keywords: Academic Service, Student Perception, TF-IDF, Linear Regression, Logistic Regression.
Abstract: Measurement of student satisfaction aims to maintain the sustainability of the implementation of the quality
assurance system at the Bali State Polytechnic (PNB) and to obtain feedback related to continuous
improvement efforts. The results are an evaluation material for the improvement and improvement of the
teaching and learning process in PNB and to determine the quality of services that have been provided. The
method that can be applied to determine student satisfaction has a positive, negative or neutral perception is
to use a machine learning algorithm, namely Term Frequency-Inverse Document Frequency (TF-IDF) with
classifier linear regression and logistic regression. The results of this study indicate that students' perceptions
are classified into three positive, negative and neutral classes with a precision level of 0.79 (positive), 0.88
(negative) and 0.77 (neutral) in the logistic regression classifier and 0.92 (positive), 0.87 (negative) and 0.83
(neutral) on the linear regression classifier. Accuracy obtained above 0.8 in both classifiers.
1 INTRODUCTION
The implementation of monitoring and evaluation of
the Bali State Polytechnic (PNB) is a routine activity
carried out in order to maintain the continuity of the
quality assurance system in accordance with
established standards. Among them is the
measurement of the level of student satisfaction as
one of the stakeholders through a survey. The purpose
of measuring the level of student satisfaction in
general is to maintain the sustainability of the
implementation of the PNB quality assurance system.
In particular, it is to get feedback related to
continuous improvement efforts in providing services
to students and determine aspects that need to be
followed up immediately. The results of this survey
can be used as an evaluation material for the
improvement and improvement of the teaching and
learning process at the Bali State Polytechnic and to
determine the quality of services that have been
provided.
The level of student satisfaction with the quality
of service they receive will be measured using five
variables. These variables are: reliability,
responsiveness, assurance, empathy, and tangible. In
this survey, these five variables were used to measure
student satisfaction with the service quality of the
Student Academic Administration, Departments, and
Libraries.
There are two things that are analyzed from the
results of the survey conducted. The first analysis is
carried out by calculating the index number of student
satisfaction levels in each service aspect based on the
number of respondents in each category and the level
of the gap (difference between expectations and
reality). Furthermore, to determine the quality and
performance of services, the index number will be
converted to the standard number of service quality
of government agencies as stated in the Regulation of
the Minister of Administrative Reform and
Bureaucratic Reform of the Republic of Indonesia
Number 14 of 2017 concerning guidelines for
compiling a community satisfaction survey for public
service delivery units.
The next analysis is based on student comments
on the quality of academic services they feel. This
second analysis has two possibilities, namely positive
comments or negative comments. To find out a
comment has a positive or negative perception can be
done in 2 ways. The first way is to read each comment
908
Caturbawa, I., Suasnawa, I., Saptarini, N., Sapteka, A., Yasa, K. and Wiratama, I.
Determination of Student Satisfaction Perceptions at Bali State Polytechnic using the TF-IDF Method with Linear Regression and Logistic Regression Classifier.
DOI: 10.5220/0010956500003260
In Proceedings of the 4th International Conference on Applied Science and Technology on Engineering Science (iCAST-ES 2021), pages 908-912
ISBN: 978-989-758-615-6; ISSN: 2975-8246
Copyright
c
2023 by SCITEPRESS – Science and Technology Publications, Lda. Under CC license (CC BY-NC-ND 4.0)

and rate it manually and categorize the comments as
positive or negative. This method is only possible if
the number of respondents is not so many, it will not
be efficient if the number of respondents is very large.
2 THEORY
2.1 Machine Learning
Machine learning is one of the fields of computer
science that studies learning to computer devices.
According to Expert Systems, machine learning is an
application of artificial intelligence (AI) that gives
systems the ability to learn and improve automatically
from experience without being explicitly
programmed. Machine learning focuses on
developing computer programs that can access data
and use it for self-study (Expert.ai Team, 2020
).
Machine learning becomes a powerful tool for
automation by combining data science and analysis to
get effective and fast results for analyzing data.
Machine learning algorithms use statistics to find
patterns in large amounts of data. And data, including
many things can be numbers, words, images, clicks,
or anything. Data is stored digitally, then fed into
machine learning algorithms (Hao, 2018).
Machine learning is an area within artificial
intelligence that deals with the development of
techniques that can be programmed and learn from
past data (Kazmaier et al., 2020). Pattern recognition,
data mining and machine learning are often used to
describe the same thing. This field intersects with the
science of probability and statistics and sometimes
optimization. The application of machine learning
methods into large databases is called data mining
(Vairetti et al., 2020). This can be analogized as if a
large area of land on the earth's surface containing
raw materials from nature can be mined, so that it is
able to produce a small amount of very valuable
material. Similarly, in data mining, large amounts of
data are processed to build simple models to obtain
valuable information.
Currently, there are many machine learning
approaches used for spam detection, Optical character
recognition (OCR), facial recognition, online fraud
detection, NER (Named Entity Recognition), Part-of-
Speech Tagger. (Ozyurt et al., 2020).
In machine learning, the learning process can be
grouped into several scenarios, namely Supervised
Learning, Unsupervised Learning, and
Reinforcement Learning (Kusuma, 2020).
2.1.1 Supervised Learning
Learning with supervised learning uses data input that
has been labeled. After that the system is trained so
that it can make predictions from the data that has
been labeled. The real application of supervised
learning is the display of movie shows on Netflix, the
algorithm will provide impressions suggestions by
finding similar shows.
2.1.2 Unsupervised Learning
Learning with unsupervised learning uses learning
data input that is not labeled. This machine learning
algorithm will try to group the data based on the
characteristics encountered. Unsupervised learning
techniques are less popular because their application
is less clear. Interestingly enough, they have gained
traction to be applied in cybersecurity.
2.1.3 Reinforcement Learning
Learning with reinforcement learning uses mixed
learning and testing. The system collects learning
information actively by interacting with the
environment. Reinforcement learning algorithms
learn through trial and error to achieve goals.
Algorithms use many different things and are
rewarded or punished depending on whether the
behavior helps or hinders achieving its goals.
2.2 Term Frequency-Inverse Document
Frequency (TF-IDF)
The TF-IDF method is a way to weight the
relationship of a word (term) to the text of the
document, combining two concepts. The first concept
is weight calculation, namely, the frequency of
occurrence of a word in a particular document called
Term Frequency (TF). The second concept is the
inverse frequency of documents containing words
called Inverse Document Frequency (IDF). The
frequency of occurrence of a word in a document
which indicates how important a word is in a given
document. The weight of the relationship between a
word in a document will be high if the frequency of
the word is high in the document and the frequency
of the entire document containing that word will be
low in the document set (Amrizal, 2019).
TF-IDF is basically the result of a calculation
between TF (Term Frequency) and IDF (Inverse
Document Frequency). There are many ways to
determine the exact value of the two statistics. In the
case of term frequency tf (t, d), the simplest way is to
use raw frequency in the document, i.e. the number of
Determination of Student Satisfaction Perceptions at Bali State Polytechnic using the TF-IDF Method with Linear Regression and Logistic
Regression Classifier
909
times term t appears in document d. If we express raw
frequency t as f(t,d), then the simple tf scheme is
tf(t,d) = f(t,d). Other possibilities include (Manning et
al., 2008):
Boolean frequency : tf(t,d) = 1 if t occurs in d
and 0 vice versa;
Logarithmic frequency scale :
tf (t,d) = log (f (t ,d) + 1);
Added frequency, to prevent bias against the
document again, for example, the raw
frequency divided by the maximum raw
frequency of each term in the document.
t
f
(
t, d
)
=0.5+
0.5
(, )
max
{
(
,
)
: ∈
(1
)
IDF (Inverse Document Frequency) is a measure of
whether the term is common or rare in all documents.
This is obtained by dividing the number of documents
in the corpus by the number of documents containing
the term, and then taking the logarithm of the
quotient.
idf(
t
,D) =log
|N|
|
{
∈∶∈|
(2
)
which is
|| : cardinality of N, or the total number of
documents in the corpus.
| { ∈∶∈ | : number of documents where
term t appears (for example (,)≠0). If the
term is not in the corpus, it will refer to
division-by-zero. Therefore, usually to adjust
the formula to:
1+|{∈:∈}|
(3
)
Mathematically the basic log function is not
important and is a multiplier of the overall result.
Then TF-IDF can be formulated as:
(,,)= (,)× (,)
(4
)
2.3 Classifier
2.3.1 Linear Regression
In general, regression is a method for predicting the
value of a conditional expectation. Regression is said
to be linear if the relationship between the
independent variable and the dependent variable is
linear. The relationship between the independent
variable and the dependent variable can be said to be
linear if the data scatter diagram of these variables is
close to a straight line pattern.
Linear regression was developed in the field of
statistics and is studied as a model for understanding
the relationship between input and output numerical
variables, but has been borrowed by machine
learning. It is both a statistical algorithm and a
machine learning algorithm.
2.3.2 Logistic Regression
Logistic regression analysis is a mathematical model
that is used to study the relationship of one or several
independent variables with a dependent variable that
is dichotomous (binary). A binary variable is a
variable that has only two values.
The logistic regression (sometimes called the
logistic model or logit model) is a part of regression
analysis, which is used to predict the probability of
the occurrence of an event, by fitting the data to the
logit function of the logistic curve. This method is a
general linear model used for binomial regression.
Like regression analysis in general, this method uses
several independent variables, both numeric and
categorical.
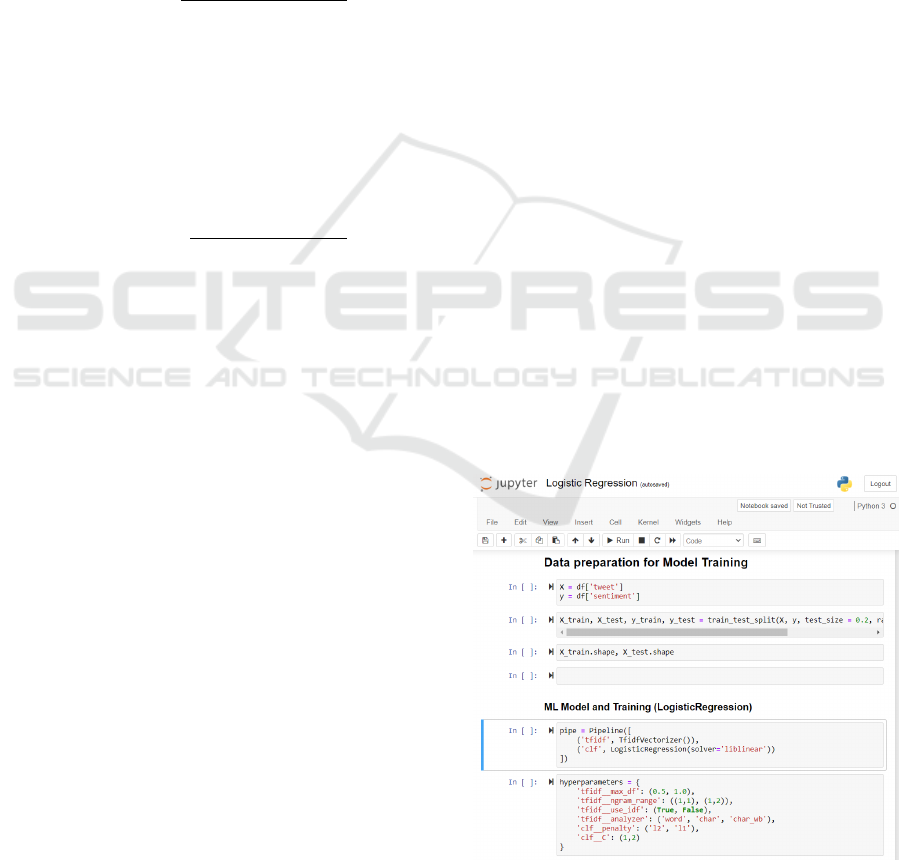
3 RESEARCH METHODOLOGY
In this research, machine learning coding is made
using the Python programming language. The tool
used is Jupyter Notebook, which is popularly used to
process data in python.
Figure 1: Machine learning using Jupyter Notebook.
iCAST-ES 2021 - International Conference on Applied Science and Technology on Engineering Science
910
Jupyter Notebook can integrate code with output in
one document interactively. Jupyter Notebook makes
data preprocessing and analysis easy. Figure 1 shows
the jupyter notebook interface for writing machine
learning code.
The process stages used for processing in machine
learning can be explained as follows:
3.1 Data Collection
The data collection was carried out in the form of data
collection related to the data needed as initial data,
namely student comments on academic services felt
during lectures at PNB in Indonesian. Data is
collected at the time of carrying out the survey on the
level of student satisfaction with academic services.
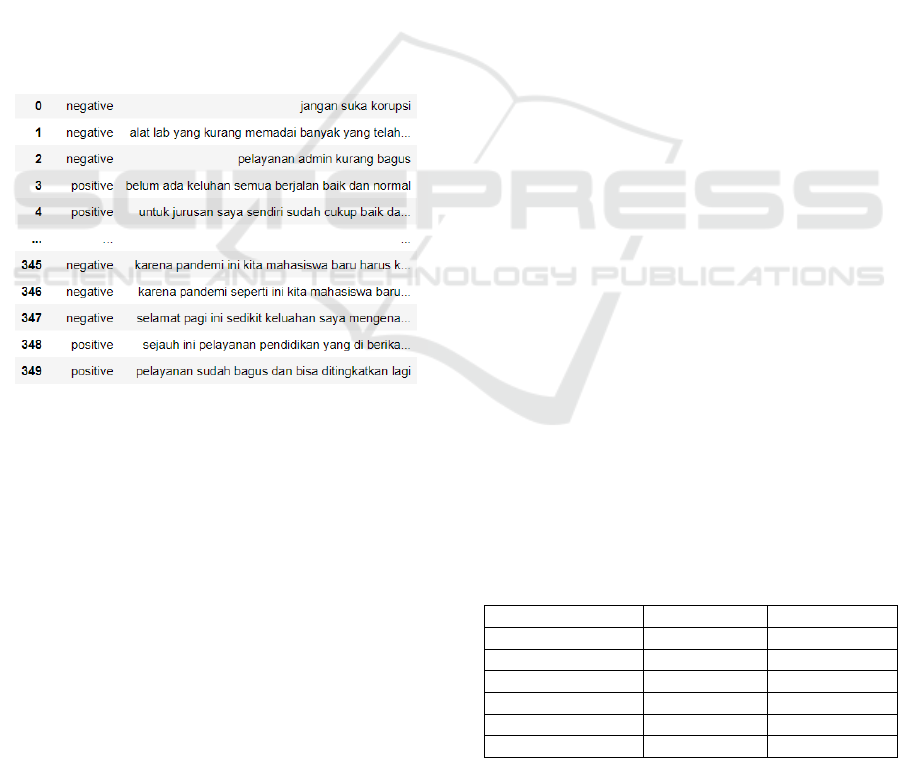
3.2 Data Preprocessing
In the initial processing of data in machine learning,
several issues need to be addressed before further
analysis.
Figure 2: Data preprocessing results.
Among them are ensuring the data is clean, without
noise, and scaled to improve the performance of
machine learning algorithms so that the quality of
machine learning results has a good level of accuracy.
The data obtained after the preprocessing process can
be seen in Figure 2.
3.3 Model Training
In the training process, the model is made to learn to
associate input, namely student commentary text with
output in the form of tags according to the sample
used for machine learning training. The feature
extractor transfers the given text input into a feature
vector. Pairs of feature vectors and tags (positive and
negative) are fed into a machine learning algorithm to
generate a machine learning model. In the prediction
process, this feature extractor functions to convert
invisible text inputs into feature vectors. This feature
vector is entered into the model, resulting in a
predicted tag in the form of student perceptions that
can be positive or negative.
The feature extraction technique used is based on
word embeddings which allows words with similar
meanings to have similar representations. The
classifier used to determine student perceptions in
terms of student satisfaction with academic services
is Term Frequency-Inverse Document Frequency
(TF-IDF).
3.4 Model Testing and Evaluation
Testing is done by providing input for student
comments to the model generated in the machine
learning training process. Does the output produced
by the model have a good level of accuracy. The
results of the tests carried out as a basis for evaluating
whether the model generated by machine learning
needs to be increased in accuracy or not.
4 RESULTS AND DISCUSSION
In this study, Jupyter Notebook is used to facilitate
preprocessing and data analysis, using the Python
programming language. The libraries used are
Numpy, Pandas, and Sklearn. In the machine learning
training process, the results are precision, accuracy
and recall. This parameter is used as a benchmark for
the reliability of the system to provide a more
accurate result. The test was conducted to determine
the accuracy of the TF-IDF method with a
combination of 2 classifiers, namely Logistic
Regression and Linear Regression. Table 1 dan Table
2 shows the results obtained by comparing which
method has the highest level of accuracy, precision,
and recall.
Table 1: Accuracy, precision and recall results on linear
regression classifier.
Precision Recall
Ne
g
ative 0.88 0.95
Neutral 0.77 0.71
Positive 0.79 0.69
Accurac
y
Macro av
g
0.81 0.78
Wei
g
hted av
g
0.84 0.84
Determination of Student Satisfaction Perceptions at Bali State Polytechnic using the TF-IDF Method with Linear Regression and Logistic
Regression Classifier
911
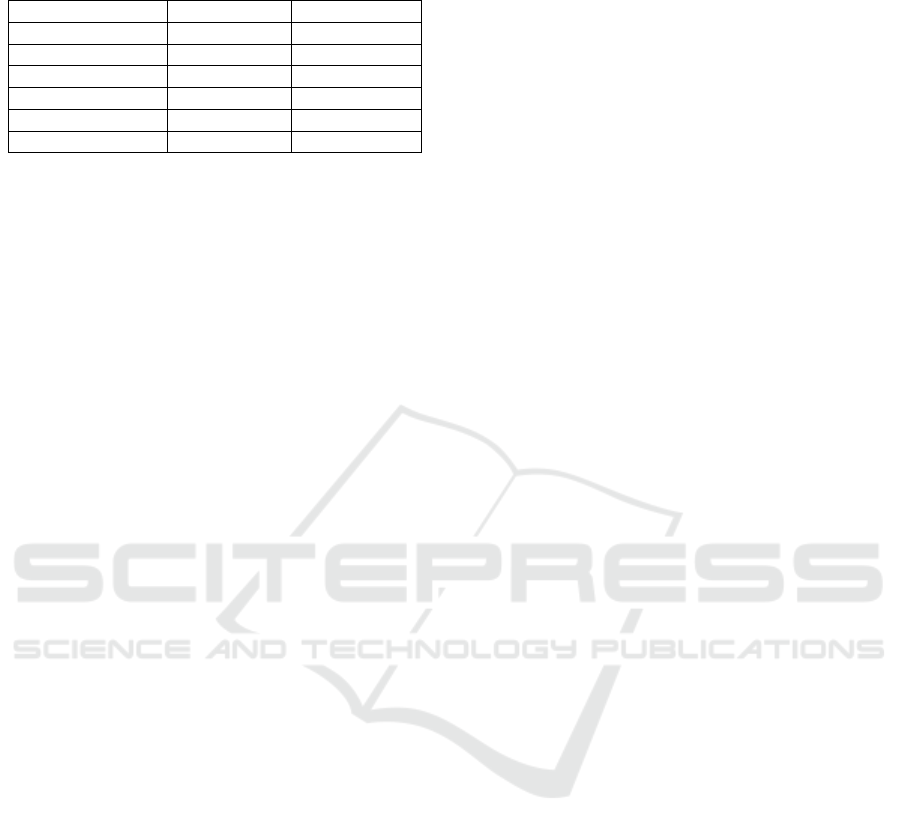
Table 2: Accuracy, precision and recall results on the
logistic regression classifier.
Precision Recall
Negative 0.87 1.00
Neutral 0.83 0.71
Positive 0.92 0.69
Accurac
y
Macro av
g
0.87 0.80
Weighted avg 0.87 0.87
Based on Table 1 and Table 2, it can be concluded
that the results of the accuracy, precision, and recall
of the combination of TF-IDF with classifier linear
regression are better than the combination of TF-IDF
with classifier Logistic Regression.
5 CONCLUSIONS
The method that can be applied to determine student
satisfaction has a positive, negative or neutral
perception is to use a machine learning algorithm,
namely Term Frequency-Inverse Document
Frequency (TF-IDF) with classifier linear regression
and logistic regression. The results of this study
indicate that students' perceptions are classified into
three positive, negative and neutral classes with a
precision level of 0.79 (positive), 0.88 (negative) and
0.77 (neutral) in the logistic regression classifier and
0.92 (positive), 0.87 (negative) and 0.83 (neutral) on
the linear regression classifier. Accuracy obtained
above 0.8 in both classifiers.
The results obtained in the system that was built
show that the TF-IDF method with a combination of
classifier linear regression in general has better
accuracy measurement results than the combination
of TF-IDF with Logistic Regression.
REFERENCES
Expert.ai Team., (2020). What is Machine Learning? A
Definition. Retrieved from
https://www.expert.ai/blog/machine-learning-
definition/.
Hao, K., (2018). What is machine learning?. Retrieved from
https://www.technologyreview.com/2018/11/17/10378
1/what-is-machine-learning-we-drew-you-another-
flowchart/.
Kusuma, P. D. (2020). Machine Learning Teori, Program,
Dan Studi Kasus, Deepublish Publisher, Yogyakarta.
Amrizal, X. V. (2019). Penerapan Metode Term Frequency
Inverse Document Frequency (Tf-Idf) Dan Cosine
Similarity Pada Sistem Temu Kembali Informasi Untuk
Mengetahui Syarah Hadits Berbasis Web (Studi Kasus:
Hadits Shahih Bukhari-Muslim), J. Tek. Inform., vol.
11, no. 2, pp. 149–164.
Manning, C. D., Raghavan P., and Schütze H. (2008).
Introduction to Information Retrieval, Cambridge
University Press.
Kazmaier, J., and Van Vuuren, J. H. (2020). A generic
framework for sentiment analysis: Leveraging opinion-
bearing data to inform decision making, Decis. Support
Syst., vol. 135, p. 113304.
Ozyurt, B., and Akcayol, M. A. (2020). A new topic
modeling based approach for aspect extraction in aspect
based sentiment analysis: SS-LDA, Expert Syst. Appl.,
vol. 168, p. 114231.
Vairetti, C., Martínez-Cámara, E., Maldonado, S., Luzón,
V., and Herrera, F. (2020) Enhancing the classification
of social media opinions by optimizing the structural
information, Futur. Gener. Comput. Syst., vol. 102, pp.
838–846.
iCAST-ES 2021 - International Conference on Applied Science and Technology on Engineering Science
912
