
Comparison of PI, PD, and PID Controller in Hydroponic Plant
Nutrient Concentration Control System
Nurmahaludin
1
, Gunawan Rudi Cahyono
2
and Joni Riadi
1
1
Dept. of Electrical Engineering, Politeknik Negeri Banjarmasin, Banjarmasin, Indonesia
2
Dept. of Mechanical Engineering, Universitas Lambung Mangkurat, Banjarmasin, Indonesia
Keywords: PID Controller, Nutrient Concentration, Hydroponics.
Abstract: Hydroponics is a plant cultivation technique by utilizing water media and emphasizing the need for nutrients
to grow. Each type of hydroponic plant requires a nutrient solution with different levels of concentration. If
the concentration is low, it will reduce the effectiveness of nutrients so that additional nutrients are needed.
Meanwhile, if it is excessive, the plant will wither and even die.
In this study, Proportional (P), Integral (I), dan Derivative (D) controller is used. PI, PD, and PID controllers
were designed, then tested on a nutrient concentration control system to get the best performance. If the error
is positive, it indicates the plant to approach the threshold of excess nutrients, so the controller will move the
servo motor to open the water valve. On the other hand, if the error value is negative, it indicates that the plant
to approach the nutrient deficiency threshold, so that the nutrient solution valve needs to be opened through
servo motor movement.
The observed variables are error rate and delta error. The test results show that the use of a PID controller
with Kp=0.5, Ki=1, and Kd=1 gives a fairly good performance with relatively small error rates and delta error,
namely 4.997 (0.83%) and 1.804.
1 INTRODUCTION
The hydroponic system is a method of growing plants
using a solution of mineral nutrients in water without
soil. Each type of hydroponic plant requires a solution
with a different level of nutrient concentration (Tallei,
Rumengan, & Adam, 2017). The level of
concentration of nutrients is measured in units of
particles per million (ppm) or by measuring the level
of conductivity. If the nutrient solution given
becomes too concentrated, it will cause the plant to
wither or die, so it is necessary to give water as a
diluent in order to reduce the concentration level
gradually. On the other hand, if the concentration of
the solution is low, then the plant will become
deficient in nutrients, so it needs to be added.
Monitoring to maintain the concentration value of
the nutrient solution for local hydroponic farmers is
still done manually using a TDS (Total Dissolved
Solids) measuring instrument at certain times. There
needs to be a regulatory system to control nutrient
concentrations automatically. Control algorithm is
needed to achieve the desired concentration
optimally. In this research, PI, PD, and PID
controllers will be designed for later analysis of the
resulting performance. The observed performance
parameters are the resulting error rate as well as
oscillations in the system response which are shown
through delta error observations.
There are a number of studies on monitoring
systems and nutrition for hydroponic plants,
including monitoring systems for pH and water
conductivity in hydroponic plants automatically
using sensors and microcontrollers (Gosavi, 2017)
(Umamaheswari, Preethi, Pravin, & Dhanusha,
2017). In this study, the control process is carried out
through a programmed microcontroller and is not
carried out remotely (wireless).
The next research development is the provision of
nutrition to hydroponic plants through remote
control, including Arduino which is connected to a
Wi-Fi module (P. Sihombing, Karina, Tarigan, &
Syarif, 2018), using an Arduino microcontroller
controlled via a smart phone (Poltak Sihombing,
Zarlis, & Herriyance, 2019), and based on IoT using
web technology (Crisnapati, Wardana, Aryanto, &
Hermawan, 2017). Although the control system as
mentioned above can be done wirelessly, in the
Nurmahaludin, ., Cahyono, G. and Riadi, J.
Comparison of PI, PD, and PID Controller in Hydroponic Plant Nutrient Concentration Control System.
DOI: 10.5220/0010955600003260
In Proceedings of the 4th International Conference on Applied Science and Technology on Engineering Science (iCAST-ES 2021), pages 863-868
ISBN: 978-989-758-615-6; ISSN: 2975-8246
Copyright
c
2023 by SCITEPRESS – Science and Technology Publications, Lda. Under CC license (CC BY-NC-ND 4.0)
863
process of regulating the concentration of nutrients it
is still done on-off. Arduino will activate or deactivate
(on-off) the tank valve which contains water and
nutrients and then flows it to hydroponic plants.
The use of control algorithms in regulating the
NFT hydronic system, among others, uses fuzzy logic
(Mashumah, Rivai, & Irfansyah, 2018), with input in
the form of errors and water volume and output in the
form of valve openings. The results obtained are quite
good with an error rate of 8.9%. Another research is
the control of electrical conductivity (EC) with a PID
controller (Ikhlas, T, & Sc, 2018) . The control system
output is in the form of a solenoid valve to drain AB
mix nutrients or water. Observations were made on
the achievement of the predetermined EC set point.
In this research, PI, PD, and PID controllers will
be designed and applied to control nutrient solution
concentration. Then observations were made on the
three controllers to determine the method and
parameter values of Kp, Ki, and Kd which had the
best performance.
The control system is the process of setting one or
several variables so that they are at a certain price or
price range. Besides keeping the system output at the
desired price, the control system also aims to obtain
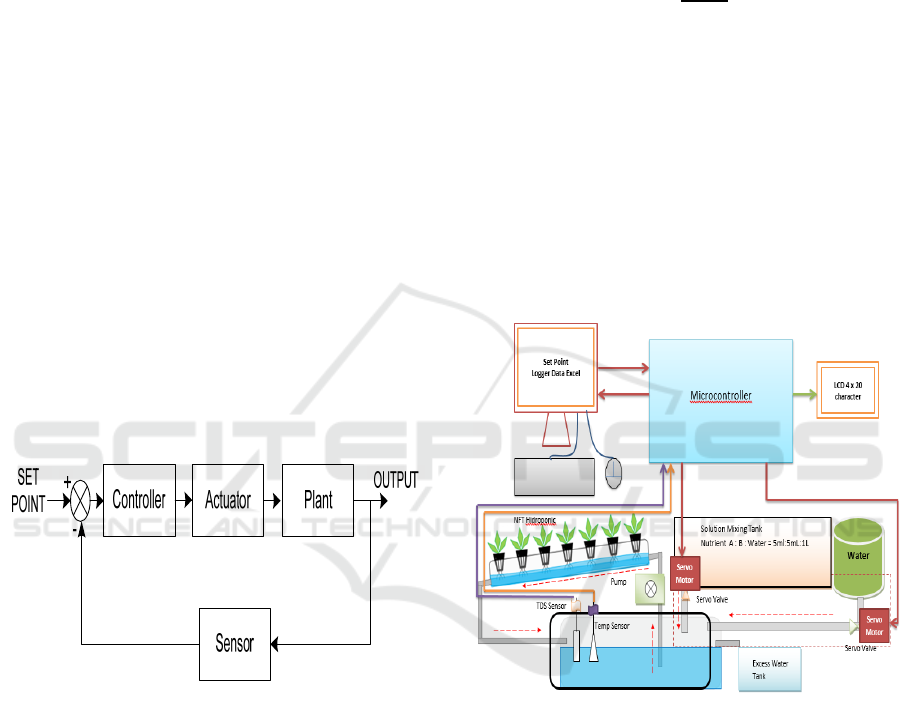
optimal performance. The closed loop control system
is shown in Figure 1.
Figure 1: Block diagram of closed loop control system.
The control system starts by assigning a set point
value. The system output is measured using sensors
and then compared with the set point to determine the
resulting error.
e(t) = SP
–
PV (1)
where e(t) is the error value at time t, SP is the set
point value, and PV (present value) is the sensor's
measured output value.
If there is an error, the controller will process it
using the programmed control algorithm. The PID
(Proportinal, Integral, Derivative) control algorithm
is defined as follows:
a. Proportional Controller (P):
=
()
(2
)
b. Integral Controller (I):
=
()
(3
)
c. Derivative Controller (D):
=
()
(4
)
2 METHODS
The design of the hydroponic plant nutrient
concentration control system is shown in Figure 2.
The nutrient solution bath contains a mixture of
nutrient A (5ml) and nutrient B (5ml), while the water
tank is used as a diluent for the solution. In the
circulation tub, adjustments are made to obtain the
nutrient concentration in accordance with the
reference value for each type of hydroponic plant.
Figure 2: Control system design for nutrient concentration.
To adjust the concentration, a control algorithm is
used which will adjust the opening of the servo valve
in the nutrient and the valve in the water tank as a
diluent. The control algorithms that are simulated are
PI, PD, and PID with parameter settings Kp, KI, and
Kd to determine the effect of each type of controller
and determine parameters that are considered to have
good enough performance. The process of adjusting
the concentration of the nutrient solution is shown in
a flow chart as shown in Figure 3. After the
concentration of the solution required by the plant is
reached, the nutrients are watered onto the
hydroponic plants.
iCAST-ES 2021 - International Conference on Applied Science and Technology on Engineering Science
864
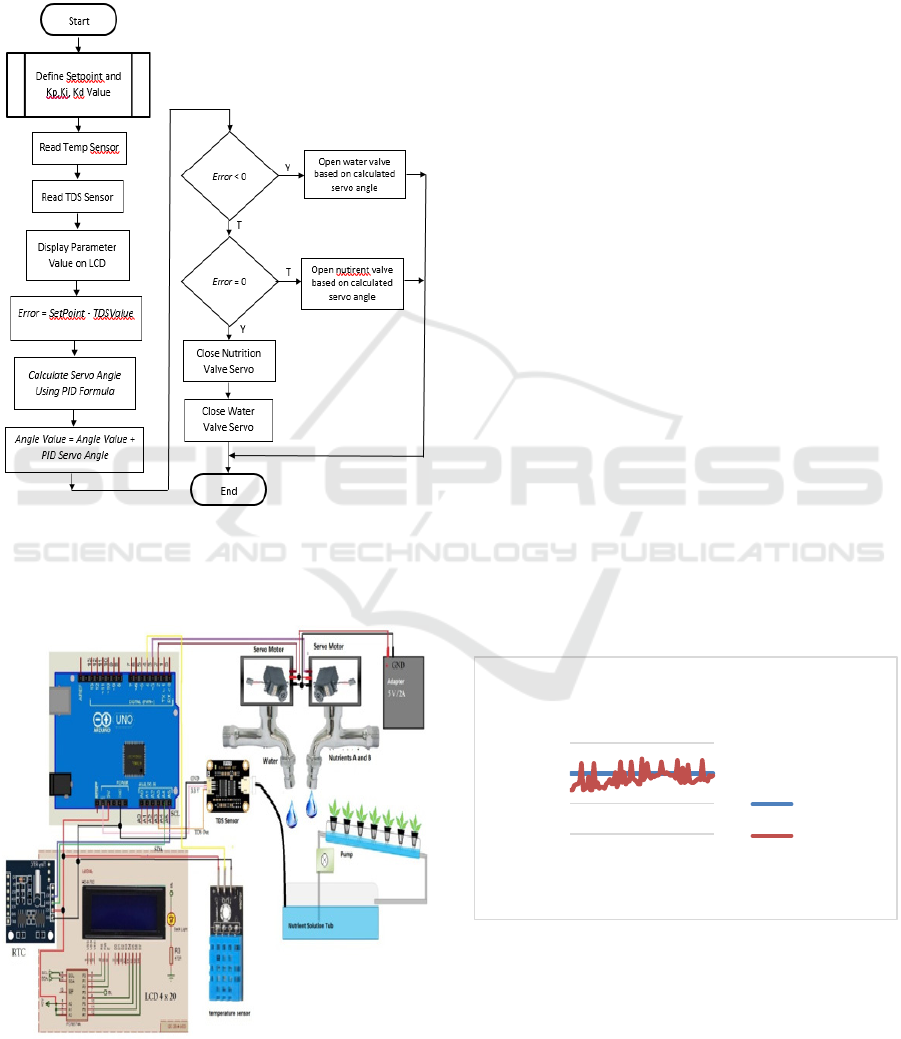
If the error is smaller than zero, the water servo
valve will open at the calculated angle value. On the
other hand, if the error is greater than zero, the
nutrition servo valve will open. When the error
condition is equal to zero, the water servo valve and
the nutrition servo valve will be closed.
Figure 3: Control process flowchart.
The electronic circuit used for system settings is
shown in Figure 4.
Figure 4: Electronic circuit.
The schematic of the circuit above has the
following pin out configuration:
1. The TDS sensor will be connected to pin A4 of the
Arduino microcontroller. The sensor probe is placed
in a tub of nutrient solution whose concentration will
be measured.
2. RTC and LCD use serial I2C, each for SDA data is
connected to an arduino microcontroller.
3. Temperature and humidity sensors are connected
to the D4 pin of the microcontroller
4. The servo motor is used to rotate the water and
nutrition valve connected to the D2 and D3 pins of the
Arduino microcontroller.
3 RESULT AND DISCUSSION
Tests were carried out on the PI, PD, and PID control
algorithms with variations in the values of Kp, Ki, Kd
and a set point of 600 ppm.
3.1 PI Controller
The proportional controller (P) and the integral
controller (I) are combined in a cascade and then
command the actuator in this case the servo motor to
drive the nutrient solution or water valve. The
movement of the valve is based on the servo motor
angle according to the given control signal.
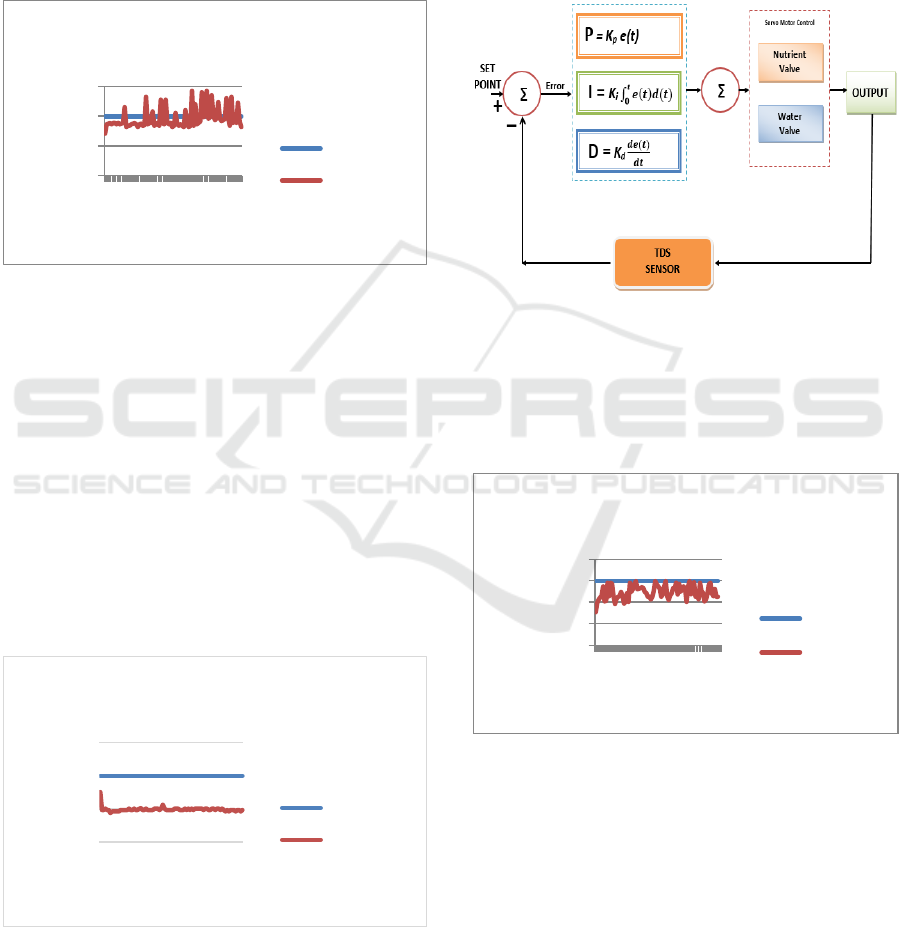
The results of the PI controller test with values of
Kp=0.5 and Ki=0.5 resulted in an error rate of 8.397
(1.4%) and an average delta error |dE| of 12,189. The
graph of the system response to the set point is shown
in Figure 5.
Figure 5: System response with Kp=0.5 and Ki=0.5.
The next test is by changing the PI controller
parameters where the Ki value is increased by 1,
while Kp remains at 0.5. The test results are given in
Table 5.2. The average error generated is 4,569
(0.76%) and the delta error is 16,194.
500
550
600
650
1 12233445566778
Concentration Value (ppm)
Time (s)
System Response Graph
Kp=0.5 and Ki=0.5
Set Point
TDS Value
Comparison of PI, PD, and PID Controller in Hydroponic Plant Nutrient Concentration Control System
865
When compared with the previous results, error
rate is relatively smaller, while the value of the delta
error is larger. This is influenced by controller
Integral which serves to minimize steady state error.
However, the increase in the value of Ki causes the
response to experience a slight increase in oscillations
which is indicated by a larger delta error. The graph
of the system response to the PI controller is shown
in Figure 6.
Figure 6: System response with Kp=0.5 and Ki=1.
3.2 PD Controller
The addition of a derivative controller (D) is intended
to reduce oscillations in the system response. The
results of the test using a PD controller with Kp=0.5
and Kd=1 indicate the error rate generated is larger,
namely 50,935 (8.49%). This means that the system
output does not succeed in approaching the specified
set point value of 600 ppm.
However, if we look at the average delta error |dE|
which became smaller by only 1,627, indicating the
system became more damped so that the oscillations
were successfully reduced. The system response
graph is shown in Figure 7.
Figure 7: System response with Kp=0.5 and Kd=1.
3.3 PID Controller
Based on the results of previous tests, the use of the
PI controller will reduce the error rate, while the PD
controller has succeeded in reducing oscillations and
overshoot. So that combining the three types of
controllers into a PID will result in better
performance. Block diagram of the PID controller can
be seen in Figure 8.
Figure 8: Block diagram of nutrient concentration control
using PID controller.
In the first test with values of Kp = 0.5, Ki = 0.5,
and Kd = 1, the error rate was 10,491 (1.75%) and
average delta error was 5.867. The system response
graph is given in Figure 9.
Figure 9: System response with Kp=0.5, Ki=0.5, and Kd=1.
To reduce the oscillations, the value of Kd is then
enlarged to 1.5, while the other parameters remain the
same. The test results show that the oscillation can be
reduced to only 1,798, but the resulting error rate is
57,661 (9.61%). Figure 10 shows a graph of the
system response for Kp=0.5, Ki=0.5, and Kd=1.5.
500
550
600
650
1 132537496173
Concentration Value (ppm)
Time (s)
System Response Graph
Kp=0.5 and Ki=1
Set Point
TDS Value
500
550
600
650
1 12233445566778
Concentration Value (ppm)
Time (s)
System Response Graph
Kp=0.5 and Kd=1
Set Point
TDS Value
540
560
580
600
620
1 1631466176
Concentration Value
(ppm)
Time (s)
System Response Graph
Kp=0.5; Ki=0.5; Kd=1
Set Point
TDS Value
iCAST-ES 2021 - International Conference on Applied Science and Technology on Engineering Science
866
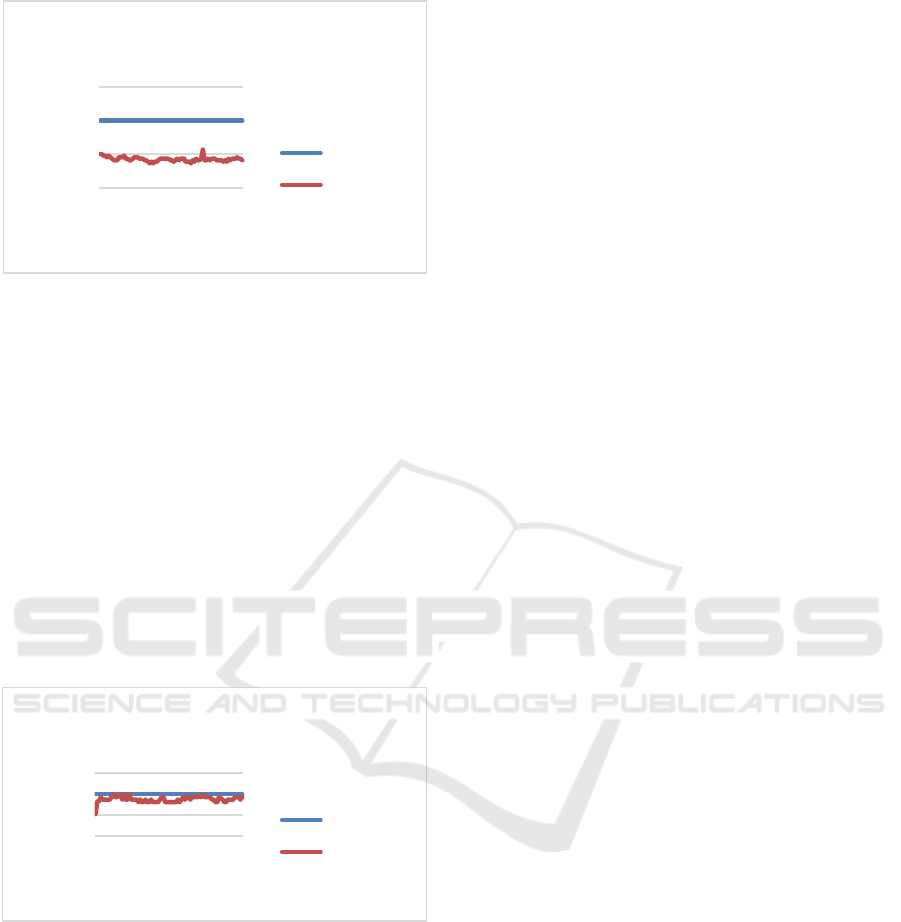
Figure 10: System response with Kp=0.5, Ki=0.5, and
Kd=1.5.
Based on previous result, the Kd value should not
be too large, although it will provide stability to the
system response. To reduce the error rate that occurs,
the Ki parameter is enlarged to 1 and the Kd value is
returned to its original value to 1. So that the
controller parameters are now Kp=0.5, Ki=1, and
Kd=1.
From the test results, it can be seen that the average
error generated is 4,997 (0.83%), while the average
delta error is 1,804. So that there is a compromise
value between the control objectives to produce the
minimum possible error, with the minimum possible
oscillation impact. Figure 11 is a graph of the system
response using PID with Kp=0.5, Ki=1, and Kd=1.
Figure 11: System response with Kp=0.5, Ki=1, and Kd=1.
4 CONCLUSIONS
The control of nutrient concentration in hydroponic
plants in this study using PI, PD, and PID controllers
aims to observe the performance of each controller
and determine the parameters that have the best
performance.
There is a compromise in determining the
parameters of Kp, Ki, and Kd. By increasing the value
of Ki to produce a smaller error rate, it will increase
the oscillation and overshoot. Likewise, if increasing
the value of Kd in order to obtain a low level of
oscillation and overshoot, it will produce a greater
error rate.
In testing using a PID controller with Kp = 0.5,
Ki=1, and Ki=1, a satisfactory performance was
obtained, where the error rate and average delta error
produced were quite low, namely 4.997 (0.83%) and
1.804.
ACKNOWLEDGEMENTS
Many thanks to the Politeknik Negeri Banjarmasin
for providing funding so that this research can be
completed.
REFERENCES
Crisnapati, P. N., Wardana, I. N. K., Aryanto, I. K. A. A.,
& Hermawan, A. (2017). Hommons: Hydroponic
management and monitoring system for an IOT based
NFT farm using web technology. 2017 5th
International Conference on Cyber and IT Service
Management, CITSM 2017.
https://doi.org/10.1109/CITSM.2017.8089268
Gosavi, J. V. (2017). Water Monitoring System for
Hydroponics Agriculture. International Journal for
Research in Applied Science & Engineering
Technology (IJRASET), 887(Vii), 2321–9653.
Retrieved from www.ijraset.com
Ikhlas, M., T, I. S. S. M., & Sc, M. (2018). Perancangan
Kendali Nutrisi Pada Hidroponik Nft ( Nutrient Film
Technique ) Dengan Metode Pid Design of Controlling
Nutrient in Hydroponic ( Nutrient Film Technique )
Using Pid. E-Proceeding of Engineering, 5(1), 79–85.
Mashumah, S., Rivai, M., & Irfansyah, A. N. (2018).
Nutrient Film Technique based Hydroponic System
Using Fuzzy Logic Control. Proceeding - 2018
International Seminar on Intelligent Technology and Its
Application, ISITIA 2018, (1), 387–390.
https://doi.org/10.1109/ISITIA.2018.8711201
Sihombing, P., Karina, N. A., Tarigan, J. T., & Syarif, M. I.
(2018). Automated hydroponics nutrition plants
systems using arduino uno microcontroller based on
android. Journal of Physics: Conference Series, 978(1).
https://doi.org/10.1088/1742-6596/978/1/012014
Sihombing, Poltak, Zarlis, M., & Herriyance. (2019).
Automatic Nutrition Detection System (ANDES) for
Hydroponic Monitoring by using Micro controller and
Smartphone Android. Proceedings of 2019 4th
International Conference on Informatics and
Computing, ICIC 2019.
https://doi.org/10.1109/ICIC47613.2019.8985851
Tallei, T. E., Rumengan, I. F. M., & Adam, A. A. (2017).
Hidroponik untuk Pemula. In UNSRAT Press (Vol. 1).
500
550
600
650
1 12233445566778
Concentration Value (ppm)
Time (s)
System Response Graph
Kp=0.5; Ki=0.5; Kd=1.5
Set Point
TDS Value
560
580
600
620
1 12233445566778
Concentration Value (ppm)
Time (s)
System Response Graph
Kp=0.5; Ki=1; Kd=1
Set Point
TDS Value
Comparison of PI, PD, and PID Controller in Hydroponic Plant Nutrient Concentration Control System
867

Umamaheswari, S., Preethi, A., Pravin, E., & Dhanusha, R.
(2017). Integrating scheduled hydroponic system. 2016
IEEE International Conference on Advances in
Computer Applications, ICACA 2016, 333–337.
https://doi.org/10.1109/ICACA.2016.7887976
iCAST-ES 2021 - International Conference on Applied Science and Technology on Engineering Science
868
