
Strategy Analysis of Sustainable Water Supply System
in Buleleng Regency
I Nyoman Sedana Triadi and Ir Made Mudhina
Jurusan Teknik Sipil, Politeknik Negeri Bali,
Jl Kampus Bukit Jimbaran, Kuta Selatan, Kab. Bandung-Bali-8036, Indonesia
Keywords: Management, Availability, Need, Clean Water, Sustainable.
Abstract: The Provincial Government of Bali prepares development in a comprehensive and sustainable manner by
taking into account the carrying capacity of Bali's nature which is guided by the planned universal
development program contained in the Nangun Sat Kerthi Loka Bali program. With this program, it is hoped
that the welfare of the community will be achieved while preserving the natural surroundings as a support for
human life in various sectors of life. One of the main obstacles in the development of sustainable water
resources is the lack of water resource development planning based on the concept of sustainability, with
challenges faced covering aspects of geography, institutions, regulations, human resources, funding sources,
awareness and community participation. In line with the description above, while still paying attention to the
linkages and sustainability of water resources development programs in the Bali region, as well as the efforts
that have been implemented, it is important to make more sustainable planning, especially in the Buleleng
Regency area. The increasing demand for water causes several problems in the process of providing water in
sufficient quantity and quality. The availability of water on the earth's surface is naturally limited, and is
determined by time and space. The rapid development of tourism and industry has resulted in increased water
demand, while water reserves are decreasing. Population growth in Buleleng Regency is increasing, so that
the fulfillment of the basic needs of the community for clean water is increasing. Buleleng Regency is a
regency with the largest area in Bali Province, namely 1,365,880 km2, about 24.232% of the total area of Bali
Province. Buleleng Regency has a population of 664,000 people in 2020 The population distribution in 9 sub-
districts includes Gerokgak District 85,730 people, Seririt District 73,600 people, Busungbiu District 41,210
people, Banjar District 73,450 people, Sukasada District 78,880 people, Buleleng District 139,570 people,
Sawan District 61,140 people, KubuAddan District 56,150 people, Tejakula District 54,270 people. Buleleng
sub-district is the most populous sub-district in this district. The percentage of the total population in Bali
Province in 2020 is 15.225%. In terms of quantity, the current population growth rate of Buleleng Regency is
0.58%. Clean water services in Buleleng Regency are carried out by the Regional Drinking Water Company
(PDAM) of Buleleng Regency and community groups. PDAM Buleleng Regency is able to serve 19 urban
villages with the percentage of services reaching 90.08%, and services at the rural level reaching 24.01%. The
level of clean water services managed by PDAM has reached an average of 27.12% of the total population of
Buleleng Regency. The current availability of clean water in Bulelelng Regency until 2040 is 887.43 l/sec,
and water demand in Bulelelng Regency until 2040 is 1,707.87 l/sec, there is a water deficit in 2040 in
Bulelelng Regency of 820, 44 l/sec. To overcome the clean water deficit in Bulelelng district, the Titab
Reservoir SPAM development was carried out at 300 liters/sec, and Tamblang Reservoir SPAM at 400
liters/sec, Tamblingan Lake at 100 liters/sec, and Sanih Spring development at 50 liters/sec. The development
of a clean water supply system in Buleleng Regency will be able to meet clean water needs until 2040,
resulting in a clean water surplus of 29.56 liters/sec.
1 INTRODUCTION
1.1 Background
Population growth in Buleleng Regency is increasing,
so that the fulfillment of the basic needs of the
community for clean water is increasing. Buleleng
Regency is a regency with the largest area in Bali
Province, namely 1,365,880 km2, about 24.232% of
the total area of Bali Province. Buleleng Regency has
a population of 664,000 people in 2020 The
population distribution in 9 sub-districts includes
Gerokgak District 85,730 people, Seririt District
73,600 people, Busungbiu District 41,210 people,
Triadi, I. and Mudhina, I.
Strategy Analysis of Sustainable Water Supply System in Buleleng Regency.
DOI: 10.5220/0010955400003260
In Proceedings of the 4th International Conference on Applied Science and Technology on Engineering Science (iCAST-ES 2021), pages 851-856
ISBN: 978-989-758-615-6; ISSN: 2975-8246
Copyright
c
2023 by SCITEPRESS – Science and Technology Publications, Lda. Under CC license (CC BY-NC-ND 4.0)
851

Banjar District 73,450 people, Sukasada District
78,880 people, Buleleng District 139,570 people,
Sawan District 61,140 people, KubuAddan District
56,150 people, Tejakula District 54,270 people.
Buleleng sub-district is the most populous sub-district
in this district. The percentage of the total population
in Bali Province in 2020 is 15.225%. In terms of
quantity, the current population growth rate of
Buleleng Regency is 0.58%. (Central Bureau of
Statistics of Buleleng Regency, 2020)
Clean water services in Buleleng Regency are
carried out by the Regional Drinking Water Company
(PDAM) of Buleleng Regency and community
groups. PDAM Buleleng Regency is able to serve 19
urban villages with the percentage of services
reaching 90.08%, and services at the rural level
reaching 24.01%. The level of clean water services
managed by PDAM has reached an average of
27.12% of the total population of Buleleng Regency.
1.2 Problem Formulation
The formulation of the problem from the Strategic
Analysis of the Sustainable Water Supply System in
Buleleng Regency is;
1. How much is the availability and need of clean
water in Buleleng Regency
2. What is the strategy for a sustainable clean water
supply system in Buleleng Regency
1.3 Purpose
The purpose of this study was to obtain answers to the
problems presented, is:
1. Calculate the current and projected water supply
and demand in the future
2. Develop a clean water supply system strategy in
Bulelelng Regency
2 LITERATURE REVIEW
2.1 Sustainable Water Resources
Management
Sustainable urban development is development in an
effort to improve long-term social and ecological
health. Efforts to realize sustainable urban
development, namely to achieve livability for all city
residents. One of the embodiments is done through
the provision of piped water. Clean water service
through pipes is a basic need of the community which
greatly affects the smooth running of urban activities.
Water is an integral part of human life. The
unavailability of public infrastructure, namely the
provision of water through pipes is one of the poor
categories. Poor access to clean water as the main
infrastructure is a representation of the state's failure
to manage the public service sector (Erwin Nugraha,
2009).
2.2 Strategy Management
Strategic management is defined as a way to guide
companies to achieve a number of goals, including
corporate responsibilities, managerial capabilities, to
administrative systems related to strategic decision
making, and operations.Strategic management is a
series of fundamental decisions and actions from the
highest management, which are applied by all
members of an organization, for the realization of
organizational goals (Agrifa Masir. 2017).
2.3 Population
The calculation of the population is important,
because knowing the population of an area will be the
basis for making population policies at a certain time.
The province of Bali, which includes nine regencies
and cities, has a relatively varied population.
Population development in the province of Bali has
not been evenly distributed. As a result of the uneven
development of the region, especially related to the
development of the tourism industry sector,
community social centers, and government, which are
still in the district capital.
Calculation of the population using arithmetic,
geometric and least square formulas. To determine
the method used in each sub-district, the smallest
standard deviation value of the three approaches will
be determined. (
Minister of Public Works Regulation
2007).
2.4 Clean Water Development System
Part of a clean water distribution network system, are
the components that exist in a series of clean water
distribution network systems. These parts consist of
pipes and their connections, valves, pumps,
reservoirs, all of which must work properly.
Based on the instructions of the Integrated City
Infrastructure Development Program regarding
Guidelines for Planning and Technical Design for the
drinking water sector, it is stated that the raw water
sources that can be treated are springs, namely water
sources that are above the ground surface, shallow
wells, namely water sources resulting from
iCAST-ES 2021 - International Conference on Applied Science and Technology on Engineering Science
852

excavations or drilling depths. less than 40 meters
deep, deep wells, namely water sources from
excavation or drilling with a depth of more than 40
meters, rivers, namely water drainage channels
formed from upstream to empties into the sea or
lakes, lakes and water reservoirs, namely deep water
storage units a certain amount of which the water
comes from streams or rainwater reservoirs.
3 METHODOLOGY
3.1 Scope of Research
The scope of research on the Strategy of Sustainable
Water Supply System in Buleleng Regency, is:
1. Study of literature or review of relevant studies
related to the clean water supply system in
Bulelelng Regency
2. Survey of the current condition of the clean water
supply system
3. Analyzing the current availability and demand for
clean water and future projections
4. Determine the strategy for providing clean water
for Buleleng Regency
3.2 Data Source
The data source is a very important part related to the
validity of the data. With regard to the data to be
retrieved, the data that will be needed are as follows:
1. Demographic data of the population, socio-
cultural facilities and infrastructure, tourism,
industry.
2. Clean water supply system data in Bulelelng
Regency
3. Data on current sources of clean water in
Bulelelng Regency
4. Clean water quality and quantity data
3.3 Survey Method
1. Field survey to determine the state of the existing
network/system of drinking water facilities,
identify and inventory problems.
2. Survey of Clean water Supply System and
development plan.
3. Survey of clean water supply infrastructure, Sanih
Water system, Grokgak Dam system, Titab Dam
and Titab Dam clean water system development,
Tamblang Dam system
4. Measurement of water source discharge as a
Clean Water Supply System Development Plan in
Sanih Springs, Bulelelng Regency
3.4 Analysis of Clean Water
Availability
In calculating the mainstay discharge using the basic
year planning method. The planning base year is a
reliable debit pattern where the debit pattern has
actually happened in previous years. The mainstay
discharge calculation is intended to find the
quantitative value of the available discharge
throughout the year, in the dry season and in the rainy
season.
3.5 Population Analysis
Calculation of the population using arithmetic,
geometric and least square formulas. To determine
the method used in each sub-district, the smallest
standard deviation value of the three approaches will
be determined.(
Minister of Public Works Regulation
2007).
3.6 Clean Water Needs Analysis
The Directorate General of Human Settlements has
set the water usage standard for metropolitan cities of
190 liters/person/day, standard waterrequirements for
large cities at 170 liters/person/day, medium cities at
150 liters/person/day, and small cities at 130 liters
people. /day.
3.7 Water Balance
The water balance is intended to determine how much
potential is available each month, as well as how
much water is needed. The Water Balance will know
the months of surfing as well as the months that are
in deficit. Mathematically, the calculation method for
obtaining the residual water discharge in this water
balance analysis is the mainstay discharge minus the
demand discharge.
3.8 Clean Water Supply System
Strategy
The clean water supply system strategy is carried out
by means of a literature study, with the development
of the concept of sustainable water source
management, based on the condition of the current
system that has been running, taking into account the
Strategy Analysis of Sustainable Water Supply System in Buleleng Regency
853
sustainability of clean water supply in the future.
Inventory of existing clean water sources and clean
water sources that are in the process of being built
.
4 DISCUSSION RESULT
4.1 Population
The backward calculation of the population
projections of the nine sub-districts above shows that
the standard deviation of the geometric method has
the smallest standard deviation value. Population
projections for the nine sub-districts in 2020, 2025,
2030, 2035, and 2040 in Buleleng Regency using the
geometric method produce the population as shown
in the following table.
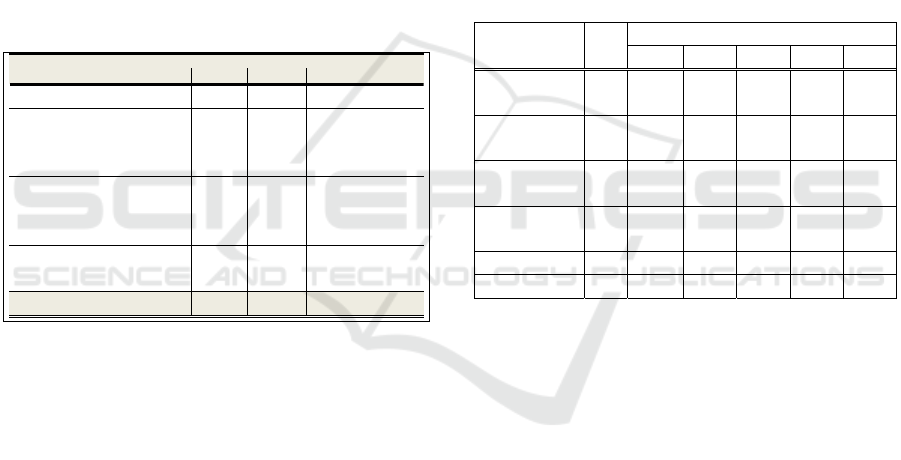
Table 1: Projected Population of Buleleng Regency 2020-
2040.
4.2 Water Potential
Buleleng Regency has potential water sources,
including:
1. Pangkung Dalem Spring with a capacity of 100
liters/sec,
2. Lamaman Springs with a capacity of 50 lt/sec,
3. Welding Springs with a capacity of 10 lt/sec,
4. Camplung Springs with a capacity of 10 lt/sec
5. Banjar Ancar Spring with a capacity of 4 lt/sec
6. Subuk Springs with additional discharge of 4.5
lt/sec
7. Ambengan Spring SPAM with a capacity of 3 lt/sec
8. Sanih Springs with a capacity of 50 lt/sec
Utilization of raw water sources is constrained by :
1. limited funds,
2. conflict of use with the interests of agricultural
irrigation
3. construction that is still in the process of
completion.
4.3 Clean Water Balance
The provision of clean water is planned to meet the
clean water needs of the population (domestic) and
public facilities, thus it is calculated by considering
factors that can support or cause an increase in the
need for clean water.
The drinking water needs of an urban area are
analyzed based on several considerations, namely, the
number of residents during planning until the end of
the planning year, and service targets. From the
considerations above, population is an important
factor in determining the policy for providing urban
infrastructure, including the need for drinking water.
Population parameters that must be observed include
the number, density, rate of increase and distribution.
Table 2: Current Clean Water Balance in Buleleng
Regency.
Provision of drinking water infrastructure, to meet
domestic needs or household needs for community
members, is also needed to meet water needs in
various urban facilities such as public facilities,
business or trade facilities as well as industrial needs
and special needs.
4.4 Development Strategy
Buleleng Regency experiences a shortage of clean
water in 2040 of 820.44 liters/second, assuming the
production capacity of PDAMs and Non-PDAMs
until 2040 is 887.43 liters/second, while the projected
water demand in that year is 1,707.87 liters/second.
second. To be able to meet these deficiencies, there
are several plans for a Clean Water Supply System
that can be developed in Buleleng Regency until
2040, including:
1. Titab reservoir with a capacity of 300 liters/second
to meet the needs of Western Buleleng
2. Tamblang reservoir with a capacity of 400
liters/second to meet the needs of Eastern Buleleng
Dis tricts
Projected population (person)
20 20 2025 2030 2035 2040
Gerokgak
85.730
89 .23 9
92.892
96 .69 5
100.6 53
Seririt
73.600
75 .58 2
77.618
79 .70 9
81.855
Busungbiu
41.210
41 .90 2
42.606
43 .32 1
44.049
Banjar
73.450
75 .68 8
77.995
80 .37 2
82.821
Sukasada
78.880
82 .38 6
86.047
89 .87 1
93.865
B u le le n g
139.570
14 4.9 57
150.551
156.361
162.3 96
Sawan
61.140
62 .37 1
63.627
64 .90 9
66.216
Kubutam bahan
56.150
57 .29 4
58.461
59 .65 3
60.868
Tejakula
54.270
54 .46 6
54.663
54 .86 0
55.058
Buleleng Reg ency
664.000
68 3.8 85
704.460
725.750
747.7 81
Description
Unit
Year
2020 2025 2030 2035 2040
Population Person 664.000
683.885
704.460
725.750 747.781
Water requirement
l/s
1.188,15
1.530,07
1.576,51
1.624,58
1.707,87
Production capacity
Local water company
l/s
761,00
761,00
761,00
761,.00
761,.00
Production capacity Non
Local Water Company
l/s 126,43 126,43 126,43 126,43 126,43
Current Total Availability l/s 887,43 887,43 887,43 887,43 887,43
Water Balance l/s -300,72 -642,64 -689,08 -737,14 -820,44
iCAST-ES 2021 - International Conference on Applied Science and Technology on Engineering Science
854
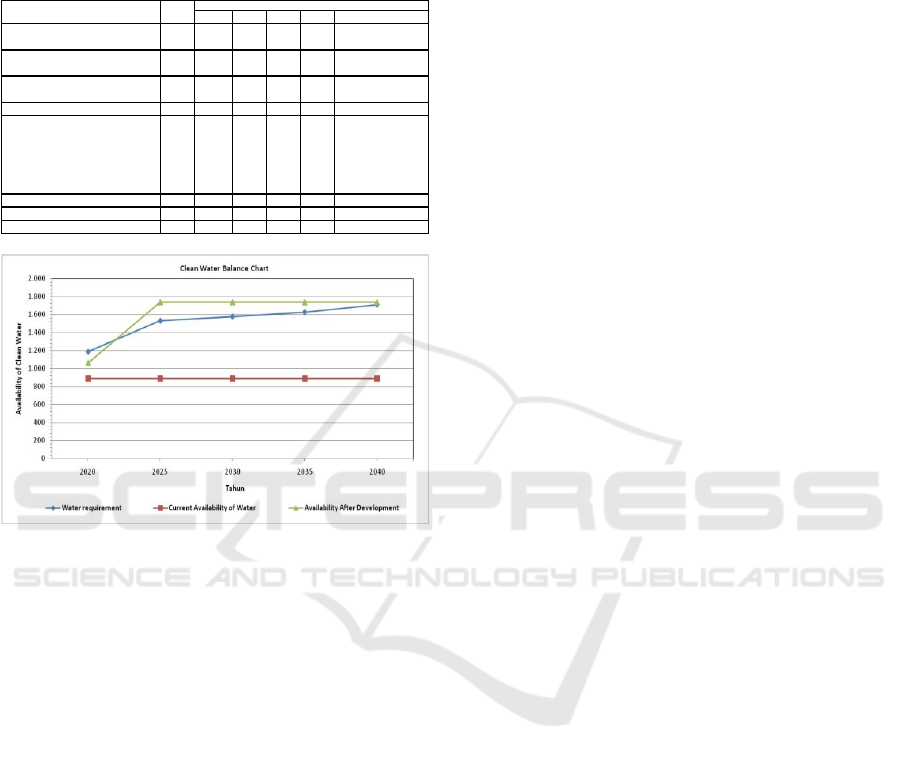
3. Tamblingan Lake with a capacity of 100
liters/second
4. Sanih Springs with a capacity of 50 liters/second
Table 3: Neraca Air Bersih Setelah Pengembangan.
Figure 1: Clean Water Balance Chart.
4.5 Clean Water Service Targets
The distribution of clean water service targets in
Bulelelng Regency is carried out by considering the
differences in character between each target. Clean
water service targets are grouped into five, namely:
1. Strategic Area
2. Super Commercial Area
3. Commercial/Urban Area
4. Rural Area
5. Remote Areas Vulnerable to Water
Villages with sustainability in social, financial,
environmental, institutional and technical aspects
have a very good level of sustainability, while
villages with sustainability in just one aspect have a
low level of sustainability. (Kamulyan, P.2017). The
sustainability of the Village Drinking Water
Company is influenced by the social capital and
human capital it has. The influencing social capital
factors are a network of strong social relationships,
trust, and regulatory norms, while the influential
human capital factors are motivation, commitment,
work team effectiveness and leadership (Andito Sidiq
Swastomo. 2020).
5 CONCLUSION
The conclusions of the research on Strategy Analysis
of Sustainable Water Supply System in Buleleng
Regency can be presented as follows:
1. The current availability of clean water in Bulelelng
Regency until 2040 is 887.43 l/sec, and the water
demand in Bulelelng Regency until 2040 is
1,707.87 l/sec, there is a water deficit in 2040 in
Bulelelng Regency of 820.44 l/sec.
2. To overcome the clean water deficit in Bulelelng
district, the strategies that need to be carried out
are, the development of the Titab Reservoir
SPAM of 300 l/s and the Tamblang Reservoir
SPAM of 400 l/s, Tamblingan Lake of 100 l/s,
Development of the Sanih Springs of 50 lt/sec.
3. The development of a clean water supply system
in Buleleng Regency will be able to meet the
needs of clean water until 2040, resulting in a
clean water surplus of 29.56 l/sec.
REFERENCES
Agarwa. (2000). Integarted Water Resources Managemen.
Tehnicel Advisory Commitee (TAC). Global Water
Parnership (GWP) Stokholo. Sweden, Home Page of
GWP www.gwpforum.org
Agrifa Masir. (2017) JISIP., Journal of Social and Political
Sciences. Vol 6. N0.2. PDAM Strategy in Improving
Clean Water Quality to Support Development in Batu
Tourism City.
Andito Sidiq Swastomo. (2020). Sukowati Research and
Development Journal, Community-Based Rural Water
Supply System Sustainability
Beecher, Janice A (1995). Integrated Resources Planning
Fundamentals. Journal of the American Water Works
Association (AWWA).
Central Bureau of Statistics of Buleleng Regency.(2020).
Buleleng Regency in Figures
Erwin Nugraha, (2009). Department of Planning
Engineering. Bandung Institute of Technology
Hehanusa PE. (2005). Spatial planning and carrying
capacity of water resources in the confined Beratan-
Buyan Tamblingan basin, Bali Province. Proceedings
of the Symposium Analysis of the carrying capacity and
capacity of water sources in the Tri-Lake Beratan,
Buyan and Tamblingan areas of Bali Province. Bali.
Kamulyan, P. Wiguna, I.P.A. and Slamet, A. 2017.
Assessment of the Sustainability of Community-Based
Drinking Water Supply System Management in Blitar
Description Unit 2020 2025 2030 2035 2040
Total population person 664.000 683.885 704.460 725.750 747.781
Total water requirement l/s
1.188,15 1.530,07 1.576,51
1.624,58
1.707,87
Production capacity Local water company l/s 761 761 761 761 761
Production capacity Non Local water company l/s 126,43 126,43 126,43 126,43 126,43
Current Capacity 887,43 887,43 887,43 887,43 887,43
Development Capacity
System Titab l/s 150 300 300 300 300
System Tamblang l/s - 400 400 400 400
Tamblingan Lake l/s - 100 100 100 100
Air Sanih Spring l/s 25 50 50 50 50
Total Development l/s
175 850 850 850 850
Total Capacity l/s
1.062,43 1.737,43 1.737,43 1.737,43 1.737,43
Water Balance l/s -125,72 207,36 160,92 112,85 29,56
Year
Strategy Analysis of Sustainable Water Supply System in Buleleng Regency
855

City. Ten November Institute of Technology Journal Of
Civil Engineering. Surabaya.
Nicholas S. Majluk dan Arnoldo C. Hax . Strategic
Management
Soemarto CD. (1999). Engineering Hydrology. Jakarta :
Erlangga.
Minister of Public Works Regulation No.18/PRT/M/2007.
(2007). Concerning Implementation of Drinking Water
Supply System Development.
iCAST-ES 2021 - International Conference on Applied Science and Technology on Engineering Science
856
