
Revealing the Popularity of Indonesian Local Government Mobile
Apps in Google Play Store
I Wayan Budi Sentana
a
, I Made Ari Dwi Suta Atmaja
b
and I Nyoman Gede Arya Astawa
c
Bali State Polytechnic, Bukit Jimbaran, Badung, Indonesia
Keywords: Mobile Apps, Popularity, Province Government, Number of Install, Number of Review, Score Rating.
Abstract: In this research, we revealed the popularity of mobile apps affiliated with the provincial governments in
Indonesia. To the best of our knowledge, this is the first study to conduct an empirical analysis related to this
area. In total, we found 283 mobile apps available on the Google Play Store and correlated to 32 province
governments in Indonesia. In this research, we scraped metadata of each provincial government-affiliated
apps available at the Google Play Store and gathered the information based on three indicators, including the
number of installs, number of reviews and score ratings. As a result, we found that 69.9% of mobile apps had
a number of installs smaller than 1000, 89% of mobile apps had reviews less than 100 and 50.2% of mobile
apps had scored less than 3. In addition, based on the popularity index that we defined, we found high
disparities in the popularity index among provinces in Indonesia. There is only 1 province that has a Popularity
index above 90, indicating that the popularity of mobile apps affiliated to the provincial government in
Indonesia is considered to be low. Hence, these results can be tailored as a reference for the provincial
government in determining the level of effectiveness and impact of an app when developing mobile-based
software in the future.
1 INTRODUCTION
Android consider being the most successful mobile
Operating System globally. This is based on the
number of mobile apps developed in this platform as
well as the market share of devices supporting this
platform around the world. Based on Statista, in July
2021, there were 2.8 million Android apps available
in Google Play Store (Statista.2021). This number
considers being the lower bound of total Android
apps available globally, because there are a number
of marketplaces other than the Play Store available,
including Xiaomi market, Tencent, LG and some
other marketplace related to the device vendors. In the
number of market share, Android recorded to have
around 86% of the total mobile platform in 2020, as
mentioned in (Samhi, Allix et al. 2021). The open
source model and the freedom to customize the
Android platform have made it easier for many
vendors to adopt this platform, thereby increasing the
a
https://orcid.org/0000-0003-3559-5123
b
https://orcid.org/0000-0002-1103-528X
c
https://orcid.org/0000-0003-1472-896X
compatibility of mobile apps on devices with a very
diverse range of technologies and prices.
This phenomenon attempting a lot of institution,
including the Indonesian province government, to
leveraging Android-based applications (apps) in
order to support their daily operations. In total, we
found 283 Android apps affiliated to 32 provinces
(except Maluku and North Maluku) available in
Google Play Store. These apps were developed for
several purposes including presentation recording,
policy dissemination, community aspiration
submission, and other citizenship services. However,
to the best of our knowledge, there has never been a
study showing the effectiveness of using these
government-owned applications.
A parameter that can be used to measure the
effectiveness of mobile apps is the level of popularity
of these apps for their users. Therefore, we conducted
an empirical study to review how popular mobile
apps belong to the provincial government in
Indonesia. In this study, we use the indicators
844
Sentana, I., Atmaja, I. and Astawa, I.
Revealing the Popularity of Indonesian Local Government Mobile Apps in Google Play Store.
DOI: 10.5220/0010955200003260
In Proceedings of the 4th International Conference on Applied Science and Technology on Engineering Science (iCAST-ES 2021), pages 844-850
ISBN: 978-989-758-615-6; ISSN: 2975-8246
Copyright
c
2023 by SCITEPRESS – Science and Technology Publications, Lda. Under CC license (CC BY-NC-ND 4.0)

available on the Google Play Store which include the
number of installs, the number of reviews and the
score rating. We create tools to scrape the metadata
and analyze the information contained in these
indicators. We also rank the level of popularity of
mobile apps among all provinces in Indonesia and
introduce a measurement method that we call the
Popularity Index.
We believed that this is the first empirical study to
measure the popularity of mobile apps affiliated to the
Indonesian province government. We also expect that
the result of this study can be used as a reference for
the province to make a policy in case of mobile apps
development in the future.
2 RESEARCH METHODS
To reveal the popularity of Indonesian province
government mobile apps, we followed six stage of
research as shown in Figure. 1. More detail of these
stages is explained in the following sub sections.
Figure 1: The six-stages of research methods to reveal the
popularity of Indonesian province government mobile apps
in Google Play Store.
2.1 Apps Fingerprinting
This stage is used to find mobile apps affiliated with
the provincial government in Indonesia in Google
Play Store app market. This stage is considered to be
challenging because we have to fingerprint apps from
the corpus of 2.8 million apps available on that app
market (NPM.2021). At this stage, we collecting the
apps candidate by identifying a certain keyword
(province’s name) appears in the Apps’ name or
Apps’ description as a conducted by (Sentana, Ikram
et al. 2021). For this purpose, we created Python
script and take advantage of the google-play-scraper
library developed in Java script by (NPM.2021). We
made a list of 34 provinces in Indonesia and used
them as keywords to be sent to the Google Play Store
Search Page. After the Google Play Store returns
search results for each keyword, we then scrap the
content page and collect information which includes
Apps ID, Apps name, and Apps Description.
We managed to collect 854 candidate apps that
corresponding to 34 keywords which are the name of
the province. This result is considered to be a coarse-
grained form of list, because any snippet word
contained in the Apps’ identifier that corresponded to
the keyword will be considered as candidates. For
example, when we search based on the keyword
"provinsi Maluku", then any Apps that have the
"Maluku" snippet in its name or description will be
considered as candidate Apps. Moreover, the search
result based on a province name often returns a
massive number of irrelevant data and overlap data
from one province to another. Hence, we did some
manual searching to get valid data in the process of
forming candidate apps list. This candidate then
filtered in the next stage.
2.2 Apps Filtering
This stage is used to manually filter the candidate lists
generated in the previous stage. For this purpose, we
analyse the name and description of each app on the
candidate list and determine the app's affiliation with
each provincial government. In a certain case, we
have to do cross validation to Play Store website to
get a comprehensive understanding on each candidate
apps in the list. This stage cannot be done
automatically, considering that determining app
affiliation to each province requires context
understanding based on apps description in the
metadata.
As this measurement intended for apps affiliated
to province government, we then exclude apps owned
by non-province governments, police departments,
courts, attorneys, and apps owned by representatives
of the central government located in each province.
The result of this stage is a list of App IDs that
correspond to each province in Indonesia. In total we
found 283 apps affiliated to 32 provincial
governments. Jakarta is listed as the province with the
highest number of Mobile Apps with 36 Apps,
followed by West Sumatra with 28 Apps. We were
unable to identify Mobile apps from Maluku and
North Maluku provinces. More detailed about the
number of apps per province can be seen in Table I.
2.3 Metadata Scraping
After the App ID list is obtained, the next step is to
scrape the metadata of each app. The Play Store
provides information related to apps which includes
the name, description, developer, number of installs,
score rating, number of reviews, and even the date of
the last update. For this purpose, we have modified
Apps
Fingerprinting
Apps Filtering
Metadata
Scraping
Metadata
Analysis
Popularity
Measurement
Result
Visualization
Revealing the Popularity of Indonesian Local Government Mobile Apps in Google Play Store
845

Python and Java Script at the Apps Fingerprinting
stage to collect information that matches the filtered
list of App Ids. To assess the popularity of an app, we
use three indicators including the number of installs
(I), the number of reviews (R) and the score rating
(S). The number of installs is an indicator of how
many times the app has been downloaded and
installed on the user's device. While the review is the
number of reviews from users of apps. The Play Store
allows users to provide reviews and provide a rating
in the form of a star rating which is worth 1 to 5, after
installing apps on their device. The aggregation
results from this user review used by Play Store to
create a rating score for each app.
Based on our observations, these three indicators are
appropriate parameters to measure the level of
popularity of Android apps, which is in this research
are Android apps that affiliated with provincial
governments in Indonesia.
2.4 Metadata Analysis
The next stage is to analyse the metadata that has been
collected. At the early stage of analysis, we sorted the
value of selected indicator metadata for each apps. By
the number of installs, we found "SAMBARA"
(id.go.bapenda.sambara) to be the most downloaded
and installed app of 3,862,879 times, followed by
"PIKOBAR Jawa Barat" (id.go.jabarprov.pikobar)
that installed in 957,898 devices. Both apps are
regulated by the West Java province government.
While the least installed app was recorded by
"Boyang Aspirasi Prov. Sulbar"
(com.thp.boyangaspirasi) that was installed by 32
users and owned by West Sulawesi province. By this
indicator, we found 198 (69.9%) province
government mobile apps in Indonesia were installed
less than 1000 times.
While by Review indicator, "SAMBARA" and
"PIKOBAR Jawa Barat" again showed their
domination by 10.539 and 4.130 number of reviews,
respectively. In opposite, we found 252 (89%)
province government apps that recorded only have
less than 100 reviews and 136 (48%) of the apps
recorded 0 reviews.
In addition to both indicators, we found 110
(38.8%) apps recorded Score ratings more than or
equal to 4, 31 (10.9%) apps recorded Score in the
range of 3 to less than 4, and 142 (50.2%) province
government apps recorded the Score rating less than
3. The range of those scores indicates that the apps
obtained positive, neutral and negative sentiment
respectively, as explained in the user-review analysis
conducted by (Tangari, Ikram et al. 2021).
The distribution of data on the ECDF score rating
looks more encouraging than the other two indicators.
The proportion of the number of ratings above 3
having a greater proportion than those below 3. There
are about 53% of mobile apps owned by the
provincial government get a positive score and the
rest are neutral or negative. A score rating of 3 is
considered to be neutral value, while values above are
considered to be positive and below are considered to
be negative (Tangari, Ikram et al. 2021).
To have an insight into the data distribution per
province, we then aggregate the value in each
indicator and group them by province. As a result, we
found West Java dominated the number of installs by
an average of 374,967.4 installs per app, followed by
Banten by 160,349.7 of average installed per app.
West Java recorded the highest value in the average
number of reviews by 1,304.3 and West Papua
recorded the highest average score ratings of 4.3,
even though West Papua only has 1 mobile app.
While the aggregation process also reveals the
fact that 15 (44%) of provinces recorded average
install rates less than 1000, 28 (82.3%) provinces
recorded average reviews less than 100, and 26
(76.4%) provinces recorded average score rating less
than 3. More detail about the aggregation result per
province can be seen in Table 1.
2.5 Popularity Measurement
As we use three indicators to measure the app's
popularity per province, then the next stage of this
research is to combine the value contained in all
indicators to form an index of average value per
province. Since the Install rate shows having a high
value among other indicators, then we normalized the
value of each indicator to avoid dominance by a
certain indicator.
For that purpose, we then introduce Popularity
index (Pi) by ranked the province apps popularity
based on the indicators explained previously. The Pi
then denoted as followed:
𝑃𝑖 = (𝐼 ̃ +𝑅 ̃ +𝑆 ̃)/𝑑 ∗ 100 (1)
𝐼
̃
represent the normalize form of average Install
rate for each province that resulted from min-max
normalization denoted as followed:
𝐼 ̃ = (𝐼_(𝑛 ) − 𝐼_𝑚𝑖𝑛)/(𝐼_𝑚𝑎𝑥 − 𝐼_𝑚𝑖𝑛 ) (2)
I
n
represent the value of install number for
corresponding apps, while I
max
and I
min
respectively
represent the maximum and minimum value in install
vector which is the highest and the lowest install rate
among all Apps. The similar operation is also
iCAST-ES 2021 - International Conference on Applied Science and Technology on Engineering Science
846

conducted to define 𝑅
dan 𝑆
that represent the
normalized form of average review and average score
respectively. Since we prefer to display the index in
range of 0 to 100, then we multiply the equation to
100 and divided it by the number of indicator (d).
Based on the calculation using Formula (1), we
found that West Java obtained the highest Pi of 97
from 14 apps affiliated to that province, followed by
North Sumatera with Pi of 38 obtained from 3 mobile
apps. Ironically, by using this index we found 33
provinces obtained Pi less than 50, indicating the high
disparity of apps popularity among provincial
governments in Indonesia. More detail about the Pi
obtained by each province can be found in Figure 2.
The Pi result was plotted in each province
Geolocation in the notation of x(y), where x represents
the Pi score and y represent the number of apps
regulated by each province.
2.6 Result Visualization
The last stage in this research is to visualize the results
of data analysis and popularity measurement into
geolocation image. The most challenging part of this
stage is to find the geolocation data of 34 province in
Indonesia. Most of the currently data available in the
Internet only consist of 33 provinces without North
Kalimantan. Fortunately, we found a link provide by
Kompas (Purba.2021) that directing us to the Shape
file of the newest Indonesian province geolocation.
Shape (SHP) file itself is a collection of files
containing geometry and index feature that represent
multiple dot based on longitude and latitude
coordinate of a certain area.
We then leveraging Geopandas library in Python
to convert the Shape file into GeoJson data so we can
merge it with the Popularity Index (Pi) and the result
from data aggregation per province. Then we
leveraging Matplotlib library to plot the index and
data on the top of geolocation data as shown in Figure
2. We also adding heatmap indicator (Blue color) to
represent the value of Popularity index on each
province.
As a takeaway for this stage, we provide the
Shape files and Geo Json files of Indonesian province
in our online repository and can be found in
https://github.com/budisentana/indonesian_mobile_a
pps.
3 RESULT AND DISCUSSION
Since the Apps Filtering stage, we have found
disparities in terms of mobile apps adoption among
all provinces in Indonesia. At this stage, we found that
the number of applications owned by the provinces in
the western and central parts of Indonesia was higher
than the provinces in the eastern part of Indonesia.
Surprisingly, we found West Sumatra have the
second largest number of mobile apps (28 apps) after
Jakarta. This number far exceeds the average
ownership of mobile apps by provinces on the island
of Sumatra.
On the other hand, the number of mobile apps
ownership by provinces in eastern Indonesia is
consider to be very low. Papua and West Papua have
4 and 1 apps respectively, East Nusa Tenggara only
has 2 apps and even Maluku and North Maluku have
0 mobile apps. This provides an overview of the
existing IT maturity levels in each province. This
phenomenon can be related to many factors including
the readiness of infrastructure and human resources
who manage these facilities.
During the metadata analysis stage, we found a high
gap of data in each indicator. In general, the
applications owned by the provincial governments in
Java and Bali relatively have a higher number of
installs and the number of reviews compared to
provinces in other islands. For example,
“SAMBARA” owned by West Java province has the
number of installs and the number of reviews,
respectively 3,862,879 and 10.539. If we compare
this apps to “RIC DPMPTSP”
(com.dalakriau.ricdpmptspriau) owned by province
of Riau, which only has 66 number of installs and 9
number of reviews, then the difference is very
significant. This presents its own challenges in the
data analysis stage, where we cannot directly present
the data and compare it between indicators in the
process of determining the popularity of mobile apps.
In this stage, we also reveal discouraging facts
related to data distribution on each indicator. We
found 69.9% of mobile apps were installed less than
1000 times, 48 % does not have any reviews, and 49%
have a negative score rating. This fact shows the low
willingness of citizens to use the facilities that have
been prepared by the government. The factors that
cause this are beyond the scope of this research.
However, from our observations, most of the existing
reviews show low maintenance of existing apps,
causing many problems and affecting the willingness
of citizens to use these apps. This can be very ironic
considering that we have found several applications
that are intended for public hearings to absorb
Revealing the Popularity of Indonesian Local Government Mobile Apps in Google Play Store
847
aspirations and accommodate public complaints.
With this condition, the purpose of developing these
mobile apps will not be achieved due to the low desire
of the people to use the applications provided by the
government.
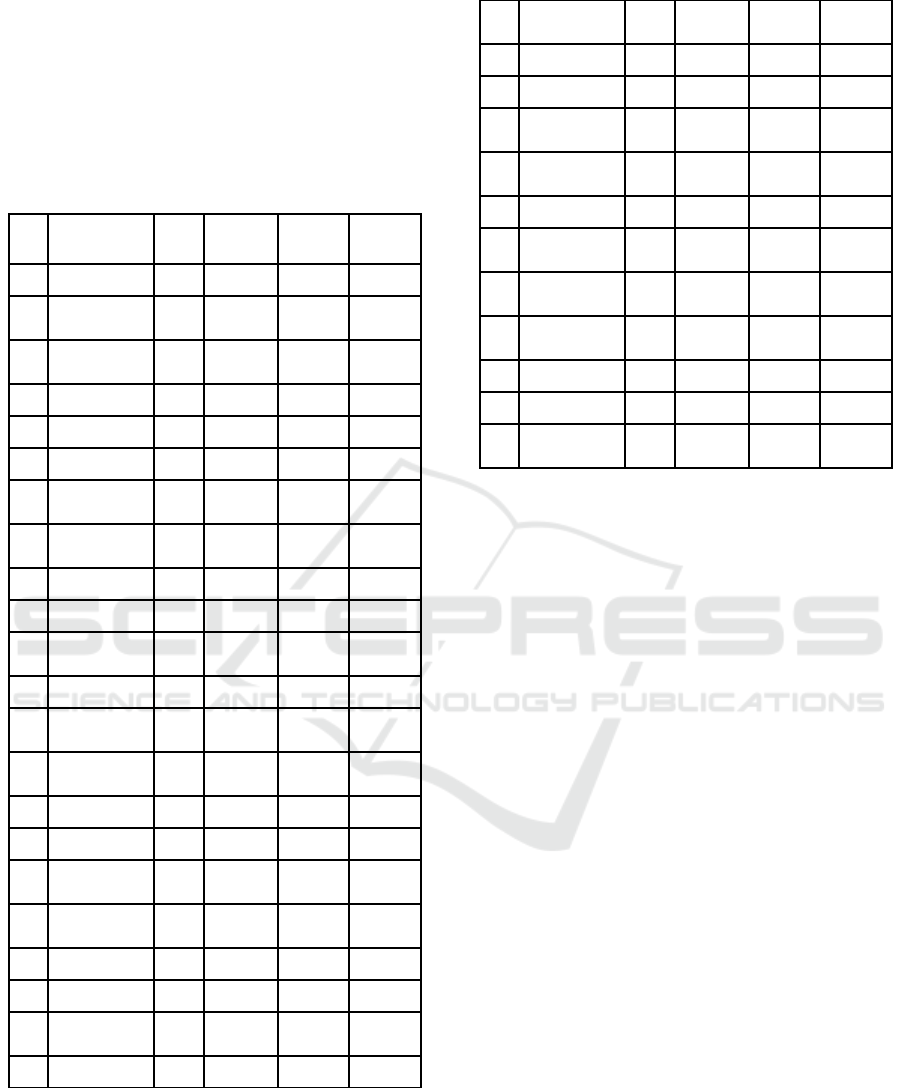
Table 1: Summary of Metadata Scraping of Indonesian
province government mobile apps, order by apps number
per province.
No
Province
Name
App
#
Average Average Average
Install Review Score
1 Jakarta 36 93107 400.4 3.3
2 West Sumatera 28 2225.7 9.1 1.9
3
South
Sulawesi
23 1625.3 12.7 1
4 Yogyakarta 19 27623.4 150.6 2.5
5 West Java 14 374967.4 1304.3 3.9
6 Riau 13 138.7 6.2 2.9
7
West Nusa
Tenggara
12 268.1 2.4 1.9
8
West
Kalimantan
12 9546.9 53.8 1
9 Bali 11 2944.9 7.1 1.9
10 Gorontalo 9 3072.2 27.8 1.3
11 West Sulawesi 9 293.8 6.9 1.6
12 Lampung 9 127.7 4.9 2.1
13
North
Kalimantan
8 1994.1 6.8 2.9
14
South
Kalimantan
6 5780.7 30 3.7
15 Riau Islands 6 24307 59.8 2.8
16 Aceh 6 3297.7 23.2 2.8
17
Central
Kalimantan
6 94.7 0.8 0.8
18
North
Sulawesi
6 32436 113.2 3.1
19 Bengkulu 5 844.8 5.8 1.5
20 East Java 5 436.6 2.4 2.7
21
South
Sumatera
5 329 1 0.9
22 Central Java 5 2731.6 17.6 3.4
23
East
Kalimantan
4 153.5 1.3 1.1
24 Jambi 4 166 0 0
25 Papua 4 3100.5 16.8 2.4
26
South East
Sulawesi
4 943.5 6.3 2.4
27
Central
Sulawesi
3 4604.3 31.3 3
28 Banten 3 160349.7 1050.7 0.9
29
North
Sumatera
3 13397.3 202.3 4
30
East Nusa
Tenggara
2 98 0 0
31
Bangka
Belitung
2 377.5 4 2.4
32 West Papua 1 7047 62 4.3
33 Maluku 0 0 0 0
34 North Maluku 0 0 0 0
In the Popularity Measurement phase, we are
tempted to include popular mobile apps, such as
Facebook or Instagram, as the upper limit of our
proposed popularity index calculation. However,
considering the low value of each indicator vector, we
are afraid that the results given will make the index
disparity even higher. Therefore, we only use the
highest value in each vector as the upper limit of the
calculation of this popularity index. For example, in
the install number vector, we use the highest number
of installs among all the applications in our research
corpus. Likewise, for vector indicators for the number
of reviews and score ratings.
The results of the popularity index calculation
presented in Figure 2 still show a high data disparity,
although only using the data in our corpus to
determine the upper limit of normalization. In the
picture, West Java has the highest heatmap level and
a popularity index of 97 obtained from 14
applications. However, 33 other provinces have a
popularity index below 50. This shows that the level
of popularity of mobile apps owned by West Java is
far above other provinces. This can be a benchmark
for other provinces when developing mobile-based
applications in the future.
iCAST-ES 2021 - International Conference on Applied Science and Technology on Engineering Science
848
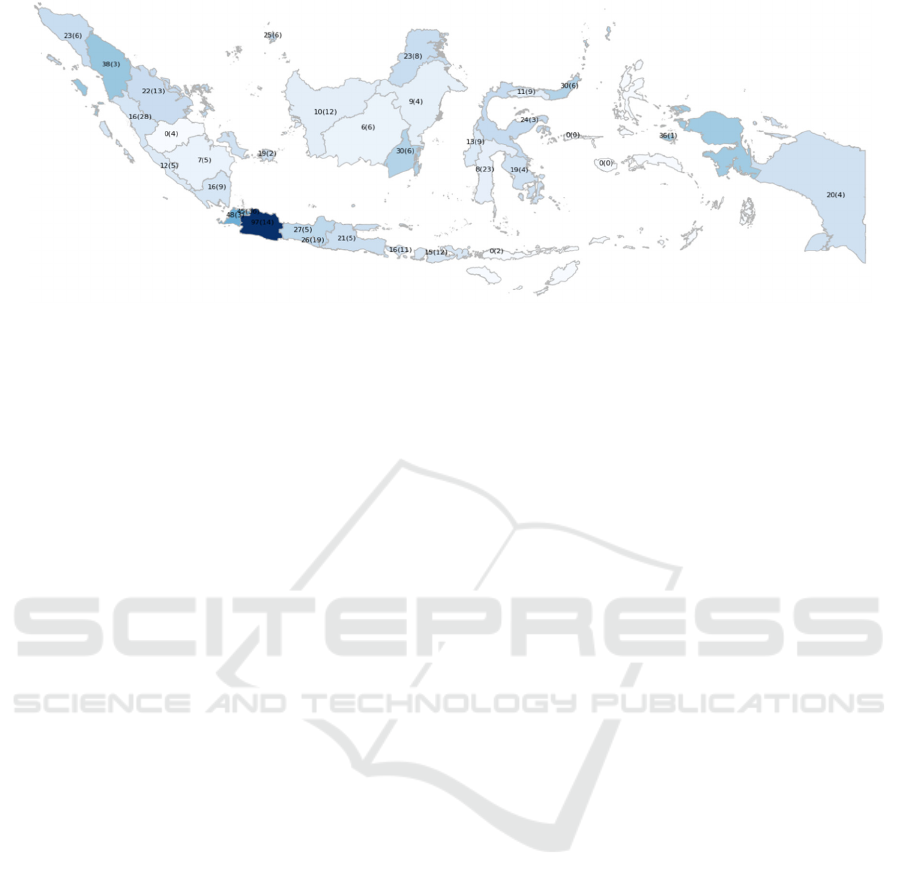
Figure 2: Popularity index (Pi) of Indonesian Local Government Mobile Apps per province. West Java has the Mobile Apps
with the most popular in Indonesia with 97 point obtained from 14 Apps. The data present in x(y) format where x represent
Pi and y represent the number of apps per province.
4 LIMITATIONS
We were attempted to analyse the Mobile Apps
affiliated with all District and City governments,
which is the second level of local government in
Indonesia. However, due to the massive number of
mobile apps that we found during the Fingerprinting
stage, we keep our focus on Province government
apps and preserve the result for our future works. We
are also considering analysing the sentiment from
each user review as conduct by (Tangari, Ikram,.et
all.2021), to determine the user's opinion related to
local government apps. For this purpose, we believe
the adoption of Natural Language Processing in
Bahasa Indonesia, such as in (Iswanto, Poerwoto.
2018) and (Manik, et all. 2017), would be useful for
our future works because most of the user review are
written in Bahasa Indonesia.
5 CONCLUSIONS
This is the first empirical study that reveals the
popularity of Indonesian province government
mobile apps. We are using three indicators including
the number of installs, number of reviews and score
ratings available at the Google Play Store. The
analysis result shows 69,9% of mobile apps affiliated
with the province government installed less than 1000
devices. While 89% of those apps have less than 100
reviews and 50.2% of those apps have a negative
score rating. In this study, we introduced a popularity
index to rank the popularity of mobile apps among
provinces in Indonesia. As a result, we found 33
provinces have a score less than 50. This result shows
that the Popularity of the Indonesian province
government is considered to be low.
REFERENCES
B. H,. Iswanto, and V., Poerwoto, Sentiment analysis on
Bahasa Indonesia tweets using Unibigram models and
machine learning techniques, 2018, IOP Conf. Ser.:
Mater. Sci. Eng. 434 012255
Manik, Putu & Putra, I & Giriantari, Ida & Sudarma, Made.
(2017). Fuzzy-Gibbs latent Dirichlet allocation model
for feature extraction on Indonesian documents.
Contemporary Engineering Sciences. 10. 403-421.
10.12988/ces.2017.7325.
Purba, N.,S., Download SHP Indonesia 34 Provinsi, SHP
Kabupaten, dan Kecamatan (article in Bahasa
Indonesia), https://www.kompasiana.com/nsaripurba/
5dda6c95097f364d44734282/shp-indonesia-34-
provinsi?page=1&page_images=1, last accessed : 28
August 2021.
Samhi, J., Allix, K., Bissyandé, T.F. et al. A first look at
Android applications in Google Play related to COVID-
19. Empir Software Eng 26, 57 (2021).
https://doi.org/10.1007/s10664-021-09943-x
Sentana, I.; Ikram, M.; Kaafar, M. and Berkovsky, S.
(2021). Empirical Security and Privacy Analysis of
Mobile Symptom Checking Apps on Google Play. In
Proceedings of the 18th International Conference on
Security and Cryptography - SECRYPT, ISBN 978-
989-758-524-1; ISSN 2184-7711, pages 665-673. DOI:
10.5220/0010520106650673
Statista, Number of available applications in the Google
Play Store from December 2009 to July 2021, avilable
online at https://www.statista.com/statistics/266210/
number-of-available-applications-in-the-google-play-
store/, last accessed : 28 August 2021.
Tangari, G., Ikram, M., Sentana, I.W.B., Ijaz, K., Kaafar,
M. A, Berkovsky, S., Analyzing security issues of
Revealing the Popularity of Indonesian Local Government Mobile Apps in Google Play Store
849

android mobile health and medical applications, Journal
of the American Medical Informatics Association,
2021, ocab131, https://doi.org/10.1093/jamia/ocab131
Tangari G, Ikram M, Ijaz K, Kaafar M A, Berkovsky S.
Mobile health and privacy: cross sectional study BMJ
2021; 373 :n1248 doi:10.1136/bmj.n1248
Neighbour Problem Manager (NPM), google-play-scraper,
available at : https://www.npmjs.com/package/google-
play-scraper, last accessed 29 August 2021
iCAST-ES 2021 - International Conference on Applied Science and Technology on Engineering Science
850
