
The Effect of Rebar Tie Fiber as a Concrete Mixture Material on
Compressive and Tensile Strength
Joko Suryono
a
and Yudi Pranoto
b
Civil Engineering Department, Samarinda State Polytechnic, East Kalimantan, Indonesia
Keywords: Rebar Tie Fiber, Compressive Strength, Tensile Strength, Concrete Mixture.
Abstract: Concrete is one of the construction materials made of a homogeneous mixture between cement, coarse
aggregate, fine aggregate, and water. Concrete is widely used in construction, both on bridges, roads,
buildings, and other constructions. The purpose of this study is to determine the differences of compressive
and tensile strength between normal concrete and concrete with rebar tie fiber. The addition of tie wire fibers
with a length 8 cm. Variations in the addition of rebar tie fiber 0%, 0.2%, 0.4%, 0.6%, 0.8%, and 1% form
material total weight. Concrete was tested at the age of 28 days. From the test results, it was found that the
highest compressive strength is 29.48 MPa with the addition of 0.8% rebar tie fiber. The compressive strength
increase 13.5% from normal concrete. The highest tensile strength is 7.39 MPa with the addition 0.8% rebar
tie fiber. The tensile strength increase 17.3% from normal concrete.
1 INTRODUCTION
Concrete is one of the construction materials made of
a homogeneous mixture between cement, coarse
aggregate, fine aggregate, and water. Concrete is
widely used in construction, both on bridges, roads,
buildings, and other constructions.
Concrete also has the advantage of high
compressive strength, resistance to fire and weather,
concrete mortar is easy to transport and shape
according to needs, and maintenance costs are quite
low. In addition to having the advantages of concrete
also has weaknesses such as tensile strength that is
much smaller than the compressive strength so this
makes concrete requires special treatment to
overcome the weaknesses in concrete.
This can be improved by the addition of steel
reinforcement or fibers consisting of certain
materials. Fiber materials that can be used to correct
concrete weakness according to the American
Concrete Institute (ACI) Committee 544 (2002) one
of which is steel fiber (rebar tie fiber).
The purpose of the study was to find out and
analyze the additional influence of Rebar tie fiber on
compressive and tensile strength.
a
https://orcid.org/0000-0001-8281-6692
b
https://orcid.org/0000-0003-2997-7475
Studies about rebar tie fiber concrete has been
conducted by An M Shende et al., 2012; Juliansyah et
al., 2019; Kolawole et al., 2013; Komal Chawla and
Bharti Tekwani, 2013; Ngudiyono., 2012;
Rajarajeshwari et al., 2013; Wahyono and Agustinus.,
2013, Widodo and Aris., 2012. The result of these
studies obtained that fibers can improve the
mechanical properties of concrete such as
compressive strength, tensile strength, shear strength,
bending strength, ductility, and shock resistance.
2 CHARACTERISTICS OF
CONCRETE
2.1 Concrete Volume Weight
The weight of concrete volume is a comparison
between the concrete Weight divided by concrete
volume. The weight of concrete volume is influenced
by the aggregate shape, aggregate gradation because
the weight of the concrete volume depends on the
weight of the aggregate volume. The weight of the
concrete volume is in an air dry state. The weight of
the volume is calculated using the following formula:
Suryono, J. and Pranoto, Y.
The Effect of Rebar Tie Fiber as a Concrete Mixture Material on Compressive and Tensile Strength.
DOI: 10.5220/0010954200003260
In Proceedings of the 4th International Conference on Applied Science and Technology on Engineering Science (iCAST-ES 2021), pages 821-827
ISBN: 978-989-758-615-6; ISSN: 2975-8246
Copyright
c
2023 by SCITEPRESS – Science and Technology Publications, Lda. Under CC license (CC BY-NC-ND 4.0)
821
γc = W/V
Where:
γc = Concrete volume weight (kg/m
3
)
W = Weight of test object (kg)
V = Concrete volume (m
3
)
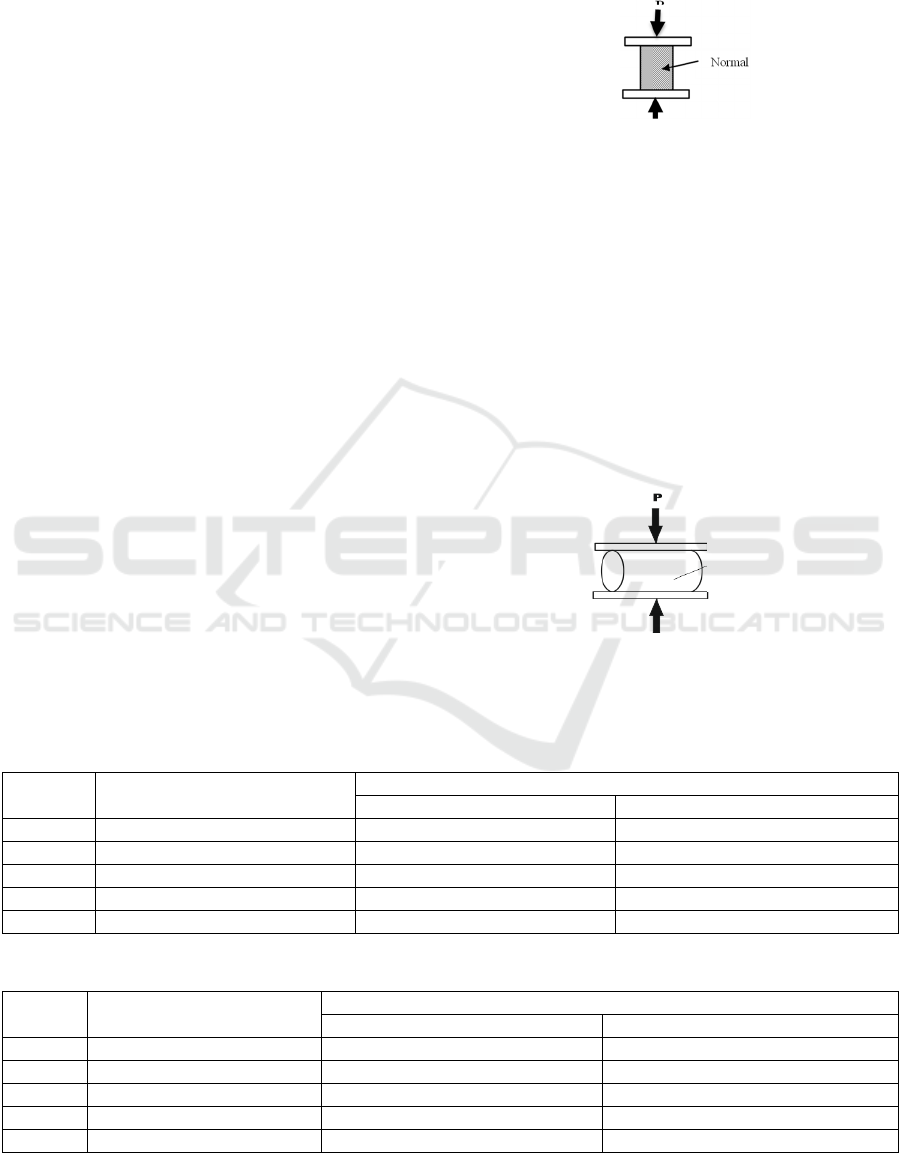
2.2 Concrete Compression Strength
Concrete Press is the magnitude of the load per unit
area, which causes the concrete test object to be
destroyed when weighed with a certain compressive
force, which is produced by the press machine. In the
testing of the strong concrete press, the test object can
be a cube and cylinder. The strength of the concrete
press is determined by material i.e. cement, coarse
aggregate, fine aggregate, and water. Strength
concrete press is the most important property of
concrete. Strength concrete press is usually related to
other properties, meaning when the concrete press is
high, the other properties are also good. According to
SNI 1974:2011 strong concrete press can be searched
with the following formula:
f’
C
= P/A
Information:
f’
C
= Strength concrete press (MPa)
P = Maximum compressive load (N)
A = Depressed cross-sectional area (mm2)
2.3 Concrete Tensile Strength
Tensile Strength tensile is one of the important
parameters in concrete strength. Tensile strength
values are obtained through laboratory press testing
by overloading each cylinder test object laterally to
Figure 1: Compression test.
its maximum strength. The test object used is a
cylindrical test object that is placed evenly in the
direction of diameter along with the test object. When
the tensile strength is reached then the test object will
be split in half (SNI 03-2491-2002). The tensile
strength can be calculated by the following formula:
f’
Ct
= 2P/LD
With:
f’
ct
= Concrete tensile strength (MPa)
P = Maximum load when the test object
is split (N)
L = Test object length (mm)
D = Diameter of the test object (mm)
Figure 2: Split Tensile Tes.
2.4 Use of Rebar Tie Fibers
Table 1: Requirement of Cube rebar Tie fibers test objects.
No
Rebar tie fibers (%) Re
q
uiremen
t
(g
r
)
One s
p
ecimen Five s
p
ecimen
1 0.2 19 95
2 0.4 38 190
3 0.6 57 285
4 0.8 76 380
5 1.0 95 475
Table 2: Requirement of Cylinder rebar tie fibers test objects.
No Rebar tie fibers (%) Re
q
uiremen
t
(g
r
)
One s
p
ecimen Five s
p
ecimen
1 0.2 10 50
2 0.4 20 100
3 0.6 30 150
4 0.8 40 200
5 1.0 50 250
Concrete
cylinder
iCAST-ES 2021 - International Conference on Applied Science and Technology on Engineering Science
822
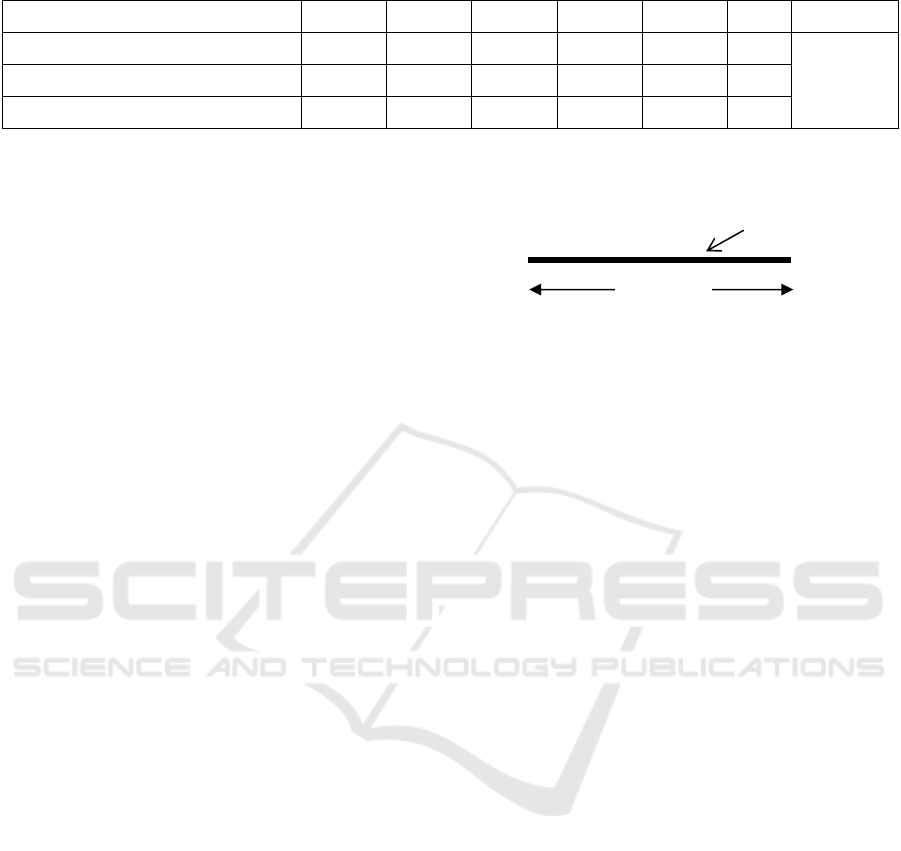
Table 3: Number of test object.
Rebar tie fibers (%) 0 0.2 0.4 0.6 0.8 1 Total
Compressive Strength 5 5 5 5 5 5
60
Tensile Strength 5 5 5 5 5 5
Number of test object 10 10 10 10 10 10
2.5 Statistical Analysis
In this study, statistical analysis was conducted to
determine the accuracy of data obtained from the
research that has been done. There are two methods
used in this study are ANOVA and regression
analysis. The ANOVA method is an analysis that tests
the average difference between groups. The
hypothesis used in this study is H
0
= the absence of a
significant influence between the addition of
connective wire fibers with the value of compressive
strength and tensile strength of concrete and H
1
= the
presence of a significant influence between the
addition of rebar tie fibers and the value of
compressive strength with the tensile strength of
concrete. H
0
applies if F count < F table while H
1
applies if F count > F table.
Regression analysis is one method in statistics to
measure the influence of free variables (x) on bound
variables (y). In this study, the free variable (x) was the
percentage of the addition of connective wire fibers
(%) whereas variable bound (y) is the value of
compressive strength and tensile strength of concrete.
The regression analysis in this study was used to
determine the contribution of variable x (percentage of
addition of rebar tie fibers) to variable y (value of
compressive strength and tensile strength of concrete).
3 METHODOLOGY
3.1 Research Location
The research site was conducted in the Laboratory of
Civil Engineering Department, Samarinda State
Polytechnic.
3.2 General
The research was conducted using experimental
methods in the laboratory with several stages.
Starting from the preparation of equipment and
materials, material inspection, mixed planning is
continued with the manufacture of test objects. The
shape and size of the fibers of the rebar tie fibers with
a straight variation with a length 8 cm can be seen in
figure 3.
Figure 3: Cross-section of rebar tie fibers.
3.3 Dimensions of the Test Object
Pressure force test objects in the form of cubes size
15 cm x 15 cm x 15 cm and cylindrical tensile
strength test objects with a diameter of 10 cm and
height of 20 cm. In this study, the total number of test
objects made as many as 60 pieces consists of 30
pieces of press force test objects and 30 pieces such
as Table 1. Testing of compressive strength and
tensile strength of concrete is performed after the test
object is 28 days old.
3.4 Mixed Design
The mix design between cement, water, and
aggregates -essential to obtain the desired concrete
strength. In this study the composition of concrete
mixture design using SNI 03-2834-2000 with the
planned strength of K-250 and 20 MPa Of Normal
Concrete. The fiber of the connecting wire is straight
with a length of 8 cm and a diameter of 1 mm (Figure
3).
3.5 Addition of Rebar Tie Fibers
Sowing the fibers evenly into a mixing tub containing
ordinary concrete mortar. Sowing fiber is done
carefully and cultivated fibers are spread evenly in the
concrete mortar so that there is no clumping of fibers
that can affect the strength of concrete fibers. The
amount of fiber added corresponds to the percentage
of predetermined variations (Table 1 and Table 2).
3.6 Test Object
At this stage is carried out concrete compression
testing and concrete tensile strength at the age of 28
80 mm
Ø 1 m
m
The Effect of Rebar Tie Fiber as a Concrete Mixture Material on Compressive and Tensile Strength
823
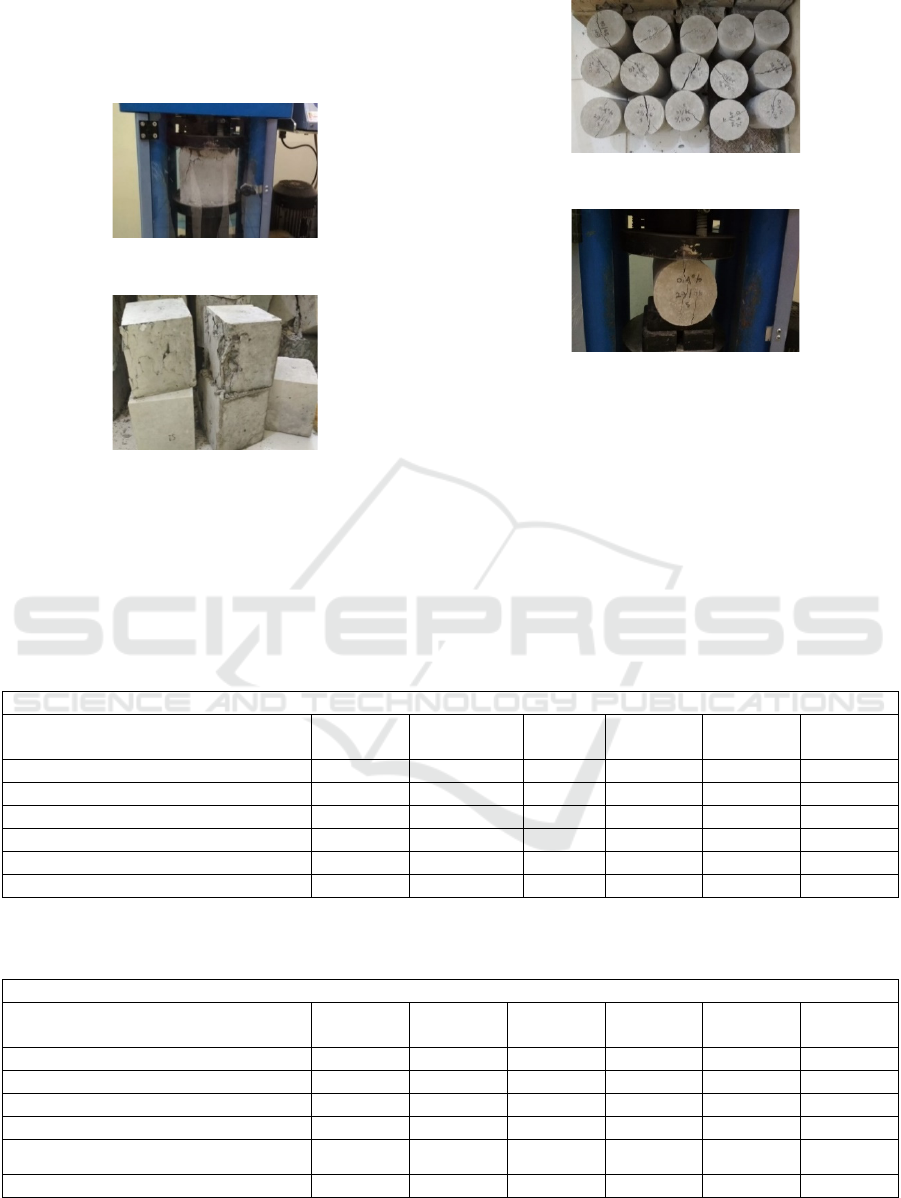
days because concrete at the age of 28 days has
maximum compressive strength. The procedure of
testing strong press refers to (SNI 1974-2011) and
strong pull refers to (SNI 03-2491-2002).
Figure 4: Concrete Press Test Equipment.
Figure 5: Concrete Cube Test Objects.
Figure 6: Split Test Equipment.
Figure 7: Split Dance Test Objects.
Based on the values obtained from the inspection
of materials to achieve a concrete quality of 20 MPa
with FAS 0.60 it takes a mixture composition as in
Table 4 and Table 5.
4 RESULT AND DISCUSSION
4.1 Composition Concrete Mixture
Table 4: Composition of Cylindrical Concrete Mixture.
Source: Research Results
Table 5: Composition of Concrete Cube Mixture.
Composition of Concrete Cube Mixture
5 Cubes concrete mix volume
15x15x15 = 0,0194 m
3
0 % 0.2 % 0.4 % 0.6 % 0.8 % 1.0 %
Cement (k
g
) 6.3 6.17 6.05 5.92 5.79 5.67
Water (k
g
/ltr) 3.5 3.43 3.36 3.29 3.22 3.15
Coarse Aggregate ½ (kg) 12.4 12.15 11.90 11.65 11.41 11.16
Coarse A
gg
re
g
ate 2/3 (k
g
) 12.1 11.85 11.62 11.37 11.13 10.89
Fine Aggregate (kg)
13.1
12.84 12.58 12.31 12.05 11.79
Rebar tie fibers (k
g
) 0 0.095 0.190 0.285 0.380 0.475
Source: Research Results
Composition of C
y
lindrical Concrete Mixture
5 cylinders concrete mixture volume
ϕ 10 x 20 = 0,0102 m
3
0 % 0.2 % 0.4 % 0.6 % 0.8 % 1.0 %
Cement (k
g
) 3.32 3.25 3.19 3.12 3.05 2.98
Water (kg/ltr) 1.80 1.76 1.72 1.69 1.65 1.62
Rou
g
h A
gg
re
g
ate ½ (k
g
) 6.53 6.39 6.27 6.14 6.00 5.87
Rou
g
h A
gg
re
g
ate 2/3 (k
g
) 6.38 6.25 6.12 5.99 5.87 5.74
Fine Aggregate (kg) 6.91 6.77 6.63 6.49 6.36 6.22
Rebar tie fibers (k
g
) 0 0.05 0.10 0.15 0.20 0.25
iCAST-ES 2021 - International Conference on Applied Science and Technology on Engineering Science
824
4.2 Slump Test
The result of making concrete samples conducted
using cement water factor (fas) = 0.6 produces a
diverse slump value with intervals between 30-60
mm. Slump test results can be seen in the following
table 6:
Table 6: Slump Value For Cube Test Objects.
No.
Slump Value (mm)
%
Cylinder Test Objects
Cube Test
Objects
1 0 45 45
2 0,2 40 40
3 0,4 40 40
4 0,6 40 40
5 0,8 35 35
6 1 35 30
Figure 8: Concrete Slump Test.
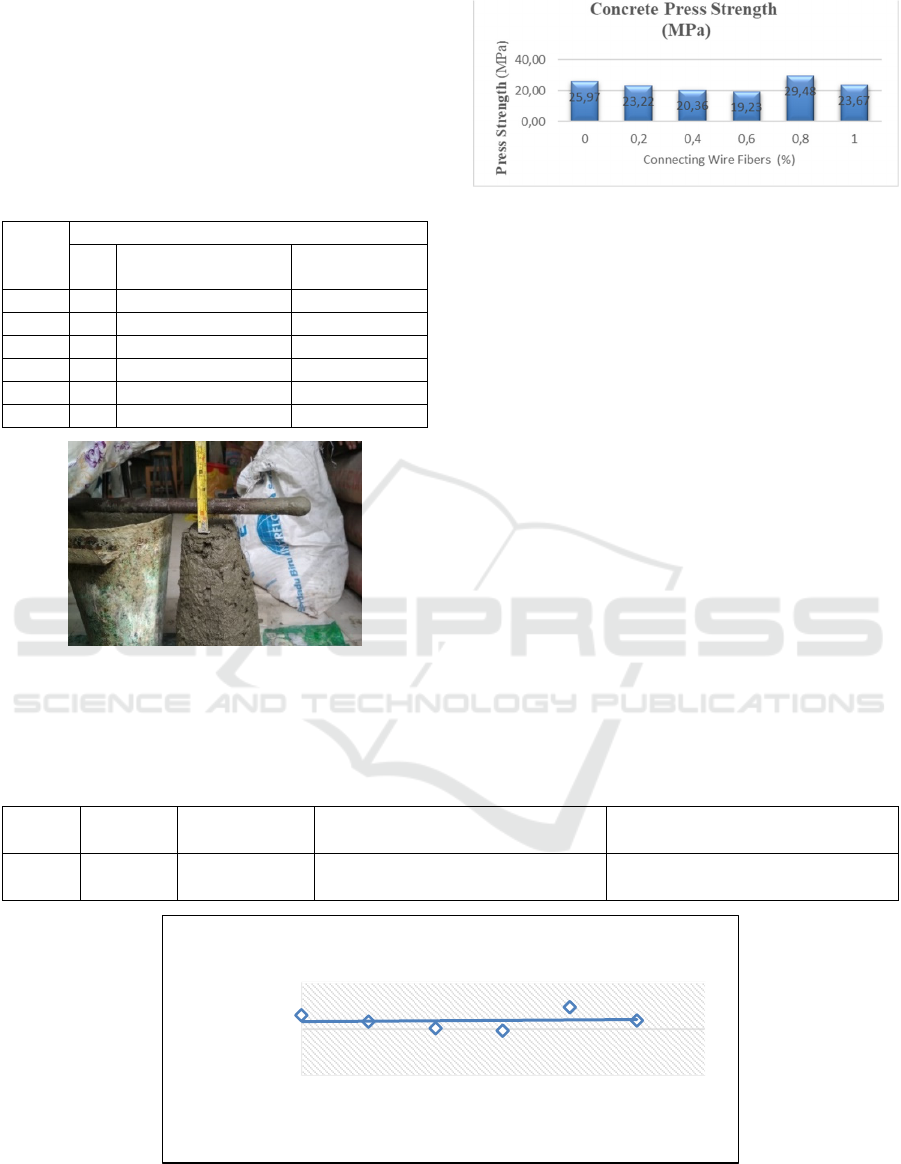
Based on Figure 9 of the test results obtained the
value of the compression strength at the percentage of
Figure 9: Concrete Press Strength Test.
the addition of rebar tie fibers 0% which is 25.97
MPa, then there was a decrease in the percentage of
the addition of rebar tie fibers 0.2% is 23.22. The
percentage of the addition of rebar tie fibers 0.4% is
20.36 MPa, the percentage of the addition of the
weight of rebar tie fibers 0.6% is 19.23 MPa. Then
the strong press increased at the percentage of the
addition of rebar tie fibers can be 0.8% is 29.48 MPa
and decreased again at the percentage of the addition
of rebar tie fibers 1% which is 23.67 MPa.
Based on Figure 10 R Square (R
2
) value of 0.008
means the amount of influence of the addition of rebar
tie fibers to the concrete press strength by 0.8%.
While the rest (100% - 0.8% = 99.2%) other variables
outside of research. Other variables in this study are
the lack of test objects, timeliness in the
manufacturing process, and temperature changes.
Based on Table 9 known value F count = 1,300
while F table = 7,709 which means F calculate < F
table then H0 received at signification level 0.05
means the addition of rebar tie fibers does not cause a
real change in the value of tensile strength.
Table 7: Average compressive strength analysis results.
N
o R R Square R Square Customize
d
Std. Estimation erro
r
1 0.88
a
0.008 -0.240 4.16463
Figure 10: Curve R Square Strength Press.
y = 0.8764x + 23.217
R² = 0.008
0,00
20,00
40,00
0 0,2 0,4 0,6 0,8 1 1,2
Compressive
Strength (MPa)
Connecting Wire Fibers (%)
The Effect of Rebar Tie Fiber as a Concrete Mixture Material on Compressive and Tensile Strength
825
Table 8: Compressive Strength Testing Analysis Results.
ANOVA
Variasi df
Kuadrat
Mean
F count F Table H0
Regression 0.540 1 0.540 0.031 7.709 receive
Residual 69.377 4 17.344
Total 69.917 5
4.4 Tensile Strength Test
Figure 11: Concrete Tensile Strength Test.
Table 9: Tensile Strength Testing Analysis Results.
ANOVA
Variasi df Kuadrat Mean F count F Table H0
Regression 0.905 1 0.905 1.300 7.709 receive
Residual 2.786 4 0.697
Total 3.691 5
(source: SPSS)
Based on Figure 11 obtained the value of R Square
(R2) of 0.246 which means the magnitude of the
influence of the addition of connecting wire fibers to
the concrete press strength by 24.6%. While the rest
(100% - 24.6% = 74.4%) other variables outside of
research. Other variables in this study are the lack of
test objects, timeliness in the manufacturing process,
and temperature changes. Based on Table 10 known
value F count = 1.300 while F table = 7.709 which
means F calculate < F table then H0 received at
signification level 0.05 means the addition of rebar tie
fibers does not cause a change in the value of the pull
force in real.
5 CONCLUSIONS
From the results of research conducted on the
variation of connective wire fiber mixture 0%. 0.2%.
0.4%. 0.6%. 0.8% and 1% can be concluded as
follows:
• From the test result of concrete press
strength decrease occurred at 0.2% = 23.22
MPa. the addition of rebar tie fibers 0.4% =
20.36 MPa. the addition of rebar tie fibers
0.6% = 19.23 MPa then increased at the
addition of rebar tie fibers 0.8% = 29.48
MPa and decreased again at the addition of
6,30
5,68
4,86
6,49
7,39
6,54
0,00
5,00
10,00
0 0,2 0,4 0,6 0,8 1
Tensile Strength (MPa)
Connecting Wire Fibers (%)
Tensile Strength (MPa)
iCAST-ES 2021 - International Conference on Applied Science and Technology on Engineering Science
826

rebar tie fibers 1% = 23.67 MPa to normal
concrete of 25.97 MPa.
• From the test result of concrete tensile
strength the decrease occurred in the
addition of rebar tie fibers 0.2% = 5.68 MPa.
the addition of rebar tie fibers 0.4% = 4.86
MPa. then increased at 0.6% = 6.49 MPa.
increased the addition of rebar tie fibers
0.8% = 7.39 MPa and again decreased at the
addition of rebar tie fibers 1% = 6.54 MPa to
normal concrete with a tensile strength of
6.30 MPa.
• From the results of statistical analysis on
compressive strength obtained the value of
R Square (R2) = 0.008 and Anova obtained
H0 received then there is no significant
influence between the addition of rebar tie
fibers with the value of compressive
strength.
• From the results of statistical analysis on the
tensile strength of concrete tensile obtained
the value of R Square (R2) = 0.246 and
Anova obtained H0 received then there is no
significant influence between the addition of
rebar tie fibers with the value of I pull
concrete..
REFERENCES
ACI Committee 544. 2002. State of the Art Report on Fiber
Reinforced Concrete. Report:ACI 544.IR-96. American
Concrete Institute. Detroit. Michigan.
An M Shende.. A M Pande.. M Gulfam Pathan.. 2012.
Experimental Study on Steel Fiber Reinforced Concrete
for M-40 Grade. International Refereed Journal of
Engineering and Science (IRJES). Vol. 1 Issue 1. P.
043-048.
Juliansyah Astari Kawulusan. H. Manalip. Servie O. Dapas.
2019. Pemeriksaan Kuat Tarik Belah Beton Serat
Kawat Ikat Dengan Variasi Sudut Tekuk Pada Kedua
Ujungnya. Jurnal Sipil Statik. Vol. 7. No. 5 Mei 2019.
p. 513-525. ISSN : 2337-6732.
Kolawole Adisa Olanade. Adewale Donyinsola. Alake.
Abiola Gabriel. Morakinyo. 2013. Strength
Development and Crack Pattern of Coconut Fiber
Reinforced Concrete (CFRC). Civil Environment
Research. Vol. 4.
Komal Chawla. Bharti Tekwani. 2013. Studies of Glass
Fiber Reinforced Concrete Composite. International
Journal of Structural and Civil Engineering Research
ISSN 2319-6009 Vol. 2 No. 3.p. 176-182.
Ngudiyono.. 2012. Metode Perbaikan Tegangan Geser
Beton Dengan Fiber Kawat Ikat. Jurnal Teknik
REKAYASA. Vol. 13 No. 1. p. 44-54.
Rajarajeshwari B. Vibhuti.. Radhakrisna.. Aravind N..
2013. Mekanical Properties of Hybrid Fiber Reinforced
Concrete For Pavements. International Journal of
Research in Engineering and Technology. eISSN:
2319-1163. pISSN: 2321-7308.
The Effect of Rebar Tie Fiber as a Concrete Mixture Material on Compressive and Tensile Strength
827
