
Equilibrium Model and Adsorption Kinetics of Methylene Blue with
Kluwak Shell Carbon
H. R. Yuliani
a
, A. Musfirah A., Isma Ayu N. P. Z., Ida Adriani I. and Haera Setiawati
Chemical Engineering Department, Politeknik Negeri Ujung Pandang, Perintis Kemerdekaan KM 10 Tamalanrea
Makaassar, Indonesia
Keywords: Dsorption, Methylene Blue, Kinetics, Langmuir, Pseudo Second Order.
Abstract: This study aims to determine the equilibrium model and adsorption kinetics of methylene blue (MB) solution
using kluwak shell carbon (KTK) both activated and without activation. Equilibrium adsorption was carried
out on a volume of 50 ml of methylene blue at 9 concentrations of MB 80, 90, 100, 110, 120, 125, 130, 140
and 150 ppm, 0.15 g KTK, 90 min with a shaker speed of 300 rpm. Process kinetics, volume 400 ml
concentration of 100 ppm, 1.2 g KTK, MB for 105 minutes, sampling interval 15 min, stirrer speed 300 rpm.
The adsorption equilibrium model are Freundlich and Langmuir, while the kinetic model are Pseudo First
Order and Pseudo Second Order. Determination of both the equilibrium and kinetic models are determined
by the larger correlation coefficient (R
2
). The calculation of these two models are based on the equilibrium
concentration (Ce) and a certain time concentration (Ct) measured using UV-VIS at a wavelength of 662 nm,
the absorbance is converted to Ce or Ct with the standard curve equation MB. The results showed that the
equilibrium adsorption and kinetics of MB using KTK and KTK 3M KOH followed the Langmuir equilibrium
and Pseudo Second Order kinetics. MB adsorption equilibrium 𝑞
.∗.
..
, R
2
0.8020 and kinetics
.∗ .²
.
𝑡, R
2
0.9853 at unactivated KTK. KTK 3M KOH 𝑞
.∗.
..
), R
2
0.9932 and
.∗ .²
.
𝑡, R
2
0.993.
1 INTRODUCTION
Methylene blue is a dye that is often used in the textile
industry for dyeing and the craft industry. Disposal of
methylene blue solution waste has a negative impact
when exposed to contact with humans and the
environment so that a technique is needed to remove
the content or concentration of industrial waste
(Yuliani, et al., 2019). Adsorption is one method that
is often used in waste treatment aimed at reducing or
eliminating contaminants. This method is quite easy
to apply in wastewater purification by using an
adsorbent that functions to absorb dye compounds
(adsorbates) contained in industrial waste. The
adsorbents that are often used are activated carbon,
silica, alumni, but they are expensive, so it is
necessary to study alternative adsorbents that are
relatively inexpensive and environmentally friendly
(Rohaizar, 2013). Kluwak shell is a sheath of kluwak
a
https://orcid.org/0000-0002-5420-3175
meat which after being taken as rawon seasoning then
this shell will become for the environment. Based on
the composition of kluwak shell contains cellulose,
hemicellulose, and XRD results contain Ca so that it
can be used as an adsorbent. The performance of the
adsorbent is enhanced through carbonization which is
then activated. Activated carbon has a large surface
area due to the presence of pores formed during
carbonization by evaporating volatiles in the material.
This increase in carbon can be further increased
through physical and chemical activation. In this
study, it was carried out by activating kluwak shell
carbon with KOH which aims to bind dirt and
dissolve volatile substances during carbonization,
both of which dissolve and are wasted during
washing. The variables studied were how the effect of
3M KOH activation on kluwak shell carbon on
performance with adsorbents in the form of the
maximum adsorption capacity (qm), the amount of
adsorbent adsorbed at equilibrium conditions in
800
Yuliani, H., A., A., Z., I., I., I. and Setiawati, H.
Equilibrium Model and Adsorption Kinetics of Methylene Blue with Kluwak Shell Carbon.
DOI: 10.5220/0010953900003260
In Proceedings of the 4th International Conference on Applied Science and Technology on Engineering Science (iCAST-ES 2021), pages 800-805
ISBN: 978-989-758-615-6; ISSN: 2975-8246
Copyright
c
2023 by SCITEPRESS – Science and Technology Publications, Lda. Under CC license (CC BY-NC-ND 4.0)
determining the equilibrium model and the adsorption
kinetics of methylene blue. The adsorption
equilibrium model that will be studied is the
Freundlich and Langmuir equations. The Freundlich
equation describes heterogeneous adsorption which
shows multilayer with a constant value of 'n' while the
Langmuir equation describes monolayer adsorption
and the value of adsorption capacity (qm). Adsorption
equilibrium equations (Do, 1998) and (Mohit, Sunil,
Shraddha, & Pradeep, 2019).
Freundlich Equilibrium
qe = kf. Ce1/n (1)
qe is the amount of adsorbate adsorbed (mg/g), kf is
the Freundlich constant (l/mg), and n describes the
adsorption intensity parameter in the Freundlich
model.
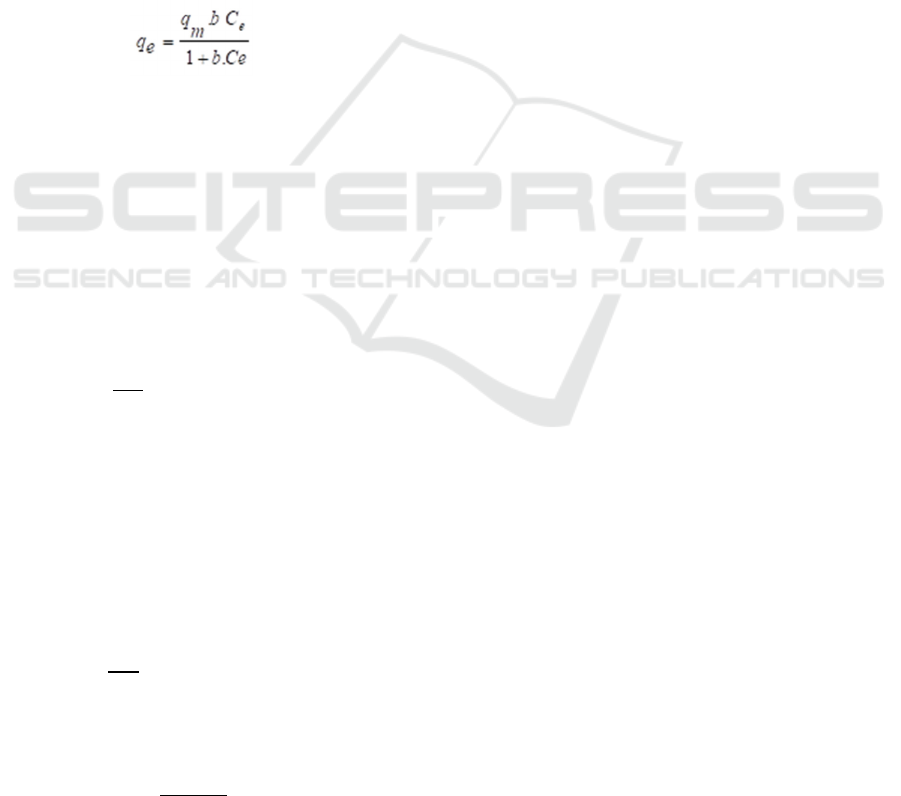
Langmuir Equilibrium
(2)
qm is the maximum adsorption capacity (mg/g), b is
the Langmuir constant (l/mg).
The adsorption speed of the adsorbate by the
adsorbent is determined by two models, namely
Pseudo First Order (PFO) and Pseudo Second Order
(PSO).
Pseudo First Order Kinetics
This model was first proposed by Lagergen
(Lagergren, 1989) which is shown in Equation (1).
Pseudo-first order drawing adsorption occurs
physically through the pores of the adsorbent.
𝑑𝑞𝑡
𝑑𝑡
𝑘1
𝑞𝑒 𝑞𝑡
(3)
k1(1/min) rate constants are all order one and qt is the
amount of adsorbate adsorbed per gram of adsorbent
at the time of sampling interval (mg/g).
Second Order Pseudo Kinetics
Pseudo-second-order (quasi-second order) shows the
adsorption capacity proportional to the number of
active sites of the adsorbent. The pseudo equation is
shown in Equation (4).
𝑑𝑞𝑡
𝑑𝑡
𝑘2
𝑞𝑒 𝑞𝑡
(4)
k2(g.mg-1min-1) pseudo second order adsorption
rate constant. qt is obtained using Equation (5)
𝑞𝑡
𝐶𝑜 𝐶𝑡
𝑚
𝑥 𝑉𝑎
(5)
Va (L) is the volume of the adsorbent and m is the
mass of the adsorbent (g).
The selection of the appropriate equilibrium
equation model and adsorption kinetics is based on
the correlation coefficient value that is greater than or
close to the value 1.
2 METHODOLOGY
The research was carried out in the department of
chemical engineering and batch and continuous
processes. Analysis in the Laboratory of Chemical
Engineering Instruments at the State Polytechnic of
Ujung Pandang.
A. Materials
The kluwak shell comes from Soppeng Regency.
Methylene Blue (Merck), 98% KOH (Merck),
filter paper, and Aquadest.
B. Equipment
Erlenmeyer, Beaker, Measuring flask, Measuring
flask, Funnel, Sample Tube, sample vial, Shaker,
Three-neck flask, Centrifuge tube, Magnetic
hotplate, Motor, Stative, Stirrer, Rotary
Centrifuge, Oven, and UV-VIS Spectrometer.
C. Procedures
1. Activation
Kluwak shell carbon was immersed in 3M KOH
(KTKA-3M) in a 1000 ml Erlenmeyer according to
the concentration at a ratio of 1: 4, stirred using a
magnetic stirrer at 80oC for 4 hours and allowed to
stand for 24 hours. The activated kluwak shell
carbon was separated by filtering and the cake was
washed using distilled water until the filtrate was
neutral in pH. The wet KTKA -3M was dried in an
oven at 105
o
C.
2. Adsorption
50 mL of MB solution with concentrations of 80, 90,
100, 110, 120, 125, 130, 140, and 150 ppm were
added to a 100 mL Erlenmeyer and labeled 1-9. Add
each Erlenmeyer as much as 0.15 grams of kluwak
shell carbon (KTK), then placed and arranged in a
shaker. Turn on the shaker, set the time to 90
minutes and the shaker speed to 300 rpm. The
sample was put in a centrifuge tube and placed into
a rotary centrifuge, speed of 500 rpm for 10 minutes.
Filter samples 1-9 using a funnel and filter paper, the
filtrate obtained is then put in a bottle and labeled.
*) Same treatment for KTKA-3M.
3. Kinetics
• Methylene Blue Concentration: 100 ppm
• 400 ml of 100 ppm methylene blue solution was
put into a neck flask 3 then added 1.2 grams of
kluwak flour then while stirring with a stirrer
Equilibrium Model and Adsorption Kinetics of Methylene Blue with Kluwak Shell Carbon
801
speed of 300 rpm for 105 minutes and every 15
minutes a sample was taken. The MB solution
and adsorbent were centrifuged at 500 rpm for
10 minutes and then filtered. The filtrate was
then tested using UV-VIS Spectrophotometer.
4. Analaysis
The filtrate from UV-VIS test results will get
absorbance converted to concentration. The
adsorption shows the concentration (Ce) for 90
minutes and the concentration kinetics every time
according to the duration (Ct) MB, namely
various taking times every 15 minutes for 105
minutes, wavelength 662 nm.
The test results in the form of initial concentration
(Co), equilibrium concentration (Ce) and
concentration at time t (Ct) were then processed
to determine the equilibrium model and
adsorption kinetics of methylene blue solution
using KTK and KTKA-3M.
3 RESULTS AND DISCUSSION
A. Standard Curve Determination
The standard curve is made from a series of
standard solutions which are still within the
linearity limits so that they can be linearly
regressed. The purpose of making a standard
curve is to determine Co, Ce and Ct in the test
solution with the "x" axis is the concentration and
the "y" axis is the absorbance. The equation y =
mx + c. Methylene blue has a wavelength of 662
nm with MB 0, 1, 2, 3, 4, and 5 ppm
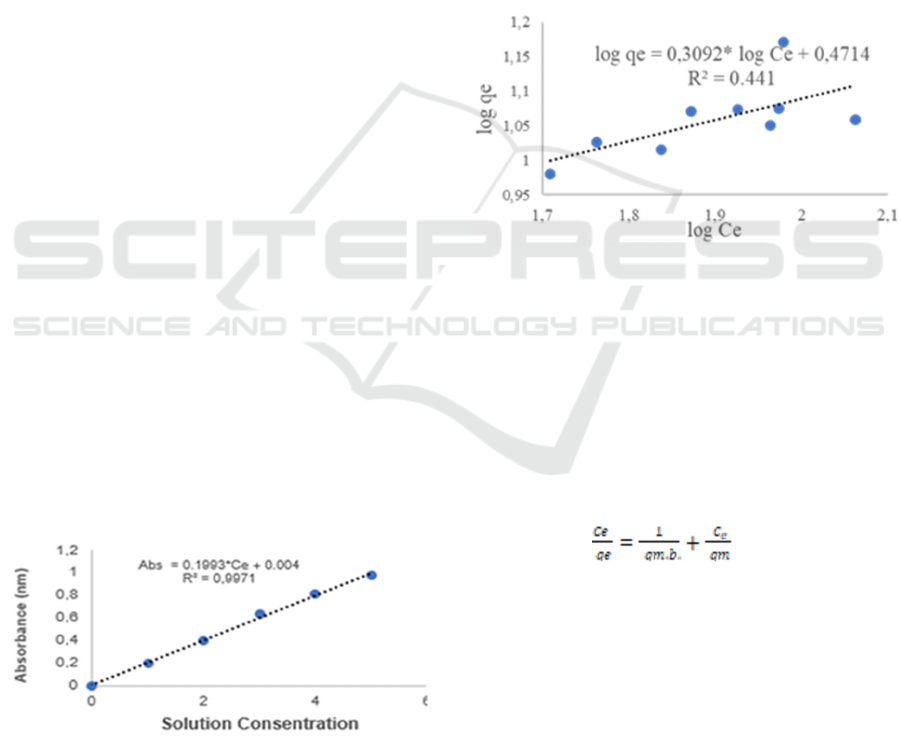
concentrations tested. The test results obtained the
equation Abs = 0.1993*Ce + 0.004 with R_Square
0.9971 close to 1 which indicates that the equation
is accurate as shown in Figure 1. Ce is at
adsorption equilibrium and Ce is replaced by Ct
when calculating the adsorption kinetics.
Figure 1: Standard Curve.
B. Adsorption Equilibrium Model
Equilibrium model testing is carried out to
determine the appropriate equilibrium model to be
used in a study. The determination of the
equilibrium model depends on the value of the
correlation coefficient (R
2
). The appropriate
equilibrium model is an equilibrium model with a
value of R2 that is higher or closer to 1 (Tan &
Ahmad, 2007).
1. Freundlich's Equilibrium Model
Equation (1) is linearized so that the equation is
obtained:
Log qe = log kf – 1/n* log Ce (6)
The values of kf and n are obtained by graphing
the relationship between log qe (y) and log Ce (x).
Slope = 1/n and Intercept (log kf), shown in Figure
2.
Figure 2: Log qe Vs Log Ce.
The correlation coefficient is 0.441 for the
Freundlich equation on CEC so that it is
concluded that it does not meet.
2. Langmuir Equilibrium Model
The Langmuir equation shows the maximum
amount that can be absorbed by the adsorbent
(qm), the calculation is carried out linearly in
Equation (2).
(7)
The relationship of Ce/qe (y) to Ce (x) is obtained
with a slope of 1/qm and an intercept (1/(qm*b)
so that the values of b and qm are obtained. The
illustration is shown in Figure 3.
iCAST-ES 2021 - International Conference on Applied Science and Technology on Engineering Science
802
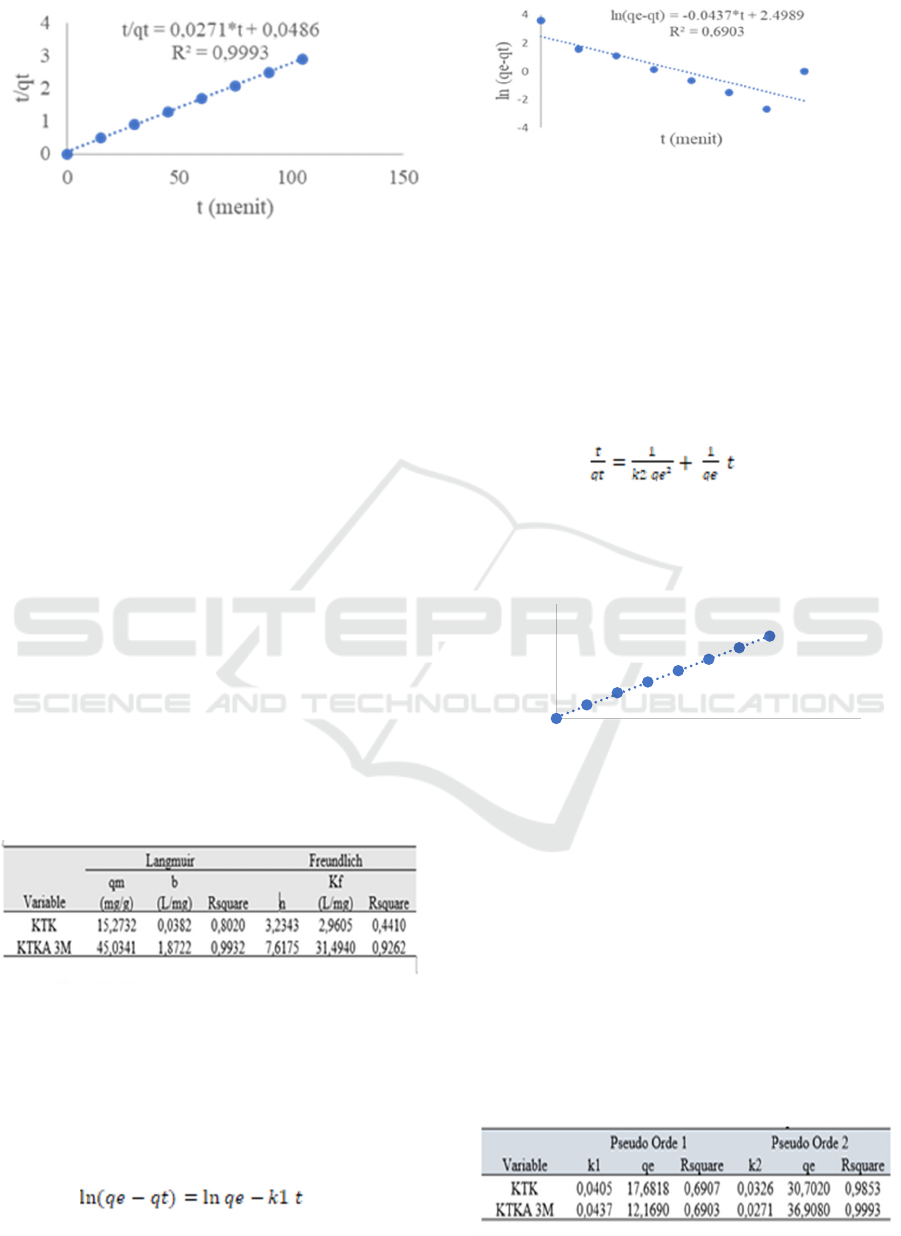
Figure 3: Ce/qe VS Ce of KTK.
The linearization of Equation (7) and Figure 3
shows that the value of R
2
at the Langmuir
equilibrium is higher than the Freundlich
equilibrium. The KTKA-3M and CEC are shown
in Table 1. The balance of methylene blue
adsorption using CEC and 3M KTKA following
the Langmuir equation is shown by a correlation
coefficient that is greater than the Freundlich
equation according to Table 1.
Activation increases the adsorption capacity of the
adsorbent with the value of qm increasing three
times (3x) than kluwak shell carbon without
activation. This indicates that the activation
increases the performance of the adsorbent with
an increased surface area which indicates the
formation of more pores and active groups on the
surface of the adsorbent. According to Lanjar, et
al (Lanjar et al., 2018) Adsorption of Methyl
Violet Dye by Activated Carbon Based on
Pineapple Leaf Waste follows the Langmuir
equilibrium with the equation y= 4.854* x +
0.2407 where y = ce/qe and x is Ce at R
2
0.9
Table 1: Adsoprsi Equilibrium Freundlich dan Langmuir.
C. Adsorption Kinetic Model
The value of the adsorption reaction rate (K1 and
K2) and the value of qe obtained through
linearization of Equation (3) for pseudo-order 1
adsorption kinetics model (PFO) and linearization
of Equation (4) on pseudo-order (PSO).
1 .Pseudo First Order Kinetics
(8)
ln (qe-qt) and t data are plotted as in Figure 4
Figure 4: KTKA-3M . Pseudo First Order Kinetic Curve.
In Figure 4, the equation ln (qe-qt) = 2.4989 –
0.00437 with a k1 value of 0.0437 min-1 and a
magnitude of qe in the form of 10 intercepts
12.1690 mg/g. The pseudo-first-order equation
R
2
0.6903 indicates that it is not significant and
the suitability of the
R2
value is not close to 1.
2.Second Order Pseudo Kinetics
The values of k2 and qe for pseudo-second order are
determined using Equation (9).
(9)
The relationship of t/qt to t is shown in Figure 5,
where the value of qe is obtained from 1/slope and
k2 (slope/(intercept*qe).
Figure 5: KTKA-3M . Pseudo Second Order Kinetic Curve.
The equation t/qt = 0.0271*t + 0.0486 which
shows that 0.0271 is the slope value referring to 1/qe
so that the qe value is 1/slope which is 36.9080 mg/g.
The pseudo-second order adsorption rate (k2) is
obtained from intercept 1/(k2.qe2), k2 is obtained
from (Slope/(Intercept*qe)) which is 0.02709 g,gm-
1min-1 and the correlation coefficient is 0.9993 close
to 1. The calculation results are good pseudo-first-
order and second-order are all summed up in Table 2.
Table 2: Pseudo First Order and Pseudo Second Order
Adsorption Kinetics.
t/qt = 0,0271*t + 0,0486
R² = 0,9993
0
1
2
3
4
050100150
t/qt
t (minute))
Equilibrium Model and Adsorption Kinetics of Methylene Blue with Kluwak Shell Carbon
803

The adsorption kinetics equation of KTK and KTKA
3M KOH follows the appropriate Pseudo Second-
order kinetic model as shown in Table 2 by
comparing the correlation coefficient (R
2
). The value
of the pseudo-second-order correlation coefficient is
greater than the pseudo-first-order and close to one.
This indicates that the adsorption of methylene blue
uses KTK and 3M KTKA chemically. If the price of
R2 in the pseudo-first-order is greater and closer to
the value of 1 than the price of R
2
in the pseudo-
second-order then the adsorption is physically and
vice versa if the R
2
in the pseudo-second-order is
greater and approaches the value 1 of the value of R
2
in the pseudo-first-order then the adsorption involves
a chemical reaction. The kinetic model is based on the
adsorption rate data in Table 2, which in this study
shows that following the pseudo-second-order
kinetics model presents a more presentative
adsorption rate model. The pseudo-second-order
modeling is based on the assumption that adsorption
involves a chemical process between the adsorbent
and the adsorbate . The same thing also happened in
a study conducted by Eko Ariyanto, et al (Ariyanto,
Juniar, Sari, & Marindah, 2014) on the adsorption of
methylene blue and methylene red using activated
carbon from agricultural waste following the pseudo-
second-order kinetic equation with a qe of 27.7 mg/g
for methylene blue and 23.3 mg/g adsorbate
methylene red at a dye concentration of 20 ppm in 100
ml. The adsorption of methylene blue removal using
activated carbon from coconut shell shows a kinetic
equation following the pseudo-second-order model
with a correlation coefficient of about 0.9, both
physical activation of coconut shell in the form of
heating 700
o
C, chemical activation using H
3
PO
4
(Khuluk, Rahmat, Buhani, & Suharso, 2019). The
adsorption rate data on the adsorption study of
methylene blue dye with activated carbon from durian
peel using KOH and NaOH as activators stated that
the pseudo-second-order modeling showed a more
presentative adsorption rate model based on the
assumption that adsorption involves a chemical
reaction between the adsorbent and the adsorbate
(Hanum, Gultom, & Simanjuntak, 2017). Methyl blue
adsorption kinetics using activated carbon of banana
peel waste with a value of qe 0.0033 mg/g and k2
1.8172 gmol
-1
min
-1
(Kurniati, Prastuti, & Septiani,
2019). In the research conducted by Evi Susanti and
Nofrianto (Susanti & Nofdianto, 2014), the kinetics
model of Cr6+ ion absorption from water media to
periphyton biomass is pseudo-second-order, the
equation t/qe = 0.550*t+3.554 with a correlation
coefficient of 0.947. Methyl orange adsorption using
synthetic alum on cotton and cotton fiber, both of
which followed a pseudo-second-order kinetic model
with R2 0.98 (Ikhsan, Widjayanti LFX , & Sunarto,
2013).
4 CONCLUSIONS
1. Equilibrium adsorption of methylene blue using
kluwak shell carbon (KTK) and 3M KOH
activation (KTKA 3M) follows the Langmuir
equation.
2. The adsorption kinetics of methylene blue with 3M
CEC and KTKA, namely Pseudo Second Order.
3. Equilibrium and kinetic equations.
KTK
qe=(15.2732*0.0382 C_e)/( 1+0.0382.Ce),
R
2
0.8020 and t/qt=1/(0.0326* 30.6020²)+
1/30.7020 t, R2 0.9853
KTK 3M KOH
qe=(45.0341*1.8722 C_e)/( 1+1.8722.Ce),
R
2
0.9932 and t/qt=1/(0.0271* 36.9080²)+
1/36.9080 t,R2 0.9932.
ACKNOWLEDGEMENTS
We would like to say thank you to the chemical
engineering community for the cooperation and
facilities and infrastructure, the kluwak team is
amazing.
REFERENCES
Agarwal , B., & Sengupta, P. (2013). Equilibrium, Kinetic
and Thermodynamic Studies of Simul taneous Co-
Adsorptive Removal of Phenol and Cyanide Using
Chitosan. International Journal of Chemical,
Molecular, Nuclear, Materials and Metallurgical
Engineering .
Ariyanto, E., Juniar, H., Sari, E., & Marindah, R. (2014).
Adsorption Studies of Methylene Blue and Methylene
Red on Activated Carbon Derived from Agricultural
waste: Rubber (Havea brasiliensis) Seed Powder.
Proceedings of The 5th Sriwijaya International
Seminar on Energy and Environmental Science &
Technology, 153-157.
Do, D. (1998). Adsorption Analysis: Equillibrum and
Kinetics. London: Imperial Collegs Press.
Hanum, F., Gultom, R., & Simanjuntak, M. (2017).
Adsorpsi Zat Warna Metilen Biru Dengan Karbon Aktif
Dari Kulit Durian Menggunakan KOH Dan NaOH
Sebagai Aktivator. Jurnal Teknik Kimia USU.
Ikhsan, J., Widjayanti LFX , E., & Sunarto. (2013). The
Effect of Alum Synthesized From Wasted Beverage
iCAST-ES 2021 - International Conference on Applied Science and Technology on Engineering Science
804

Cans to Adsorption Kinetics of Methl Orange by
Natural Cotton anda Cottoncloth. Prosiding Nasional
Kimia, 431-439.
Khuluk, H., Rahmat, A., Buhani, & Suharso. (2019).
Removal of Methylene Blue by Adsorption onto
Activated Carbon From Coconut Shell (Cocous
Nucifera L.). Indonesian Journal of Science &
Technology, 229-240.
Kurniati, Y., Prastuti, O., & Septiani, E. (2019). Studi
Kinetika Adsorpsi Mrtil biru Menggunakan Karbon
Aktip Limbah Kulit Pisang. Jurnal Teknik Kimia dan
Lingkungan, 34-38.
Lagergren, S. (1989). Zur Theorie der Sogenannten
Adsorption Geloster Stoffe. Handlingar: Kungliga
Svenska Vetenskaps Akademiens.
Lanjar, Riayanti, F. I., & Astuti, W. (2018). Kesetimbangan
Adsorpsi Zat Warna Methyl Violet oleh Karbon Aktif
Berbasis Limbah Daun Nanas (Ananas comosusL).
Metana, 31-36.
Mohit, N., Sunil, R., Shraddha, R., & Pradeep, K. (2019).
Adsorpstion of Cr(VI) ion from Tannery Wastewater on
Tea Waste : Kinetics, Wquilibrium and
Thermodynamics Studies. Jurnal of Enviromental
Chemical Engineering, 1-9.
Rohaizar, N. (2013). Removal of Cu (II) from Water by
Adsorption on Chicken Eggshell. International Journal
of Engineering & Technology, 40-48.
Susanti, E., & Nofdianto. (2014). Model Kinetika Pseudo
Second Order untuk Penyerapan Ion Cr6+ dari Media
Air ke Biomassa Perifition. Limnotek, 95-102.
Tan, H., & Ahmad. (2007). Equilibrium and Kinetic Studies
on Basic Dye Adsorption by Oil Palm Fibre Activated
Carbon. Chemical Engineering Journal, 111-119.
Yuliani, H., Hartono, T., Puspita, S., Juliati, Musfirah, A.,
Isma, A., & Ida, A. (2019). Kajian Awal Adsorben Abu
Kayu terhadap Methylene Blue. INTEK Jurnal
Penelitian, 133-138.
Equilibrium Model and Adsorption Kinetics of Methylene Blue with Kluwak Shell Carbon
805
