
Energy Mix Simulation to Reach Regional Energy Strategy:
A National Impact of East Nusa Tenggara Province Energy Mix
Adrianus Amheka
1
, Julius Tanesab
2
, Nonce Farida Tuati
3
, Kathleen Aviso
4
and Krista Danielle Yu
5
1
Department of Mechanical Engineering, State Polytechnic of Kupang, Indonesia
2
Department of Electrical Engineering, State Polytechnic of Kupang, Indonesia
3
Department of Accounting, State Polytechnic of Kupang, Indonesia
4
Department of Chemical Engineering, De La Salle University, Manila, Philippine
5
School of Economics, De La Salle University, Manila, Philippine
Keywords: NTT Province, Regional Energy Mix, GHG Emission.
Abstract: More than 70% of global energy demand growth was met by fossil fuels as a trigger for increasing GHG
emissions and the Indonesian itself has contributed around 6.678 million stock tank barrels (MMSTB) for
that. Indonesian primary energy demand in 2025 from oil is 98.7 million tonnes of oil equivalent (MTOE) or
24.7% from energy mix and expected to be increased up to 197.7 MTOE or around 19.5% from energy mix
in 2050. In fulfilling national energy needs, regional functions in achieving energy security are indispensable.
For that through national energy general plan is targeted to reach renewable energy (RE) mix in 2025 is a
minimum of 23% of total primary energy. In this study, several indicators were used such as social economy,
energy, and the environment using LEAP simulation. The results show that East Nusa Tenggara (NTT)
Province has the potential to develop RE, with the potential of primary energy resources of 23.8 GW enabling
the province to reach the RE mix target of up to 24% in 2025 and 31% in 2050 while GHG emission decreased
9% and 11% from the usual condition in 2025 and 2050 respectively. Therefore, the current energy structure
has space to restructure the energy system to be more optimal in achieving regional energy independence as
well as support for the achievement of the SDGs and global competitiveness.
1 INTRODUCTION
Indonesia is an archipelago countries with a
population of 265 million peoples spread across 35
provinces with diverse socio-economic conditions
(A. Amheka & Higano, 2015, 2018) has the potential
for primary energy which is adequate in supporting
the economy at both national and local levels and
currently as G-20 member countries which have
actually made this country potentially to become a
contributor to the achievement of world prosperity
which is currently positioned in 16th the largest GDP
level between Mexico and Turkey. At present, 70%
of global primary energy supply comes from fossil
fuels and as a consequence trend of increasing global
emissions will absolutely increase (A. Amheka &
Higano, 2015; Kumar, 2016). Taking part of that,
Indonesia government through national energy were
supplied as 6.678 million stock tank barrels
(MMSTB) to support national development (INEP,
2017).
Strengthening the national energy buffer through
regional primary energy supply, instead of costly
fossil fuel imports (Kumar, 2016). The current fossil
fuel subsidies, which make the present energy supply
affordable for the population, cost Indonesia over 100
trillion IDR/year (~USD7.04 million/year) and
despite fossil fuel reserves, the dependence on fossil
fuel imports is steadily growing. Although Indonesia
made great advances in the electrification across the
country, some provinces in East and Central Java,
East Nusa Tenggara (NTT) and Papua are proving
particularly hard to reach and 2,110 out of 2,424
villages remain without any access (International
Energy Agency (IEA), 2018). In order to achieve
global sustainable development goals (SDGs) no.7
“Affordable and clean energy” while meet
Indonesia’s national energy policy targets and
national energy general plan (INEP, 2017; Indonesia
National Energy Policy (INEP), 2014; Nusa Tenggara
Timur Government, 2019), mentioned that
Indonesian primary energy demand in 2025 from oil
Amheka, A., Tanesab, J., Tuati, N., Aviso, K. and Yu, K.
Energy Mix Simulation to Reach Regional Energy Strategy: A National Impact of East Nusa Tenggara Province Energy Mix.
DOI: 10.5220/0010950600003260
In Proceedings of the 4th International Conference on Applied Science and Technology on Engineering Science (iCAST-ES 2021), pages 657-663
ISBN: 978-989-758-615-6; ISSN: 2975-8246
Copyright
c
2023 by SCITEPRESS – Science and Technology Publications, Lda. Under CC license (CC BY-NC-ND 4.0)
657
is 98.7 million tonnes of oil equivalent (MTOE) or
24.7% from energy mix and expected to be increased
up to 197.7 MTOE or around 19.5% from energy mix
in 2050 and a minimum of 23% of total primary
energy must be supplied by renewable energy (RE)
by 2025 and increased to be 31% of energy mix or
around 92.3 MTOE and 315.7 MTOE respectively.
Optimization of energy balance to support the
responsibility of achieving SDGs at the local level in
Indonesia focused on NTT Province become a
motivation for this study as well as an inventory of
information and references for regional energy
policies. Current RE potential at NTT Province in
2015 as baseline shown in Table 1.
Table 1: Potential and utilization of RE in NTT Province in
2015 (base year).
No Type of
Energy
Potential
(MW)
Installed
capacity
(MW)
Utilization
(%)
1 Geothermal 629 12.5 1.99
2 Water 53
- -
3 Mini & Micro
Hydro
95 5.2 5.47
4 Bioenergy 240.5 1 0.42
5 Solar 7,272 7.43 0.1
6 Wind 10,188 3.1** 0.03
7 Tidal 5,335 - 0
Total 23,812.5 29.23 0.12
Source: (INEP, 2017; Indonesia National Energy Policy (INEP),
2014; Nusa Tenggara Timur Government, 2019).
Baseline data is used among other the total
population is 5,120,061 souls with a rate of
population growth is 1,67%; total of households are
1,108,400; electrification ratio 58.64%; the GDP is
56,821 billion IDR with its growth rate 5.05% per
year; the GDP per capita is 11 billion IDR with annual
growth rate is 3.31%; the growth elasticity is around
1.15 per year. While as baseline of GHG emission in
beginning of 2015 was expected around 2,2 Million
tons with a emission per capita is around 0,45 million
tons (A. Amheka & Higano, 2015; Nusa Tenggara
Timur Government, 2019). There are some data
trends in terms of social economy, energy and
environment was entered into the model.
2 MATERIALS AND METHODS
This study investigates the energy balance analysis of
taking into account the quantity of energy demand
and energy supply of each sectors activity for a
province which is NTT Province in Indonesia. The
indicators used for the optimization are the social-
economy, energy and environment which means
GHG emission. The Long-range Energy Alternatives
Planning (LEAP) was developed by the Stockholm
Environment Institute, which is a system
optimization software was used for the system
analysis which is allowed users input current
quantitative data and future energy demands as a
good accounting tool for energy supply and demand
model (Aized et al., 2018; Emodi et al., 2017; Ferrão,
2017; Halkos et al., 2015; Kusumadewi et al., 2017;
Ouedraogo, 2017; Pan et al., 2013; Phdungsilp & Ã,
2010; Wongsapai et al., 2016; Zhang et al., 2019).
The LEAP basically a description or plan that
describes the complex system of production,
distribution, and consumption of energy into a
mathematical formula to display a reference to
describe the energy system in a region within a period
of time. Every country has specific model customized
depends on social, economic and environmental
conditions and other parameters and indicators
(Awopone et al., 2017; Emodi et al., 2017; Huang et
al., 2011; Kemausuor et al., 2015; Mirjat et al., 2017;
Yang et al., 2017). For Indonesia the model is
customized to fully describe a comprehensive social-
energy-environment analysis in evaluate the
alternative configuration and design based on general
standard indicators (HaCohen-Kerner & Mughaz,
2010; Heaps, 2008). The customized model structure
allowed by Indonesia government as business as
usual (BAU) condition as shows in Fig. 1. (INEP,
2017; HaCohen-Kerner & Mughaz, 2010; Nusa
Tenggara Timur Government, 2019).
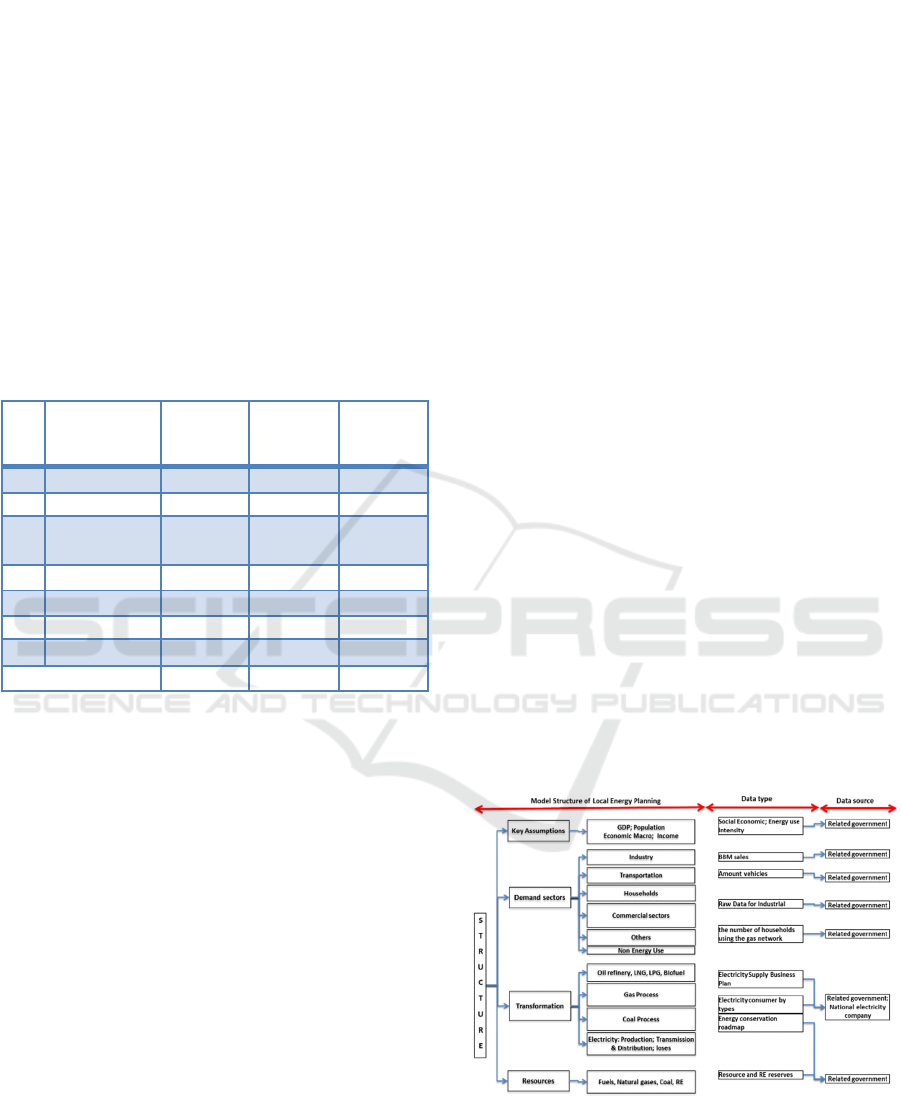
Figure 1: Framework and model structure.
In the household, commercial, transport and
industrial sectors, the LEAP model has helped to
assess their energy consumption and greenhouse gas
emissions. Because of LEAP only as a tool, so that
iCAST-ES 2021 - International Conference on Applied Science and Technology on Engineering Science
658
primary data collection is still needed as a reference
key assumption, demand sectors, transformations,
dan potential natural resources for a period 6 years
between 2010 to 2015. Lack of data availability
become a barrier. The scenario assumption is based
on current data collection on energy system
conditions including electricity in NTT Province was
obtained through FGD activities involving various
stakeholders. The output of the activity is met through
update the latest data inventory as primary data for a
period of 6 years from 2010 to 2015. Basically, we
choose the selection of the 6-year period is to
anticipate if the collection data information obtained
is not as complete as expected so that we may able to
make assumptions accurate as possible due to the
primary data range used is not too far.
The algorithm structure for a total energy
consumption as follow (Emodi et al., 2017):
=
∑
(
) (1)
where,
is total energy demand of industrial sector
(en);
is intensity energy consumption of Industrial
sector (ex)
=
∑
.
=
∑(
.
)
.
;
=
.
.
(2)
Where,
is total energy consumption of household
sector (en);
is final energy consumption of using
technology (en);
activity level of energy use (en);
is number of households using
equipment/technology (ex); and
is penetration of
equipment/technology (en).
=
∑
.
(3)
is energy demand of transportation sector (en)
=
∑
(
)
;
=
∑
(
) (4)
is energy demand of subsector private (en); is
floor area;
is energy demand of subsector
government (en).
=
∑
( ℎ
) (5)
is energy demand of other sector (en).
=
∑∑
.
.
.
(6)
is CO
2
emission (en) (Cai et al., 2008; Emodi et
al., 2017; Handayani et al., 2017);
.
is emission
factor of primary energy which is consumed to
produce electricity from technology (en);
is
technology efficiency (ex); dan
is power outputs
are required (ex).
2.1 Results and Discussion
The structure of the social, economic and
environmental conditions of NTT Province during the
period of 2012 to 2015 can be well-controlled and
conducive situations (A. Amheka & Higano, 2015;
Adrianus Amheka et al., 2016, 2014) which allow the
minimum condition to the transition of energy
structures from conservative consumption patterns
towards a better direction in supporting national
energy development. The simulation results as in Fig.
2, Table 2 and Table 3 respectively, show NTT
Province of NTT Energy mix 2015 to 2050.
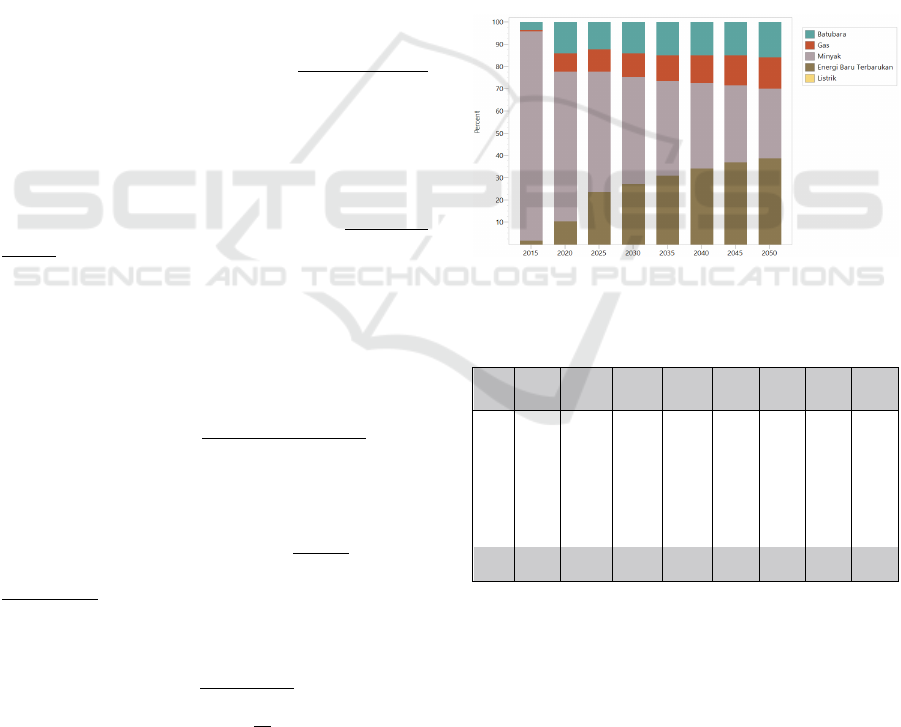
Figure 2: Energy mix of the NTT Province 2015 to 2050.
Table 2: NTT Province’s Energy mix 2015 to 2050.
(Unit: percentage)
Fuels 2015 2020 2025 2030 2035 2040 2045 2050
Coal 4.% 14.% 12.% 14.% 15.% 15.% 15.% 16.%
Gas 1.% 8.% 10.% 11.% 11.% 12.% 14.% 14.%
Oil 94.% 67.% 54.% 48.% 43.% 38.% 35.% 31.%
RE 2.% 10.% 24.% 27.% 31.% 34.% 37.% 39.%
Total 100.% 100.% 100.% 100.% 100.% 100.% 100.% 100.%
At the base year 2015, primary energy use sourced
from oil is dominated this shows how massive the
supply and demand of energy from oil to support the
region where it reaches 94% or equals to 1.1 MTOE
of the total energy mix in NTT Province. In the same
year, the primary energy use from RE sources was
only 2% or equivalent to 20 TOE and followed by
coal by 4% and the rest of 1%.
Energy Mix Simulation to Reach Regional Energy Strategy: A National Impact of East Nusa Tenggara Province Energy Mix
659
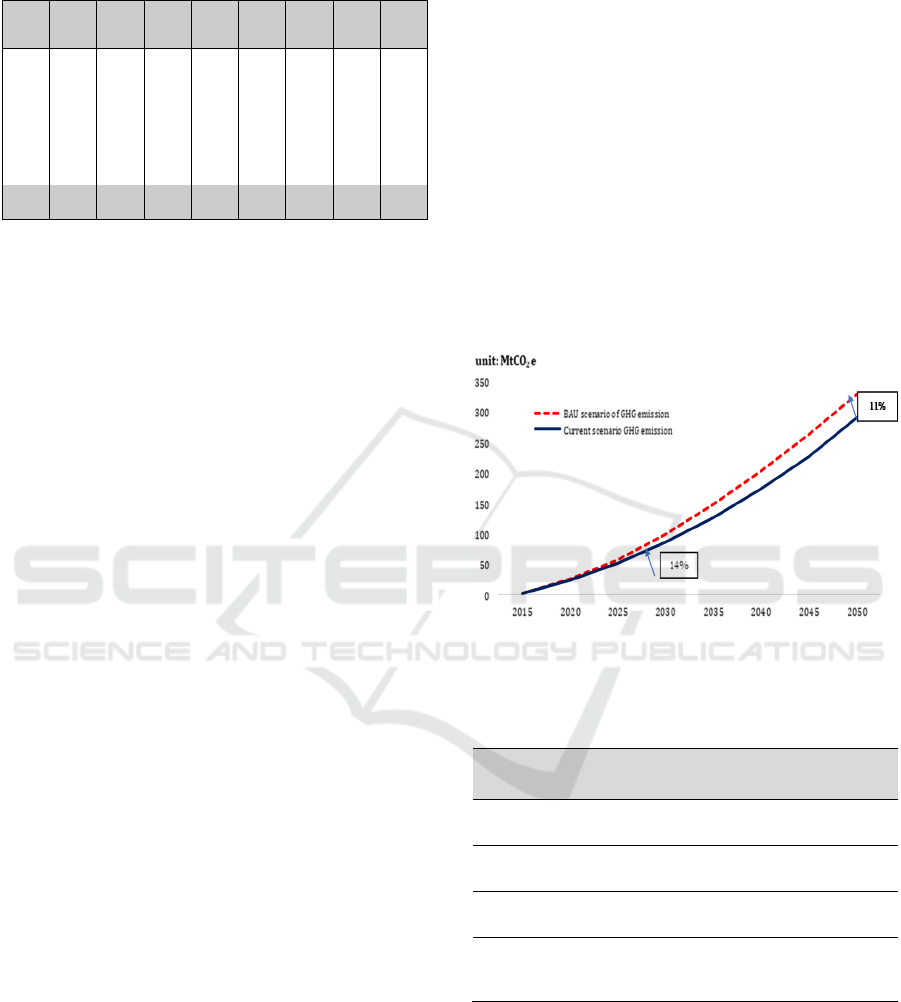
Table 3: Province of NTT Energy mix 2015 to 2050.
Unit: TOE
Fuels 2015 2020 2025 2030 2035 2040 2045 2050
Coal
40 248 312 460 610 754 917 1,177
Gas
7 146 258 348 474 634 837 1,040
Oil
1,072 1,193 1,380 1,580 1,764 1,949 2,142 2,326
RE
20 186 609 901 1,273 1,743 2,290 2,893
Total 1,139 1,774 2,560 3,289 4,121 5,079 6,186 7,436
The primary energy mix trend continues to vary
where the portion of petroleum use has drastically
reduced in the next 5 years, which is down 40% in
2025 compared to the base year of 2015, while the
portion of RE usage has increased to 24% and gas use
has increased 9% in 2025 which is to be 10%
compared to the initial year. This is in line with the
spirit of Indonesia's national energy policy (INEP,
2017; Indonesia National Energy Policy (INEP),
2014) which implies maximizing the use of the RE
from every year while minimizing energy use from
oil and optimizing the use of gas. Whereas if it is still
lacking, it will be filled by energy supply from coal,
where for the condition of NTT the use of gas has
increased sharply in the first 5 years, namely between
2015 and 2025, up 10% in 2025 compared to the base
year. This indicates that the economic structure of
NTT Province will be able to be optimized well,
while the contribution of sustainable long-term
regional energy management is maintained as seen in
2050 the share of energy use sourced from the RE
increased to be 39% increased 15% from 2025 or
equivalent to 2.9 MTOE. Sharp increase in RE
according to national energy policy targets especially
between 2040 and 2050 where it is assumed that in
those years the development of power plant
technology has been very good, especially from RE
plants while coupled by the quality of human
resources in the management and utilization of RE
technology, but still around 33,18% of electricity
supplied is still from coal. The portion of fossil
energy in providing electricity generation capacity
continues to be reduced. Based on installed electricity
generation capacity, the portion of fossil plants in
2015 was around 93.38% and will be reduced to
42.73% in 2025 and 48.58% in 2050 (Nusa Tenggara
Timur Government, 2019). But if we compared
globally, the proportion of coal and oil in global
primary energy consumption was only reduced 61.4%
in 2016 (BP Statistical Review, 2017), while
proportion of natural gas and non-fossil energy in
total primary energy consumption globally increased
by 2.7% in the last 10 years. This indicates that the
NTT province's energy system transformation will
have a major impact not only at the national level but
also have a global impact to support achieving the
SDGs through local good practice specifically in the
energy sector and secure national competitiveness (A.
Amheka & Higano, 2018). The achievement of
national energy policy targets will have a significant
impact on GHG reduction, as shown in the simulation
when compared to BAU condition of Province of
NTT. The GHG emissions projection in 2025 is 37.1
MtCO
2
e equivalent to 4% of total national emissions
and the amount of GHG emissions per capita is 6.20
tCO
2
e. For 2050 GHG emissions are 172 MtCO
2
e is
equivalent to 9% of total national and the amount of
GHG emissions per capita is 20.78 tCO
2
e as shows its
trends on Fig.3 ad Table 4.
Figure 3: Trend of GHG emission reduction BAU scenario
v.s current scenario.
Table 4: Trend of GHG emission reduction BAU scenario
v.s current scenario.
YEAR 2015 2020 2025 2030 2035 2040 2045 2050
BAU
scenario
3 26 58 99 149 203 263 329
Current
scenario
3 25 52 86 126 173 228 291
Optimal
scenario
0 1 5 14 23 30 36 38
GHG
reduction
(%)
0 4 9 14 15 15 13 11
The simulation results also show, the controlling
of GHG emissions in 2025 able to reduce up to 9%
while in 2050 it is only reached by 11% compared to
BAU condition where both scenarios have taken into
account the contribution of GHG emissions from
power plants.
iCAST-ES 2021 - International Conference on Applied Science and Technology on Engineering Science
660
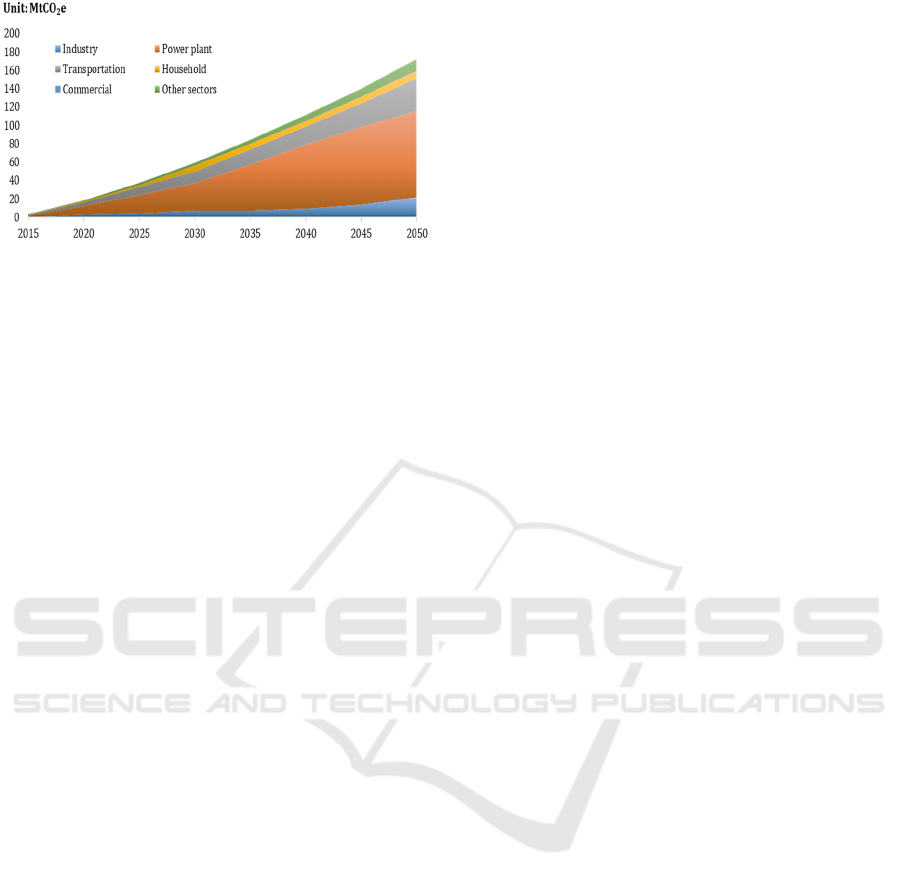
Figure 4: Trend of GHG emission in NTT Province 2015-
2050.
In Fig. 4 shows, the power plant sector is
projected to be the largest contributor to GHG
emissions, followed by sectors of transportation,
industrial, household, other sectors and commercial.
Power plant, transportation and household sectors
make a substantial contribution to the base year,
which is more than 30% of each. However, the
household sector since 2020 shows a flat increase
until 2050, which is in the range of 5% to 6%, this is
because after 2020 the policy of using non-fossil
energy has been well massively implemented through
the utilization of RE potential, for example, to support
local and urban and rural gas networks which are
getting better, even though infrastructure
development to support these two things is still
needed. The opposite is happening in the power plant
sector, where the emissions released continue to
increase dramatically, in 2015 the amount is less than
33% but since 2020 until 2050 the increase is in the
range of 50% to 60% of the total emissions of NTT
Province. This shows that although national and
regional energy policies have been implemented well,
they still have not been able to reduce the contribution
of emissions from this sector, due to the slow
innovations in clean technology management that are
implemented in all power plants (Adrianus Amheka
et al., 2016). Even though the technology is already
available, maintenance from the technical side of
these plants has not been optimally carried out due to
various constraints both financially and the readiness
of established human resources in the operation of
clean technology-based plants. Similar to the
transportation sector, the upward trend is quite large
after the power plant sector, which is due to the
economic conditions of the people who have not been
able to realize emissions-free vehicles such as electric
vehicles, gas vehicles, and maintenance and spare
parts due to far from the automotive industry which
are all centralized on the island of Java.
For the industrial sector, there is a significant
increase in 2020 and after that the trend of flat
emission runs in the range of 10% to 11% until 2050,
this gives a good meaning where the governance in
regional regulations and their implementation is
already well done which is able to provide conducive
for investors to invest in various
industrial fields
cleaner production-based such as the use of
environmentally friendly industrial technology.
3 CONCLUSIONS
The contribution of sustainable long-term regional
energy management will be able to improve national
competitiveness and become one of the concrete
forms of support for achieving the SDGs through
local good practice in the energy sector by reach
proportion of natural gas and non-fossil energy in
total primary energy consumption globally increased
by 2.7% within 10 years. Participation of government
and community are very necessary so as the
development of an integrated energy system model
can be achieved optimally by considering social,
economic and environmental factors. Further the
discussion give meaning that the current economy
structure will able to provide space for optimization
in order to achieve local energy security and
management target in secure the RE mix target of up
to 24% in 2025 and 31% in 2050 while GHG
emission decreased 9% and 11% from the usual
condition in 2025 and 2050 respectively. Further,
controlling to the growth of energy demand and
energy consumption is necessary, where it can be
probably done through enhance coordination among
stakeholders such as government from any aspects,
community, business, NGOs locally and the
development partners from foreign governments to
achieve smart energy systems (Lund et al., 2017). The
preparation and availability of qualified human
resources in various fields are very necessary in order
to maintain the energy and environmental system
links, especially in environment-based energy
management in the NTT Province and Indonesia in
national level and the global world generally.
ACKNOWLEDGEMENTS
The authors gratefully acknowledge the support from
State Polytechnic of Kupang, Ministry of Education,
Culture, Research and Technology, Republic of
Indonesia.
Energy Mix Simulation to Reach Regional Energy Strategy: A National Impact of East Nusa Tenggara Province Energy Mix
661

REFERENCES
Aized, T., Shahid, M., Bhatti, A. A., Saleem, M., &
Anandarajah, G. (2018). Energy security and renewable
energy policy analysis of Pakistan. Renewable and
Sustainable Energy Reviews, 84, 155–169.
https://doi.org/10.1016/j.rser.2017.05.254
Amheka, A., & Higano, Y. (2015). An introduction to
regional government in Indonesia to success RAD-
GRK program: Literature review of GHG emission
trends in Indonesia. Regional Science Inquiry, 7(1).
Amheka, A., & Higano, Y. (2018). A novelty design of
GHG Emission Reduction Cost for the Province of
Nusa Tenggara Timur, Indonesia: A quantitative-based
scientific view. IOP Conference Series: Earth and
Environmental Science, 207(1), 012062.
https://doi.org/10.1088/1755-1315/207/1/012062
Amheka, Adrianus, Higano, Y., Mizunoya, T., & Yabar, H.
(2016). Emission reduction strategies in indonesia:
Evaluation of socio-economic development trends in
Kupang city based on an I/O analysis. Studies in
Regional Science, 45(1), 41–60. https://doi.org/10.24
57/srs.45.41
Amheka, Adrianus, Higano, Y., Mizunoya, T., & Yabar, H.
(2014). Comprehensive Evaluation of the Feasibility to
Develop a Renewable Energy Technology System and
Waste Treatment Plant in Kupang City, Indonesia
based on a Kupang Input Output Table. Procedia
Environmental Sciences, 20, 79–88.
https://doi.org/10.1016/j.proenv.2014.03.012
Awopone, A. K., Zobaa, A. F., & Banuenumah, W. (2017).
Techno-economic and environmental analysis of power
generation expansion plan of Ghana. Energy Policy,
104, 13–22. https://doi.org/10.1016/j.enpol.2017.01. 034
BP Statistical Review. (2017). BP Statistical Review of
World Energy June 2017. https://www.bp.com/
content/dam/bp-country/de_ch/PDF/bp-statistical-
review-of-world-energy-2017-full-report.pdf
Cai, W., Wang, C., Chen, J., Wang, K., Zhang, Y., & Lu,
X. (2008). Comparison of CO2 emission scenarios and
mitigation opportunities in China’s five sectors in 2020.
Energy Policy, 36(3), 1181–1194. https://doi.org/10.10
16/j.enpol.2007.11.030
INEP, Pub. L. No. Presidential Regulation No. 22 (2017).
Emodi, N. V., Emodi, C. C., Murthy, G. P., & Emodi, A. S.
A. (2017). Energy policy for low carbon development
in Nigeria: A LEAP model application. Renewable and
Sustainable Energy Reviews, 68(September 2016),
247–261. https://doi.org/10.1016/j.rser.2016.09.118
Ferrão, P. (2017). ScienceDirect ScienceDirect The energy
Long-term savings and GHG mitigations in Thailand ’
s Long-term energy savings and GHG mitigations in
Thailand’s building sector
: impacts of energy
efficiency plan Assessing the feasibility of using the
heat build. Energy Procedia, 138, 847–852.
https://doi.org/10.1016/j.egypro.2017.10.110
HaCohen-Kerner, Y., & Mughaz, D. (2010). Estimating the
Birth and Death Years of Authors of Undated
Documents Using Undated Citations. In Stockholm
Environment Institute (pp. 138–149).
https://doi.org/10.1007/978-3-642-14770-8_17
Halkos, G., Tzeremes, N. G., & Tzeremes, P. G. (2015). A
nonparametric approach for evaluating long-term
energy policy scenarios: an application to the Greek
energy system. Journal of Economic Structures, 4(1).
https://doi.org/10.1186/s40008-015-0011-x
Handayani, K., Krozer, Y., & Filatova, T. (2017). Trade-
offs between electrification and climate change
mitigation: An analysis of the Java-Bali power system
in Indonesia. Applied Energy, 208, 1020–1037.
https://doi.org/10.1016/j.apenergy.2017.09.048
Heaps, C. (2008). An introduction to LEAP: Long range
Energy Alternatives Planning System. In Stockholm
Environment Institute.
Huang, Y., Bor, Y. J., & Peng, C. Y. Y. (2011). The long-
term forecast of Taiwan’s energy supply and demand:
LEAP model application. Energy Policy, 39(11), 6790–
6803. https://doi.org/10.1016/j.enpol.2010.10.023
International Energy Agency (IEA). (2018). Southeast Asia
Energy Outlook 2017.
Kemausuor, F., Nygaard, I., Mackenzie, G., Energy, G. M.-
, & 2015, U. (2015). Prospects for bioenergy use in
Ghana using Long-range Energy Alternatives Planning
model. Energy, 93, 672–682. https://doi.org/10.1016/
j.energy.2015.08.104
Kumar, S. (2016). Assessment of renewables for energy
security and carbon mitigation in Southeast Asia: The
case of Indonesia and Thailand. Applied Energy, 163,
63–70. https://doi.org/10.1016/j.apenergy.2015.11.019
Kusumadewi, T. V., Winyuchakrit, P., & Limmeechokchai,
B. (2017). Long-term CO2 Emission Reduction from
Renewable Energy in Power Sector: The case of
Thailand in 2050. Energy Procedia, 138, 961–966.
https://doi.org/10.1016/j.egypro.2017.10.089
Lund, H., Østergaard, P. A., Connolly, D., & Mathiesen, B.
V. (2017). Smart energy and smart energy systems.
Energy, 137, 556–565. https://doi.org/10.1016/
J.ENERGY.2017.05.123
Indonesia National Energy Policy (INEP), (2014).
Mirjat, N. H., Uqaili, M. A., Harijan, K., Valasai, G. Das,
Shaikh, F., & Waris, M. (2017). A review of energy and
power planning and policies of Pakistan. Renewable
and Sustainable Energy Reviews,
79, 110–127.
https://doi.org/10.1016/j.rser.2017.05.040
Nusa Tenggara Timur Government. (2019). General
Regional Energy Plan of NTT Province.
Ouedraogo, N. S. (2017). Africa energy future: Alternative
scenarios and their implications for sustainable
development strategies. Energy Policy, 106, 457–471.
https://doi.org/10.1016/j.enpol.2017.03.021
Pan, L. J., Xie, Y. B., & Li, W. (2013). An Analysis of
Emission Reduction of Chief Air Pollutants and
Greenhouse Gases in Beijing based on the LEAP
Model. Procedia Environmental Sciences, 18(X), 347–
352. https://doi.org/10.1016/j.proenv.2013.04.045
Phdungsilp, A., & Ã, A. P. (2010). Integrated energy and
carbon modeling with a decision support system :
Policy scenarios for low-carbon city development in
iCAST-ES 2021 - International Conference on Applied Science and Technology on Engineering Science
662

Bangkok. Energy Policy, 38(9), 4808–4817.
https://doi.org/10.1016/j.enpol.2009.10.026
Wongsapai, W., Ritkrerkkrai, C., & Pongthanaisawan, J.
(2016). Integrated Model for Energy and CO2
Emissions Analysis from Thailand’s Long-term Low
Carbon Energy Efficiency and Renewable Energy Plan.
Energy Procedia, 100, 492 – 495.
https://doi.org/10.1016/j.egypro.2016.10.208
Yang, D. D. D., Liu, B., Ma, W., Guo, Q., Li, F., & Yang,
D. D. D. (2017). Sectoral energy-carbon nexus and low-
carbon policy alternatives: A case study of Ningbo,
China. Journal of Cleaner Production, 156, 480–490.
https://doi.org/10.1016/j.jclepro.2017.04.068
Zhang, D., Liu, G., Chen, C., Zhang, Y., Hao, Y., &
Casazza, M. (2019). Medium-to-long-term coupled
strategies for energy efficiency and greenhouse gas
emissions reduction in Beijing (China). Energy Policy,
127, 350–360. https://doi.org/10.1016/j.enpol.2018.
12.030
Energy Mix Simulation to Reach Regional Energy Strategy: A National Impact of East Nusa Tenggara Province Energy Mix
663
