
Development of Population Data Cluster Application based on
Real-time Expertise
Herry S. Lang, Dostenreyk Kantohe, Ottopianus Mellolo, Sonny Kasenda and Tracy Marcela
Manado State Polytechnic, Jl. Raya Politeknik Ds. Buha, Kairagi, Manado, Indonesia
t
ra
cy@elekt
r
o.poli
m
do.ac.id
Keywords: Data, Application, Real-time, Bitung City Academic.
Abstract: Population data is one of the information needed for sustainable development planning. Sustainable
development is a planned development in all fields to create an ideal comparison between population
development and the carrying capacity and capacity of the environment and to meet the needs of the current
generation, without having to reduce the capabilities and needs of future generations, to support the life of the
nation from generation to generation throughout time. Population data as essential regional data is relatively
static, such as data on changes in migration between regions. Changes in the general structure of the
population, socio-economic structure, vertical and horizontal population mobility are an essential part of
population data collection and planning at the regional and national levels. Invalid population data is one of
the weak points in implementing sustainable development in the regions. For example, in human resource
planning, data is needed on the number of school-age population and workers. By incorporating population
into the national economic and development strategy, sustainable development will accelerate by growing the
workforce. As a result, development goals will be achieved more quickly. Information on population data in
the city of Bitung is not efficient in its management. The data input process should be carried out at the unit
closest to the community, such as the village. This application will be developed using PHP and MySQL. By
using the mixing method, the application will be developed to the trial stage in real conditions. This
application was created to classify the population's expertise in real-time to support sustainable development
in the city of Bitung in particular.
1 INTRODUCTION
A population is an object as well as a subject in
national development. The policy in the field of the
population is not only about the number and density
of the population, immigration flows, births, and
deaths, but also policies in terms of controlling high
population growth and directing mobility and a more
even distribution of the population, especially in
sparsely populated areas. Regulate the desired
population will cause social and economic problems.
The very large population growth will affect the
facilities and infrastructure in the fields of education,
health, and so on.
Referring to data from the BPS (Central Statistics
Agency) of Bitung City through a publication entitled
"Bitung City in Figures 2021", it was noted that the
number of the labor force in Bitung city in 2020 was
91,622 people with the percentage of the population
working towards the workforce in Bitung city was
89.77%, where the working-age population is the
population aged 15 years and over while the labor
force is the population working age (15 years and
over)who are working, have a job but temporarily not
working, and are unemployed. The number of skilled
and skilled workforce at BLKI Bitung City in 2020 is
859people. The problems caused by the large number
and growth of the labor force, on the one hand,
demand greater job opportunities. On the other hand,
demand the development of the workforce itself so
that it is able to produce higher outputs. This increase
must be anticipated by the government and the
business world as employers or job openings.
Employment comes from economic growth.
However, high growth does not always provide large
jobs. This relates to the economic development
strategy carried out by the government and the
business world. Another thing that must also be
considered in analyzing the relationship between the
labor force and employment opportunities is that if
Lang, H., Kantohe, D., Mellolo, O., Kasenda, S. and Marcela, T.
Development of Population Data Cluster Application based on Real-time Expertise.
DOI: 10.5220/0010949900003260
In Proceedings of the 4th International Conference on Applied Science and Technology on Engineering Science (iCAST-ES 2021), pages 613-618
ISBN: 978-989-758-615-6; ISSN: 2975-8246
Copyright
c
2023 by SCITEPRESS – Science and Technology Publications, Lda. Under CC license (CC BY-NC-ND 4.0)
613

job opportunities are above the labor force, it does not
mean that employment problems, ormore specifically
unemployment, are resolved. The existence of new
job opportunities is a "potential," and this "potential"
may not be utilized if the available workforce does
not have adequate quality.
A large population and workforce will be able to
become development potential if properly fostered.
Good coaching will produce a good quality
workforce. The quality of the workforce is reflected,
among others, in the level of education and
skills/expertise. A large population with low
population quality causes the population to become a
burden for economic growth and not a driver.
Employment problems are also caused by the lack of
competence and expertise needed by labor users.
Therefore, this application is made for grouping
population skills in real-time to support sustainable
development in the city of Bitung in particular.
2 SYSTEM ANALYSIS METHOD
Data analysis is one of the important steps in
obtaining research findings. This is because the data
will lead us to scientific findings when analyzed with
the proper techniques. The analysis of this system is
carried out using the Simple Additive Weighting
(SAW) method, which is often also known as the
weighted addition method. The basic concept of the
SAW method is to find the weighted sum of the
performance ratings on each alternative on all
attributes (Fishburn, 1967) (MacCrimmon, 1968).
The SAW method requires the process of normalizing
the decision matrix (X) to a scale that can be
compared with all existing alternative ratings. The
SAW method recognizes 2 (two) attributes, namely
the benefit criteria and the cost criteria.
The steps for completing the Simple Additive
Weighting (SAW) method are as follows
a. Determine the criteria that will be used as a
reference in decision making, namely Cj
b. Determine the suitability rating of each alternative
on each criterion.
c. Make a decision matrix (X) which is formed from
the suitability rating table for each alternative on
each criterion. The value of X for each alternative
(Ai) on each criteria (Cj) that has been
determined, where, i=1,2,…m and j=1,2,…n.
(1)
d. Normalize the decision matrix by calculating the
value of the normalized performance rating (rij)
from the alternative Ai on the Cj criteria. If j is a
benefit attribute, then
(2a)
If j is a cost attribute, then
(2b)
Where:
r
ij
= normalized performance rating value of
alternative A
i
on attribute Cj
Xi = attribute value owned by each criterion Max(i)
Xij= the largest value of each criterion i Min(i)
Xij= the smallest value of each criterion i
Benefits= if the largest value is the best
Cost= if the smallest value is the best value
e. The results of the normalized performance rating
value (r
ij
) form a normalized matrix (R)
(3)
f. The final result obtained from the ranking
process is normalized matrix multiplication R
with the weight vector. The largest value is
chosen as the best alternative (Ai) as the solution.
V =∑
n
𝑗
=
1
𝑤
𝑟
𝑗
(4)
Where:
Vi = ranking for each alternative
3 SYSTEM DESIGN METHOD
In developing the system, we have conducted surveys
and interviews both in person and through online
questionnaires to prospective system users. We use
the results as the basis of the design system to develop
an expertise-based population data system.
System design is the process of developing new
system specifications based on the results of system
analysis recommendations. The objectives of system
design are:
a. Meeting the needs of users of the system (users),
such as designing a decision support system to
help find population data based on expertise
mapped based on the address of the residence in
question.
iCAST-ES 2021 - International Conference on Applied Science and Technology on Engineering Science
614

b. Provide an overview through flowcharts to build
Applications Population Data Cluster based on
Expertise in Real-time in Bitung city.
After the population data collection is completed, we
must determine the criteria that will be used as a
reference in decision making. The following is a table
that contains 6 criteria used to make decisions
through the SAW method.
Table 1: Table of Criteria Terms.
No
Criteria
Code
Criteria
Weight
Informatio
n
1 2
3 4
5 6
C1 C2 C3
C4 C5 C6
Wages
Work
experience
Distance
Education
Age
Skill
10 25 15 15
10 25
Cost
Benefits
Cost
Benefits
Cost
Benefits
The value of each criterion is as follows, referring to
the residents' answers in the Application evaluation
section Population Data Cluster based on Expertise in
Real-time in Bitung city.
1. Salary Criteria
Table 2: Value of Salary Criteria.
No
Wages Criteria Value
1 2 3
4 5
< 1M
>1 M & <= 2 M >2 M
& <= 3 M > 3 M & <=
4 M > 4 M
1 2 3 4 5
2. Work Experience Criteria
Table 3: Value of Work Experience Criteria.
No Work experience Criteria Value
1
2
3
4
5
There is not any yet
<= 1 year
> 1 Year & <= 3 Years >
3 Years & <= 5 Years > 5
Years
1 2 3 4 5
3. Distance Criteria
Table 4: Distance Criteria Value.
No Distance (km)
Criteria
Value
1 <=2 1
2
3
4
5
>2 & <=5
>5 & <=8
>8 &
<=15 >15
2
3
4
5
4. Education Criteria
Table 5: Value of Education Criteria.
No Certificate Criteria Value
1 2
3 4
5
Junior high school
Senior High School
Diploma I/II/III
S1 / Diploma IV S2 /
S3
1 2 3 4 5
5. Age Criteria
Table 6: Age Criteria Value.
No Age (Years)
Criteria
Value
1 2 3
4 5
<=17
>17 & <=20 >20 & <=30
>30 & <=40 >40
1 2 3 4 5
6. Expertise Criteria
Table 7: Value of Expertise Criteria.
No Certificate Type
Criteria
Value
1 2 3 There is not any Training
Certificate Certificate of
expertise
1 2 3
Several analytical tools are needed to assist in
conducting the analysis in this study, including:
a. Flowchart used to analyze systems and programs
b. Entity Relationship Diagram (ERD) is used to
analyze the relationship between entities in the
system to be built
Both of them is shown in Figure 1 and Figure 2.
4 RESULT AND DISCUSSION
After the population data is obtained, the next step in
the settlement using the SAW method is to convert
the answers from the residents as the value of each
alternative (people who have filled out the evaluation
form) on each predetermined criterion. Considering a
large amount of data, we only took 4 alternative
samples to explain the SAW method calculation.
Development of Population Data Cluster Application based on Real-time Expertise
615
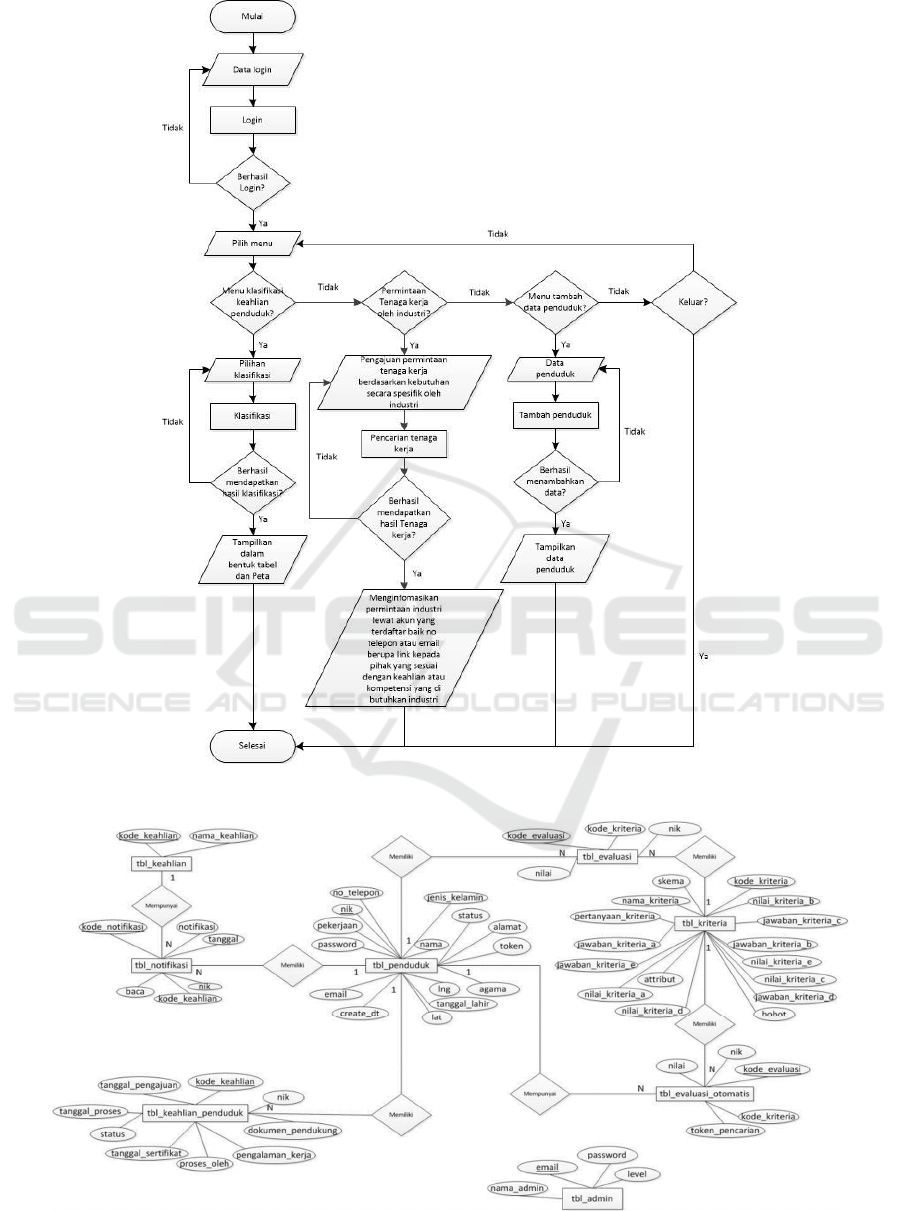
Figure 1: System design.
Figure 2: Entity relationship diagram.
iCAST-ES 2021 - International Conference on Applied Science and Technology on Engineering Science
616
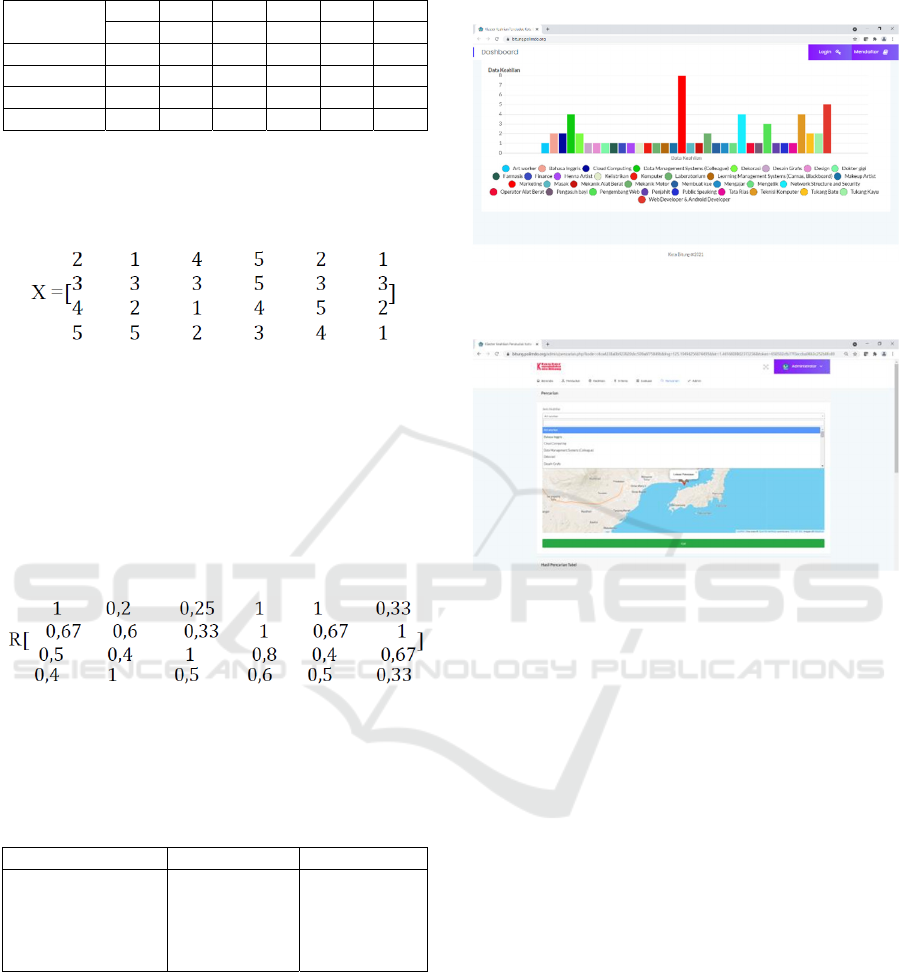
Table 8: Conversion of population values.
Alternative
C1 C2 C3 C4 C5 C6
Resident 1 2 1 4 5 2 1
Resident 2 3 3 3 5 3 3
Resident 3 4 2 1 4 5 2
Resident 4 5 5 2 3 4 1
After the value of the suitability rating of each
alternative on each criterion is determined in Table 8,
it is obtained decision matrix X with the following
data:
Next, normalizing the X matrix is obtained by
calculating the rij normalized performance rating
value from the Ai attribute on the Cj attribute based
on an equation that is adjusted to the type of attribute
(benefit/cost). Because each weight n. The value
given to each criterion is a matching value (the most
significant value is the best), then all the criteria given
are assumed to be profit criteria with equations. The
results of the normalized matrix R can be seen as
follows:
After normalization, the next step is to determine
the ranking value of the alternatives using the SAW
method. By using the formula, the preference value
for each alternative (Vi) can be seen in Table 9.
Table 9: Calculation Value of Ranking Process.
Alternative Results Rank
Resident 1
Resident 2
Resident 3
Resident 4
0.52
0.73
0.63
0.59
4
1
2
3
The most significant value is in Resident 2, the
alternative chosen as the best alternative with a result
of 0.73. This ranking will be used in the Application
Search feature to display population expertise data
based on a specified location. The data is presented in
tabular form with resident data ranking based on the
calculation of the SAW method. The initial view of
the Cluster Application Population Based on
Expertise in Real-Time in Bitung City can be seen in
Figure 3, while the display of the population data
search feature based on expertise according to the
specified location can be seen in Figure 4.
Figure 3: The initial view of the Population Data Cluster
Application Based on Expertise.
Figure 4: Display of the population data search page based
on expertise and location of residence.
5 CONCLUSIONS
The Population Cluster Application Based on Real-
Time Expertise in Bitung City was built to provide
integrated and valid population data to support
sustainable development in the city of Bitung in
particular. This application uses the Simple Additive
Weighting (SAW) method to rank population data
according to predetermined criteria, including salary
criteria, work experience, distance, education, age,
and expertise. The Search feature in the application
can display population expertise data based on a
specified location. The data is presented in tabular
form with population data ranking based on the
calculation of the SAW method.
ACKNOWLEDGEMENTS
We thank you very much for the Manado State
Polytechnic that has facilitated and financed this
research activity and to all those who have been
Development of Population Data Cluster Application based on Real-time Expertise
617

involved in assisting the completion of research
activities, we would like to thank you.
REFERENCES
Bitung City BPS. (2021). Bitung City in Figures 2021.
Catalog Number: 1102001.7172 Publication Number:
71720.2101 Release Date: 2021-02-26.
Fishburn, P. C. (1967). Methods of estimating additive
utilities. Management science, 13(7), 435-453.
Huda, B. (2018). Android-Based Population Data
Information System and Web Monitoring Case Study
of Karawang City Government. World of Science, vol.
3, no.1.
MacCrimmon, K. R. (1968). Decision making among
multiple-attribute alternatives: a survey and
consolidated approach. Rand Corp Santa Monica Ca.
McLeod Raymond Jr., Schell G d. (2004).
Management Information System. Prenhalindo.
Jakarta
Ni Luh Ayu Kartika Yuniastari Sarja, I Ketut
Suharsana. (2018). Software Development.
Journal of Systems and Informatics Vol. 10 No. 2
Rosa., Salahudin.. (2011). Software engineering.
Module Publisher. Bandung
Syahrani, A., &Hutripa, DM (2017). Android-Based
Family Data Collection Application Design (Case
Study: Padang City BKKBN). Journal of Technoif,
5(2).
Law Number 23 of 2006 concerning Population
Administration
iCAST-ES 2021 - International Conference on Applied Science and Technology on Engineering Science
618
