
Evaluation of Power Consumption in Moringa Leaves Dryer
Sumartini Dana, Yohanes Suban Peli, Indranata Panggalo, Ade Manu Gah and Indah O. Laleb
Department of Electrical Engineering, State Polytechnic of Kupang, AdiSucipto St., Kupang, Indonesia
Keywords: Solar Collector, PLN Electricity, Moringa Leaves.
Abstract: Moringa leaf dryer using solar collector and PLN electricity results from developing renewable energy that
utilizes solar energy directly or indirectly and combines it with PLN electricity. The aim is to increase the
production of dried Moringa leaves with tools designed to produce quality and hygienic for consumption,
reduce dependence on weather. Another point is to minimize losses experienced by Moringa farmers at
harvest, minimize the possibility of damage caused by decay, accelerate the Moringa processing process, and
do not require a large land area. Two ways are done in the moringa leaves' drying process: 1) Direct sunlight
hits the glass collector. Heat is collected in the collector's room and distributed in the dryer room using
additional tools such as fans or blowers needed to drain the dryer air to the Moringa leaves to be dried (forced
convection) and use the temperature sensor as a temperature controller in the room. Drying process. 2). The
oven works by utilizing PLN electricity for drying done at night. And the expected dryer temperature is 37-
40
0
C for three days. The process of setting the temperature control in the room of the moringa leaf dryer using
TNZ4H control temperature connected with the RTD sensor by selecting the setpoint 35-45 ºC. If the
temperature is less than 35 ºC, the heat source (Lamp) will turn on if more than 45 ºC, then the lamp will go
out. The drying result of 20 kilos of moringa leaves only takes about 8 hours with the average temperature in
the dryer room 40ºC. While with a weight of 100 kilos takes about three days because the drying process still
requires the sun as a source of heat and backup power. The average temperature in the rack during the drying
process of Moringa leaves weighing 100 kilos is 37ºC. The maximum temperature in the moringa leaf dryer
is 61.1ºC, with a maximum outside temperature of 42ºC. So it is necessary to analyse the calculation of the
amount of power, and the cost of electricity consumption is proper and efficient for moringa leaf dryer. From
the results of this calculation, the tool can be produced and utilized by the community.
1 INTRODUCTION
The use of Moringa for the people of NTT Province
is very potential and diverse, both from food
processing businesses, medicines, etc. Moreover,
Moringa plants are easy to grow, thrive in tropical
climates such as the NTT region, and do not require
extra care, making Moringa a prima donna plant in
NTT.
The processing itself is not so tricky only requires
full accompaniment to produce Moringa with good
quality. But there are some obstacles related to the
drying process that is the drying process done by
moringa farmers by utilising direct sunlight. First, the
dry season is not an obstacle, but the rainy season,
where the sun is not shining too well and often
cloudy, will hinder the drying process to the
maximum. The second problem in marketing is that
drying Moringa leaves that are not optimal will cause
a decrease in the income of Moringa farmers because
the level of dryness of Moringa leaves is not as
desired by the market. The third problem is that it is
not hygienic because Moringa leaves are dried in the
open, and the drying containers are straightforward.
Usually, Moringa farmers dry them using woven
bamboo, zinc, and tarpaulin shelves, and some even
put them directly on the ground.
Therefore, a moringa leaf dryer is made that can
solve all the problems mentioned above. Moringa leaf
dryer has a capacity of 20 kilos; heating at night takes
three incandescent lamps with 120 watts of electric
power and usage for 8 hours starting from 5 pm to 2
am. For cooling, it takes 6 fans of 20 watts each. The
required temperature in the drying process ranges
from 37 ºC to 40 ºC. So to maximise the energy
consumption in the moringa leaf dryer, evaluation of
power consumption on moringa leaf dryer is
appropriate and efficient.
604
Dana, S., Peli, Y., Panggalo, I., Gah, A. and Laleb, I.
Evaluation of Power Consumption in Moringa Leaves Dryer.
DOI: 10.5220/0010949800003260
In Proceedings of the 4th International Conference on Applied Science and Technology on Engineer ing Science (iCAST-ES 2021), pages 604-612
ISBN: 978-989-758-615-6; ISSN: 2975-8246
Copyright
c
2023 by SCITEPRESS – Science and Technology Publications, Lda. Under CC license (CC BY-NC-ND 4.0)
2 LITERATURE STUDY
2.1 Energy Audit
An energy audit is the first step in recording energy
consumption data, identifying sources of energy
wastage, analysing the possibility of energy saving,
and calculating the necessary steps. In addition, the
energy audit aims to find out "Portrait of Energy Use"
and look for efforts to improve energy efficiency.
2.2 Parameters for Calculating Power
The velocity at which electricity flows at one point on
the power grid is called an electrical power. The unit
of electricity in watts or joules per second in SI.
Electric power becomes measurable when electricity
producte by the plant and the absorb by the electricity
load. Power is negative when electrical power flows
from the circuit into the electrical capacity. Electric
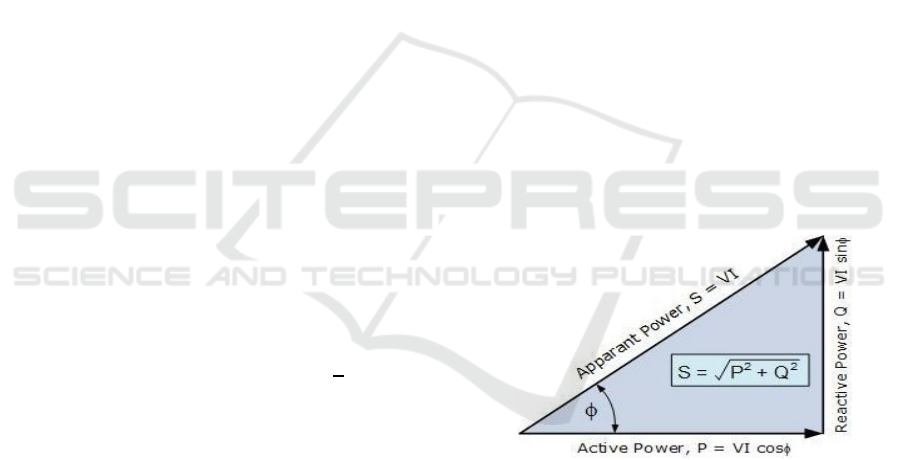
power is divided into power triangles: apparent
power, active/real power and reactive power.
1. Real Power
Real power is the electrical power used by consumers
for electrical machinery or other equipment after
multiplied cos φ.
With the formula:
Phase to neutral (1 phase) :
P = V × I × cosφ (1)
Phase to phase (3 phase) :
P = V × I × cosφ ×
√
3
(2)
Where:
P = real power ( Watt or J/s)
V = voltage (Volt)
I = current flowing on the delivery (Ampere)
cos φ = power factor
2. Reactive Power
Reactive power arises due to inductive/capacitive
reactive load and this power is used for mechanical
and heat. Reactive power results from the magnitude
of the voltage-current influenced by the power factor
with the Unit Volt Ampere Reactive (VAR).
With the formula:
Phase to neutral (1 phase):
Q = V × I × sin φ (3)
Phase to phase (3 phases):
Q = V × I × sin φ ×√3 (4)
Where:
Q = reactive power (VAR)
V = voltage (Volt)
I = current (Ampere)
φ = angle between current and voltage
3. Apparent Power
Apparent power is generated from a power source or
power plant and is an electrical power that flows
through the middle and currents flowing through the
transmission—the only volt-ampere (VA).
With the formula:
Phase to neutral (1 phase):
S = V × I (5)
Phase to phase (3 phase):
S = √3 × V × I (6)
Where:
S = Apparent power (VA)
V = voltage (Volt)
I = current flowing on the transmission (Ampere)
The power triangle relationship is shown in figure 1.
Figure 1: Power Triangle.
2.3 Drying
Drying is a hydrating process, which means removing
water from a material. The drying or hydration
process occurs when the dried material loses some or
all of the water it contains. The primary technique that
occurs after the drying process is evaporation.
Evaporation occurs when the water collected by a
material evaporates when heat is given to the
material. This heat can be supplied through various
sources, such as firewood, oil and gas, new charcoal
or solar power. Drying can also take place in other
ways, namely by breaking (Handini, 2008).
Evaluation of Power Consumption in Moringa Leaves Dryer
605
The drying process is influenced by temperature,
ambient air humidity, drying air flow rate, desired
moisture content, drying energy and drying capacity.
Drying that is too fast can damage the material
because the surface of the material dries too quickly
so that it can't be balanced with the speed of
movement of water from the material to the surface.
Furthermore, fast-drying causes the hardening of the
material's surface so that the water in the material can
no longer evaporate due to obstruction. In addition,
dry conditions with temperatures that are too high can
damage the material. Setting the temperature and
drying time is done by paying attention to the contact
between the dryer and the heating device (in the form
of hot air flowing or other heating devices). However,
for the sake of considerations of nutritional standards,
heating is recommended no more than 85
0
C
(Ismawati, Pengeringan, 2012).
2.4 Energy Conversion Mechanisms
When two or more objects are in thermal contact, heat
will flow from an object with a higher temperature to
an object with a lower temperature until thermal
equilibrium is reached. This heat transfer process takes
place in 3 mechanisms, namely:
1.
Conduction
2.
Convection
3.
Radiation
The definition of the thermal efficiency of a solar
collector is the comparison between the energy used
and the amount of solar energy received at a specific
time (A. Jansen. T.J, Teknologi Rekayasa Surya,
1995), the air is heated in the collector and rises due
to natural convection. The heat is stored in the rock,
and the air is then re-entered into the collector's base.
The heat is removed from the relief drift by natural
convection or rapid air circulation through the
collector and storage. So the store must be located as
far as possible above the collector.
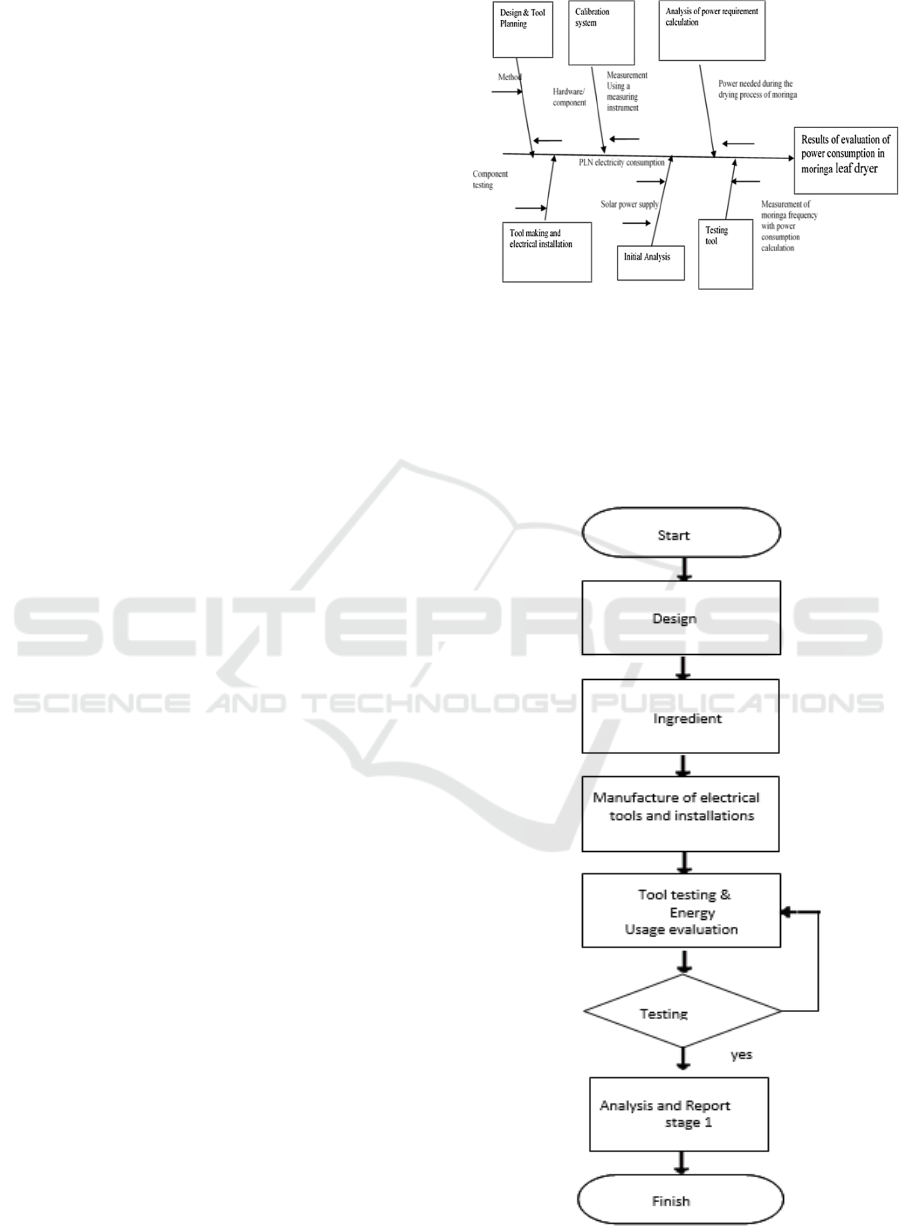
2.5 Fishbone Diagram
To provide an overview of research activities, the
stages of research work, outputs, and measurable
achievement indicators, can be seen through the
fishbone diagram and research chart in Figure 3
below:
Figure 2: Fishbone Diagram.
3 METHOD
The following is the methodology used in the study to
evaluate the power consumption of the moringa leaf
dryer.
Figure 3: Research Flowchart.
iCAST-ES 2021 - International Conference on Applied Science and Technology on Engineering Science
606
There are three stages in this research: the design of
the tool, the manufacture, installation of the device
and the testing of the tool, and the evaluation of the
power consumption of the tool. The variable
parameters in this study are:
1.
Moringa leaf drying process time
2.
Calculation of power supply from collectors and
PLN electricity
Sub Variable:
a)
Drying evenly on moringa leaves
b)
Collector's power supply
c)
The average time used to dry the leaves perfectly
d)
Evaluation of the power used in the entire drying
process
3.1 Research Procedure
The research carried out is applied from the results of
planning, which is suitable for research to observe the
condition of the tool directly. The research procedure
includes
1. Design & Planning
2. Material selection
3. Making tools and electrical installations
4. Installation
5. Tool testing and evaluation of power usage
6. Repair,
7. Data collection,
8. Analysis and report generation.
3.2 Types and Sources of Data
The data sources and types of data in this study
consisted of primary data, namely data that were
directly measured in the field and the results of the
calculation of the information design obtained from
the measurement results, and secondary data that
supported primary data and the results of observations
and document data.
3.3 Data Collection Techniques
Data collection techniques consist of primary and
secondary data, namely: In preliminary data, the
researcher uses data collection techniques and
measurements directly in the field, the results are
recorded according to the data group and observes
and analyses the Moringa leaf dryer that has been
made, and records the phenomena that occur—being
researched. While secondary data, researchers collect
data from literature both in books and secondary data
works and perform data analysis.
3.4 Data Analysis
Data analysis, both primary data and secondary data
were analysed in the following way:
1. Analysis of quantitative research
Researchers measure the existence of a variable
using research instruments. Then analyse
looking for the relationship of one variable with
other variables.
2. Description analysis
Data is analysed according to the data group
using experimental methods and actions. Both
ways are determined by paying attention to the
cause of the occurrence.
3. Trial/Testing Prosedure
Before testing moringa leaves, ensure all
ingredients are in good condition and have gone
through the cleaning process. Ensure the shelves
in the dryer oven are in good condition and all
shelves are filled with Moringa leaves neatly and
densely. Ensures the temperature on the collector
up to 50 C and the maximum room temperature
of 40 after the Moringa leaves dry.
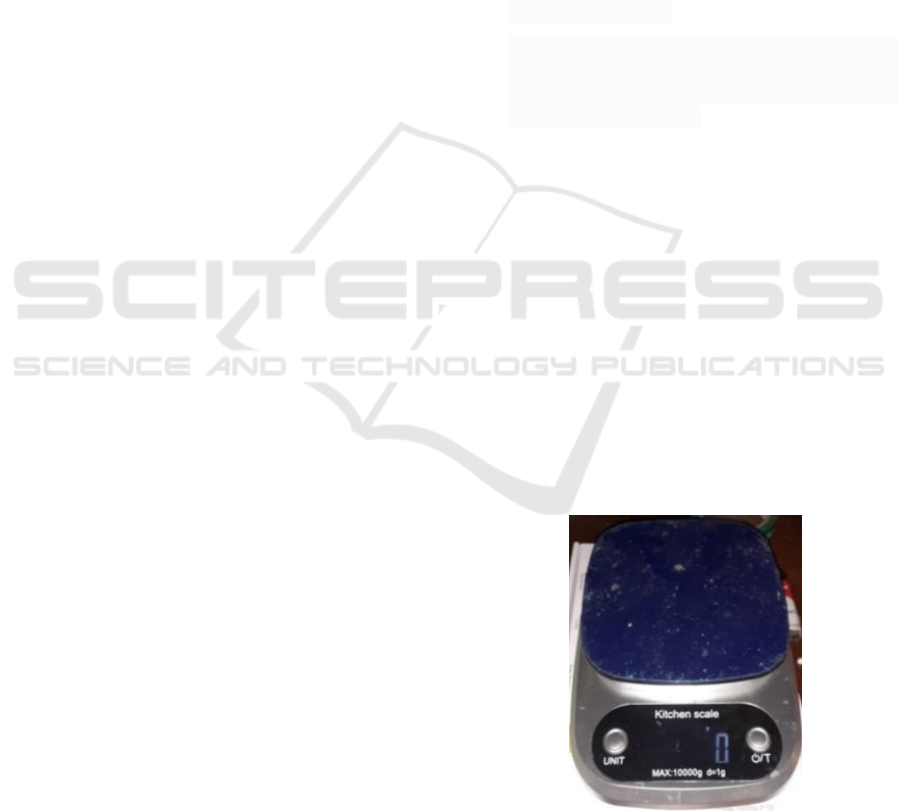
4. Measuring Instrument
Measuring instruments are required to obtain the
data to be analysed. In this research, Scales and
thermometer are utilized in collecting data.
Figure 4: Scales.
Evaluation of Power Consumption in Moringa Leaves Dryer
607
Scales used to measure the mass of the product before
and already dried. A thermometer used to measure the
temperature of the inside of the oven.
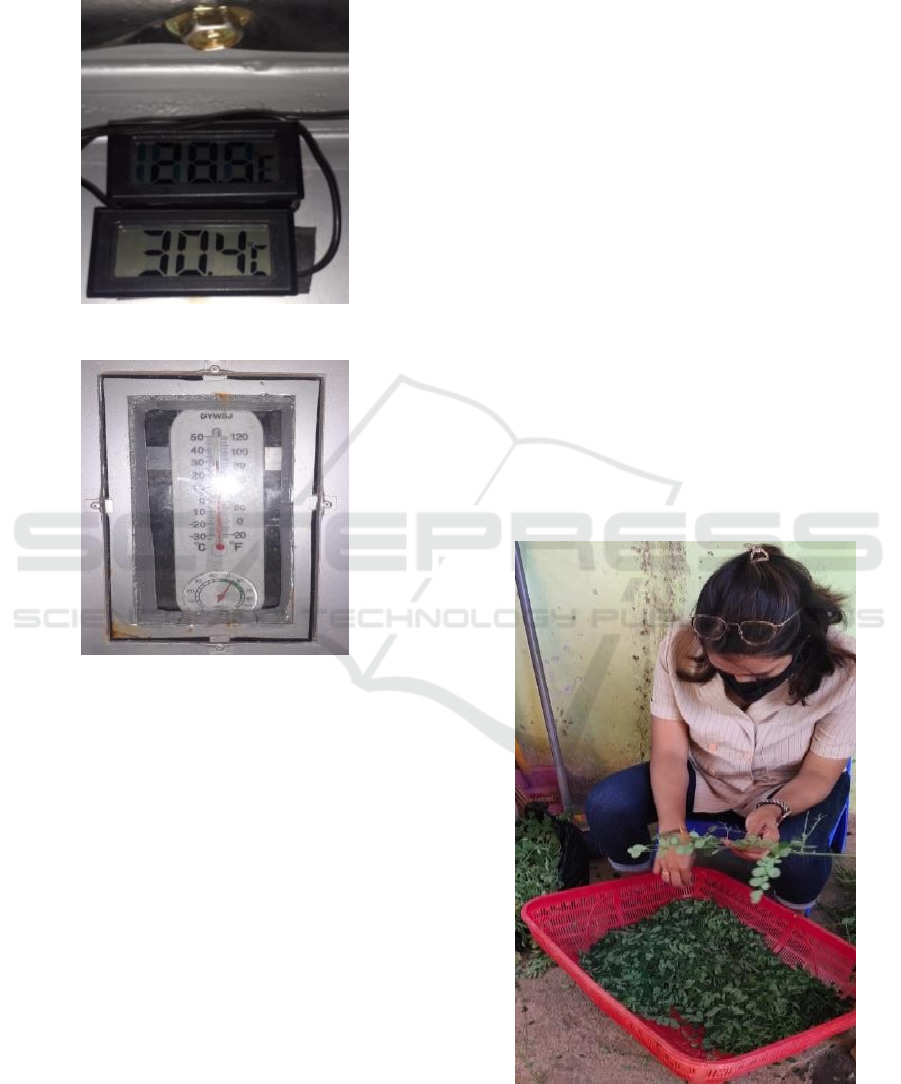
Figure 5: Thermometer inside the dryer.
Figure 6: Thermometer for outer measurement.
5. Testing Stages
Preparation
Preparing the equipment needed for the drying
process of moringa leaves includes the preparation of
the oven, namely the dryer shelves adjusted to the
weight of the moringa leaves to be dried. Check the
oven power plug, prepare the measuring instrument
to be used. Turn on the electric heater, observing the
oven temperature reaches the desired temperature
(47°C)
Data Retrieval
Data retrieval is done at the time difference of 1 hour
each, starting from the start of the drying process. The
measured data is Collector Temperature (°C), Dryer
Room Temperature (°C), Outer Temperature(°C),
Outer Humidity (%), Dryer Room Humidity (%),
Current (A), Voltage (V). Measurements are
performed on two conditions using and using Fan
Dryer, Fan Air Flow and heater.
Settlement
The completion stage of the drying process is done to
end the series of drying processes by turning off the
electric heater on the off button, removing the power
plug in the oven, then eliminating the shelves
containing dried moringa leaves and collecting them.
Then the rack is cleaned off the crumbs of moringa
leaves, followed by cleaning the inside of the oven
and tidying and packing the measuring instrument
used in the testing process.
4 DISCUSSION
Before drying, moringa leaves are first cleaned,
separated from the yellow leaves and dirt attached to
the leaves, then washed and queued. Moringa leaves
are placed neatly so as not to accumulate each other
so that in the drying process can be evenly distributed
on all surfaces of the leaves.
Figure 7: The process of cleaning and washing Moringa
leaves before being put into the oven for the drying.
iCAST-ES 2021 - International Conference on Applied Science and Technology on Engineering Science
608
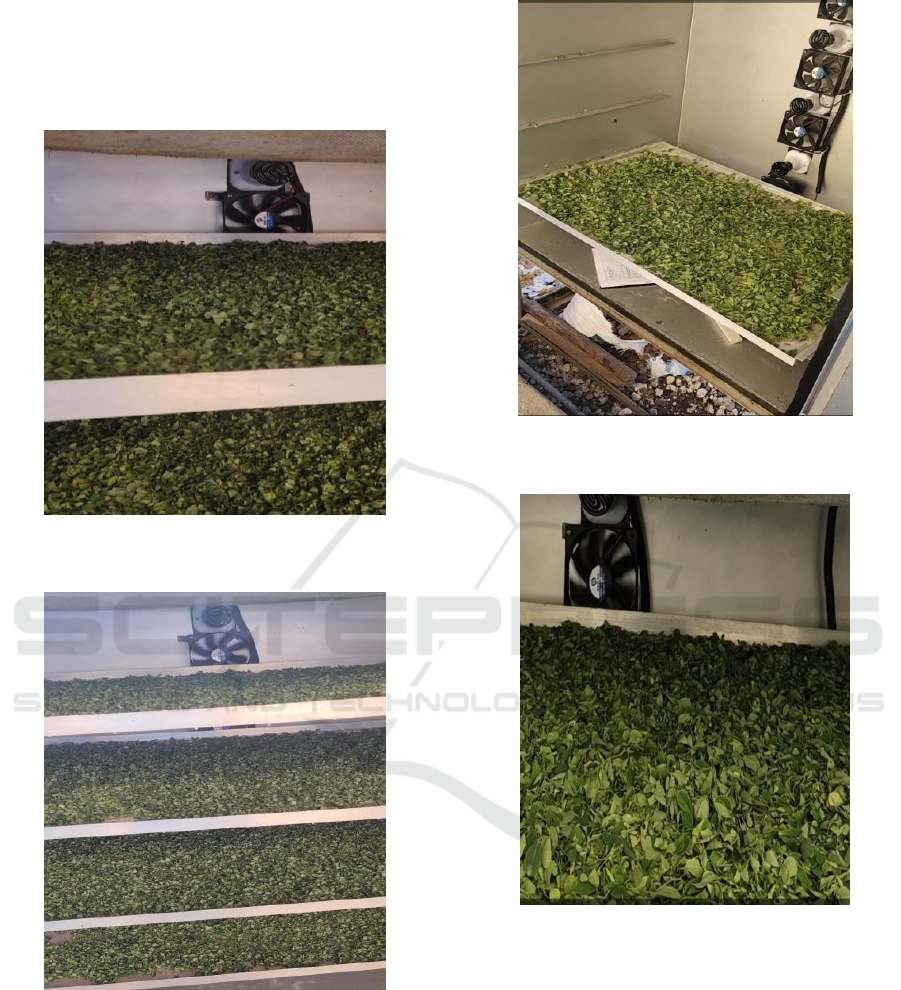
The drying process of moringa leaves is carried
out approximately for 24 hours. Moringa leaves are
evenly styled on each shelf consisting of 5 parts with
a total of testing that is 10,000 grams, 6000 grams,
4000 grams and 2000 grams.
Figure 8: Fresh Moringa leaves that have been leaned are
put into the oven for the drying process.
Figure 9: The drying process of Moringa leaves with the
half-dry result.
Figure 10: Drying moringa leaves with the result of an even
drought.
Figure 11: Drying moringa leaves one rack.
A. Moringa Testing Data
In table 1, measurement is done to 10,000 grams
moringa leaves with a difference of drying time of 1
hour. The Dryer Fan is on while Fan Air Flow inputs
and outputs is set to on and off state at certain
intervals of time. The heating process is done from
morning to night. In the afternoon the heater was left
in a state of off, while at night and dawn, the heater is
on. Some parameters considered in data collection are
:collector Temperature (°C), Dryer Room
Temperature (°C) Outside Temperature (°C ) Outdoor
Humidity (%), and Dryer Room Inertia (%).
Evaluation of Power Consumption in Moringa Leaves Dryer
609
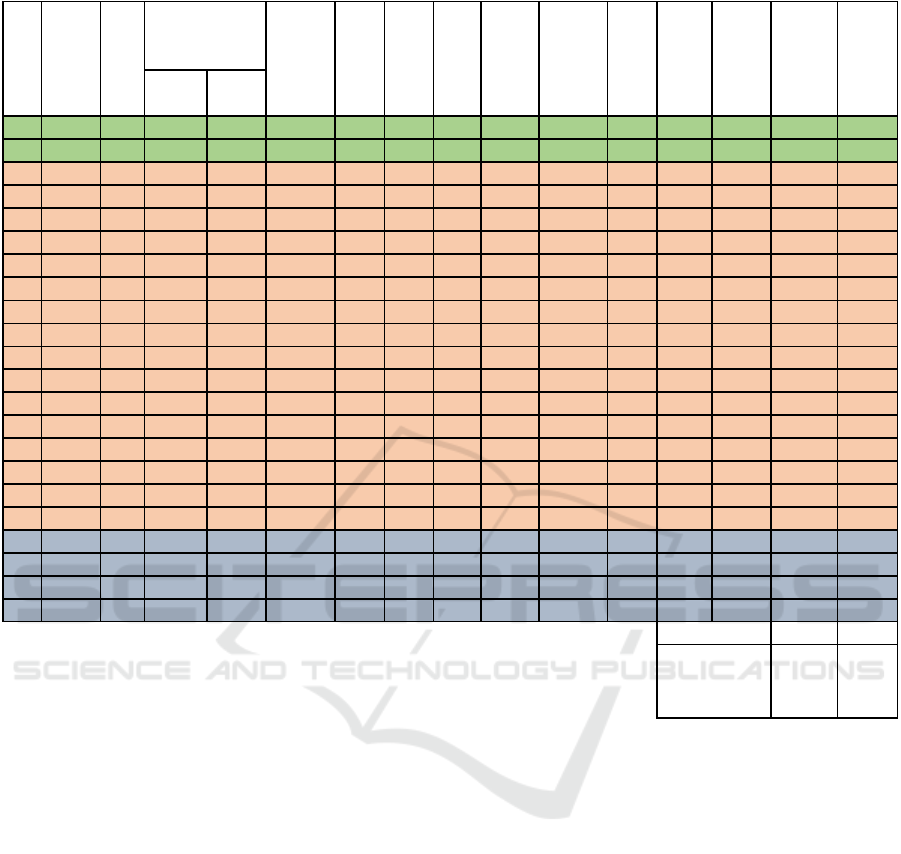
Table 1: Measurement of 10,000 grams of moringa leaves.
A. Calculation Analysis
1. Power Calculation (W) Formula:
P = Vx I x cos φ
I = 0.1 A
V= 214 V
Cos φ =0.9
P = 214 x 0.1 x 0.9
P = 19.26 watts
2. Energy Calculation (kWh)
Formula: E ; t = 1 hour
E = Pxt/1000
E = (19.26 x 1)/1000
E = 0.019 kWh
3. Calculation of Energy in Rupiah (basic electricity
tariff = Rp. 1444.70
E
Rp
= E
kwh x Tdl
E = 0.0193 x Tdl
E = 0.0193 x (1444.70)
E = Rp. 27,82
4. Average Energy Consumption Hourly (in Kwh
and Rupiahs)
Eave = Total Energy/ Drying Duration
Eave = 2.3008/22
Eave = 0.1046 Kwh/Hour
Eave (Rp) = 0.1046 x Rp. 1444.70
Eave = Rp. 151.11/ Hour
For Table 2, the price of electricity per kWh for
the period April-June 2021 for 1300 VA and 2200 VA
loads is Rp.1444.70. During measurement, the
conditions are divided into three conditions, namely
condition 1, condition 2 and condition 3. The time for
condition 1 is 15.00-16.00, time for condition 2 is
17.00-08.00, and time for condition 3 is 09.00-12.00.
Input Output
1 15:00 On On On Off 45 32 33 40 80 0.1 214 19.26 0.0193 27.82492
2 16:00 On On On Off 42 35 32 40 75 0.37 214 71.26 0.0713 102.9522
3 17:00 On Off On On 37 34 31 40 73 0.37 210 69.93 0.0699 101.0279
4 18:00 On Off On On 30 32 30 45 70 0.8 208 149.76 0.1498 216.3583
5 19:00 On Off On On 28 33 29 45 65 0.8 208 149.76 0.1498 216.3583
6 20:00 On Off On On 29 34 28 50 65 0.8 209 150.48 0.1505 217.3985
7 21:00 On Off On On 26.5 35 26 50 60 0.8 209 150.48 0.1505 217.3985
8 22:00 On Off On On 26 35.2 25.8 52 60 0.8 204 146.88 0.1469 212.1975
9 23:00 On Off On On 25 35 25.5 52 60 0.8 204 146.88 0.1469 212.1975
10 00:00 On Off On On 25 35 25.2 52 59 0.8 204 146.88 0.1469 212.1975
11 01:00 On Off On On 25 35 25 52 57 0.78 203 142.51 0.1425 205.8784
12 02:00 On Off On On 25 35 25 52 55 0.78 203 142.51 0.1425 205.8784
13 03:00 On Off On On 25 35 24 52 50 0.75 203 137.03 0.1370 197.96
14 04:00 On Off On On 25 35 24 52 50 0.75 203 137.03 0.1370 197.96
15 05:00 On Off On On 25 35 24 40 45 0.73 202 132.71 0.1327 191.7319
16 06:00 On Off On On 26 35 25 35 42 0.73 202 132.71 0.1327 191.7319
17 07;00 On Off On On 28 36 27 30 38 0.73 202 132.71 0.1327 191.7319
18 08:00 On Off On On 35 36 29 30 35 0.37 205 68.27 0.0683 98.62245
19 09:00 On Off On Off 43 36 32 25 33 0.1 205 18.45 0.0185 26.65472
20 10:00 On Off On Off 45 38 35 20 30 0.1 205 18.45 0.0185 26.65472
21 11:00 On Off On Off 49 39 35 25 30 0.1 205 18.45 0.0185 26.65472
22 12:00 On Off On Off 52 39 35 25 30 0.1 205 18.45 0.0185 26.65472
2.3008 3324.025
0.1046 151.092
Total
Energy
Consumption/ hour
Power
(W), Cos
Phi 0.9
Energi
(KWh) ,1
hour
duration
Energy in
Rupiahs
(Rp)
Voltage
(V)
Fan Air Flow
Drying
Room
Temper
ature
(°C)
Outdoo
r
Temper
ature(°C
)
Humidity
(%)
Drying
Room
Humidity
(%)
Current
(A)
No Time
Dryer
Fan
Heater
Collecto
r
Temper
ature
(°C)
iCAST-ES 2021 - International Conference on Applied Science and Technology on Engineering Science
610
Some calculation:
Condition 1. Fan air flow for both input and output is
on, while the heater is in the Off state.
Energy consumption for 2 hours
= 0.0193 + 0.0713 = 0.905 Kwh
Energy Consumption in Rp, for 2 hours
= 0.905 x Rp. 1444.70 =Rp. 130.78
Average energy in Kwh
= 0.905/2 Kwh
= 0.0452 Kwh
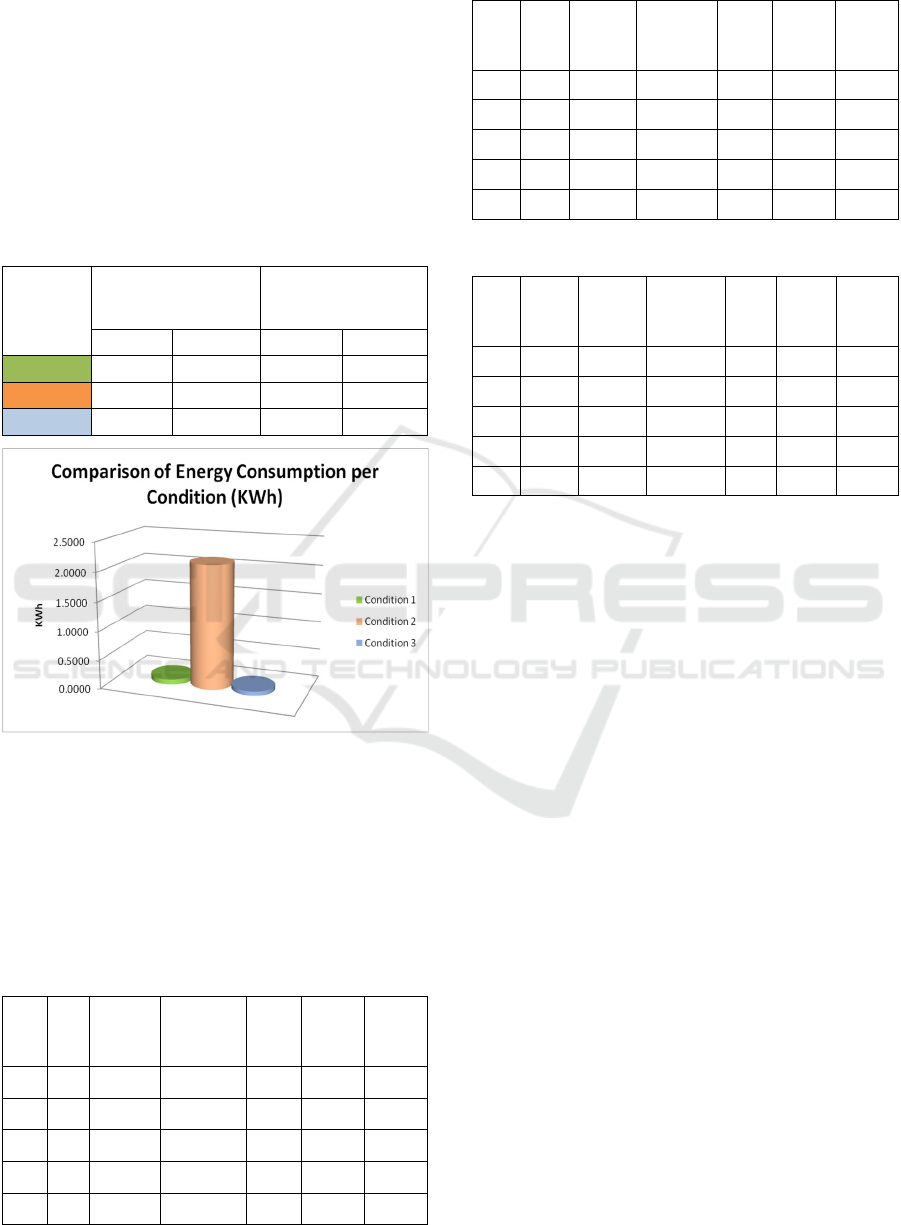
Table 2: Energy Consumption Per Condition (Watt).
Condition
Total Energy
Average Energy
consumption/
condition/Hour
Watt Rupiah Watt Rupiah
1
0,0905 130,7771 0,045261 65,38857
2
2,1365 3086,629 0,133532 192,9143
3
0,0738 106,6189 0,01845 26,65472
Figure 12: Energy graph per condition (watts).
The graph shows three conditions for energy
consumptions and the highest average energy
consumption is in condition 2, where the energy
consumed is around 2,1365 Kwh or Rp.3086,629
Experiment with product capacity 6000 grams
(Variation Oven Room Temperature)
Table 3: Moringa leaf measurement 6000 grams.
Time Heater
Collector
Temp. (°C)
Dryer Room
Temp.
(°C)
Outside
temp
(°C)
Outdoor
Humidity
(%)
Drying
Room
Humidity
(%)
15.00 Off 45 32 33 40 85
18.00 On 30 32 30 45 80
23.00 On 25 35 25,5 52 65
09.00 Off 43 36 32 25 36
12.00 Off 52 39 35 25 36
Table 4: Moringa leaf measurement 4000 grams.
Time Heater
Collector
Temp (°C)
Dryer Room
Temp
(°C)
Outside
temp
(°C)
Outdoor
Humidity
(%)
Drying
Room
Humidity
(%)
15.00 Off 45 32 33 40 90.2
18.00 On 30 32 30 45 88
23.00 On 25 35 25,5 52 70
09.00 Off 43 36 32 25 42
12.00 Off 52 39 35 25 42
Table 5: Moringa leaf measurement 2000 grams.
Time Heater
Collector
Temp (°C)
Dryer Room
Temp
(°C)
Outside
temp
(°C)
Outdoor
Humidity
(%)
Drying
Room
Humidity
(%)
15.00 Off 45 32 33 40 97
18.00 On 30 32 30 45 90
23.00 On 25 35 25,5 52 79
09.00 Off 43 36 32 25 48,7
12.00 Off 52 39 35 25 50
5 CONCLUSIONS AND
SUGGESTIONS
From the results of the dryness test of Moringa leaves
starting at 15.00 until 12.00 the next day, the effects
of Moringa drying are perfect, with even dryness on
all Moringa leaf surfaces. Some parameters obtained
from the measurement at 15.00 are Collector
Temperature is at 45°C, Dryer Room Temperature is
32°C, Outside Temperature is 33°C, External
Humidity is 40%, Drying Chamber Humidity is 80%,
Current is 0.1 A and Voltage is 214 Volt.
For drying process of 10000 grams of Moringa,
the Power (W) consumption with assumed power
factor/ Cos Phi 0.9 is 19.26 Watts. The energy (KWh)
for 1 hour is 0.0193 while the Energy in Rupiah (Rp)
is Rp. 27.8249. As for the calculation of energy
consumption per condition (wattage), in condition
two, the average energy of 0.133532 watts is Rp.
192.9143
Suggestion:
Further development can increase the load capacity of
Moringa; therefore, it can increase the amount of
production. It is necessary to optimise the automatic
control system for the drying temperature to be more
optimal. And testing in full load needs to be done
continuously to get more valid data.
Evaluation of Power Consumption in Moringa Leaves Dryer
611

REFERENCES
Zulfri, Syuhada, Hamdani., Kaji Eksperimental Sistem
pengeringan Hibrid Energi Surya Biomassa untuk
Pengering, Malaysia: Unversitas Syiah Kuala, 2012.
Y. Santosa, Pemanfaatan Energi Surya Dengan Efek
Rumah Kaca Dalam Perancangan Sistem Pengering
Kerupuk Ikan di Daerah Kenjeran., Surabaya:
Universitas Katalik Mandala Surabaya, 2012.
Ismawati, Pengeringan, Surabaya, 2012.
S. H. Zulfri, Kaji Experimental Sistem Pengering Hibrid
Energu Surya Biomassa Untuk Pengering Ikan,
Surabaya, 2012.
K. Thamrin, Rancangan Bangun Alat Pengering Ubi Kayu
Tipe Rak Dengan Memanfaatkan Energi Surya,
Sumatra: Fakultas Teknik Universitas Sriwijaya, 2011.
F. L. G. Cao, Simulasi Of A Sloped Solar Chimney Power
Plant In Lanzhou, Taiwan: Elvesier, 2011.
Bahari, Model Penyimpanan Energi Matahari Proses
Pembuatan Garam Laut, Kupang: Politeknik Negeri
Kupang, 2010.
Handini, Performa Sel Surya, Jakarta: Fakultasi Teknik
Universitas Indonesia, 2008.
Daryanto, Energi Masalah dan Pemanfaatannya Bagi
Kehidupan Manusia, Yogyakarta: Pusaka Widyatama,
2007.
H. Rosdaneli, Proses Pengeringan, Surabaya: Program
Studi Teknik Kimia, 2005.
K. Abdullah, Fish Drying Using Solar Energy, Jakarta:
Regional Workshops On Drying Technology, 2003.
A. Jansen. T.J, Teknologi Rekayasa Surya, Jakarta: Pradya
Paramita Jakarta, 1995.
P. Kreith. F, Prinsip-Prinsip Perindahan Panas, Jakarta:
Erlangga, 1986.
W. Arismunandar, Teknologi Rekayasa Surya, Jakarta:
Pradya paramita Jakarta, 1985.
iCAST-ES 2021 - International Conference on Applied Science and Technology on Engineering Science
612
