
Fulfillment of Quality of Service at Komodo Labuhan Bajo Airport to
Increase Passenger Satisfaction
Anie Adrianti Tuati
1
, Deasi D. A. A. Daud
2
and Amy Wadu
2
1
Civil Engineering Department, State Polytechnic of Kupang, Adi Sucipto Street, Kupang, Indonesia
2
Civil Engineering Department, State Polytechnic of Kupang, Kupang, Indonesia
Keywords: Service Quality, Airport, Importance Performance Analysis, Gap Analysis, Kano's Model.
Abstract: Komodo International Airport is the main gateway for tourists to eastern Indonesia, especially foreign
tourists. The increase in flight service users at the Komodo Labuhan Bajo Airport Operator Unit is very
high, this is evidenced by the frequent accumulation of passengers. This research uses Importance
Performance Analysis, Gap Analysis and Kano Model. The results showed that there are 3 service variables
Komodo Airport has the highest negative gap value, the highest is There are 3 service variables Komodo
Airport has the highest negative gap value, the highest is var 20 Wifi facilities and public internet access are
available and functioning (-0.94), var 6 Availability and adequacy of the number of trolleys (-0.75), and var
22 Availability of clean and comfortable children's playroom facilities (-0.68). This high gap means that the
3 service variables have not met passenger expectations. There are 5 variables in the basic factor group,
namely: 1) Var1, Maintained and the availability of cleaning facilities at the airport terminal, (2) Var2,
Suitability of seating capacity in the waiting room, (3) Var5, Adequate airport terminal lighting, (4) Var16,
Availability and adequacy of commercial areas and (5) Var24, Availability of smoking room facilities.
1 INTRODUCTION
Air transportation has a function as a supporting
element (servicing sector) and a driving element
(promoting sector). The function as a supporting
element is related to the ability of air transportation
to provide effective and efficient transportation
services. The function as a driving element is the
ability of air transportation to open isolated areas
and remote areas and islands (Wijaya, 2017).
Service quality is an important issue in the
management of transportation services at this time,
including air transportation services. Public service
providers in this case airports do not only focus on
providing infrastructure, facilities, and human
resources, but the development of information
encourages transportation service users to be more
critical of public services, by proactively
communicating with consumers to find out the
dynamics of consumer needs, therefore it is
necessary to continuous improvement of public
services is carried out.
The development of airport traffic requires good
facilities and infrastructure as well as services so
that it can accommodate the movement of air traffic
flows and provide comfort for air transportation
service users, the better and more complete the
existing facilities and infrastructure, the better the
efficiency and level of service based on applicable
minimum standards (Frans,dkk, 2014).
Komodo International Airport is an airport
located in the city of Labuhan Bajo, West Manggarai
Regency - NTT - East Nusa Tenggara and is the
main gateway for tourists to eastern Indonesia,
especially foreign tourists. Labuan Bajo is one of 19
villages located in West Manggarai Regency, East
Nusa Tenggara which is being developed into a
tourist city. Komodo Airport is the second airport
with the most passengers in the NTT region, after
Eltari Airport, Kupang. The total number of arriving
passengers at the airport reached 35,284 passengers
in October, while the total departing passengers
reached 35,173 passengers. This amount accounts
for 20.82% of the total passengers who come to the
province of NTT (Agustiyanti, 2019). The increase
in traffic, especially the movement of international
passenger, aircraft and cargo flows at Komodo
Airport is a potential market for business actors.
Especially after the development of Komodo Airport
is completed in 2021. The increase in flight service
Tuati, A., Daud, D. and Wadu, A.
Fulfillment of Quality of Service at Komodo Labuhan Bajo Airport to Increase Passenger Satisfaction.
DOI: 10.5220/0010948900003260
In Proceedings of the 4th International Conference on Applied Science and Technology on Engineering Science (iCAST-ES 2021), pages 545-551
ISBN: 978-989-758-615-6; ISSN: 2975-8246
Copyright
c
2023 by SCITEPRESS – Science and Technology Publications, Lda. Under CC license (CC BY-NC-ND 4.0)
545

users at the Komodo Labuhan Bajo Airport Operator
Unit, West Manggarai Regency - NTT is very high,
this is evidenced by the frequent accumulation of
passengers due to inadequate terminal and aircraft
transport capacity, for this reason it is necessary to
widen the capacity of the passenger terminal,
especially in the terminal section. Passengers when
passengers get off the plane (the baggage claim area)
so that there is no accumulation of passengers and
congestion there. In order to become an airport with
a high level of service satisfaction, the management
of Komodo Airport must provide the best service to
users.
Based on the description above, it is necessary to
do research to find out how passengers perceive
services at Komodo Labuhan Bajo Airport?, find out
how the gap between the level of importance and
satisfaction in service variables is, find out whether
service variables are included in the main priority in
the quadrant Importance Performance ? and find out
what service variables are included in the basic
factor group in the Kano model? The problem
limitation in this study is the passenger's perception
of services at Komodo Labuhan Bajo Airport
(Subekti, 2016).
2 RESEARCH METHODOLOGY
2.1 Research Stages
The research stages begin with initial observations,
data collection, data processing and analysis, to
drawing conclusions and suggestions. This research
starts from identifying problems that occur after
direct observation in the study area. This is done to
find out the problems that occur in the study area.
The area of study and the scope of issues to be
discussed are also limited. The analysis stage is a
follow-up after data processing is completed. The
purpose of this stage is to understand and analyze
the results of data processing in depth. The analysis
is carried out with Validity and Reliability Tests on
service quality, Importance Performance Analysis
(IPA) is used to compare the extent to which the
performance of an activity is perceived by users or
customers when compared to the level of satisfaction
desired/perceived, Gap Analysis (Pranidiwya, 2015).
The difference or distance between the expectations
or the level of interest of the passengers and the
service received by the passengers results in the
quality of service based on the perceptions of the
passengers themselves and the Kano Model aims to
categorize product/service attributes that are able to
satisfy customer needs. Kano's analysis of data and
images used an interest classification diagram,
namely based on explicit and implicit interest
classifications. Implicit interest is the interest
obtained from the correlation between the interests
of one another using the Spearman correlation
coefficient. Explicit interests are interests that are
stated or determined directly by consumers (Wijaya,
2011).
2.2 Data Collection
There are 4 stages of data collection method, namely
the first stage of the interview, namely the method of
collecting data by asking and answering questions.
The second stage is a questionnaire, which is a
method of collecting data by compiling a list of
questions or questionnaires to respondents in
writing, making it easier to process data. The third
stage is the study of literature and the last is the
research instrument, the research instrument used in
the form of a list of questions or questionnaires
consisting of 35 questions about the importance of
service quality at the airport and 35 questions about
the performance of service quality at the airport.
Before the list of questions was used, the validity
and reliability of the questionnaire was tested with a
total of 100 respondents
3 RESULT AND DISCUSSION
3.1 Determination of Number of
Samples
The total population is calculated by the average
number of passengers from 2015 to 2020, so the
total population used in this study is: 336650
passengers. The sample size used in the study was
= 99 rounded up to 100 samples
3.2 Reliability and Validity Test
This study uses 35 service variables referred to from
the Regulation of the Minister of Transportation
Number PM 178 of 2015 concerning Service
Standards for Airport Service Users. The items of
the research variables were tested statistically to
determine the validity and reliability. Cronbach's
alpha coefficient value of a total of 35 variables of
iCAST-ES 2021 - International Conference on Applied Science and Technology on Engineering Science
546
importance is 0.938. The value of the Cronbach
alpha coefficient on all 35 question variables at the
level of satisfaction/performance is 0.960. A
construct or variable is said to be reliable if it gives a
Cronbach alpha value > 0.60 (Sunyoto, 2009). This
means that the level of importance and satisfaction
variables are reliable for use in research. The
validity test was carried out by Pearson correlation
analysis in the SPSS program. This is done to
determine the correlation of items/variables of
importance level 1, 2, 3 and so on up to 35 to the
total score of importance level. The value of r table
for the number of samples is 100, with a significance
of 1% is 0.256. Table 1 below presents the Pearson
correlation coefficient on 35 variables of importance
and level of satisfaction.
Based on table 1, it can be seen that 35 variables
of importance and level of satisfaction have a
significant correlation at the 1% level. This means
that all variables are valid and can be used in
research.
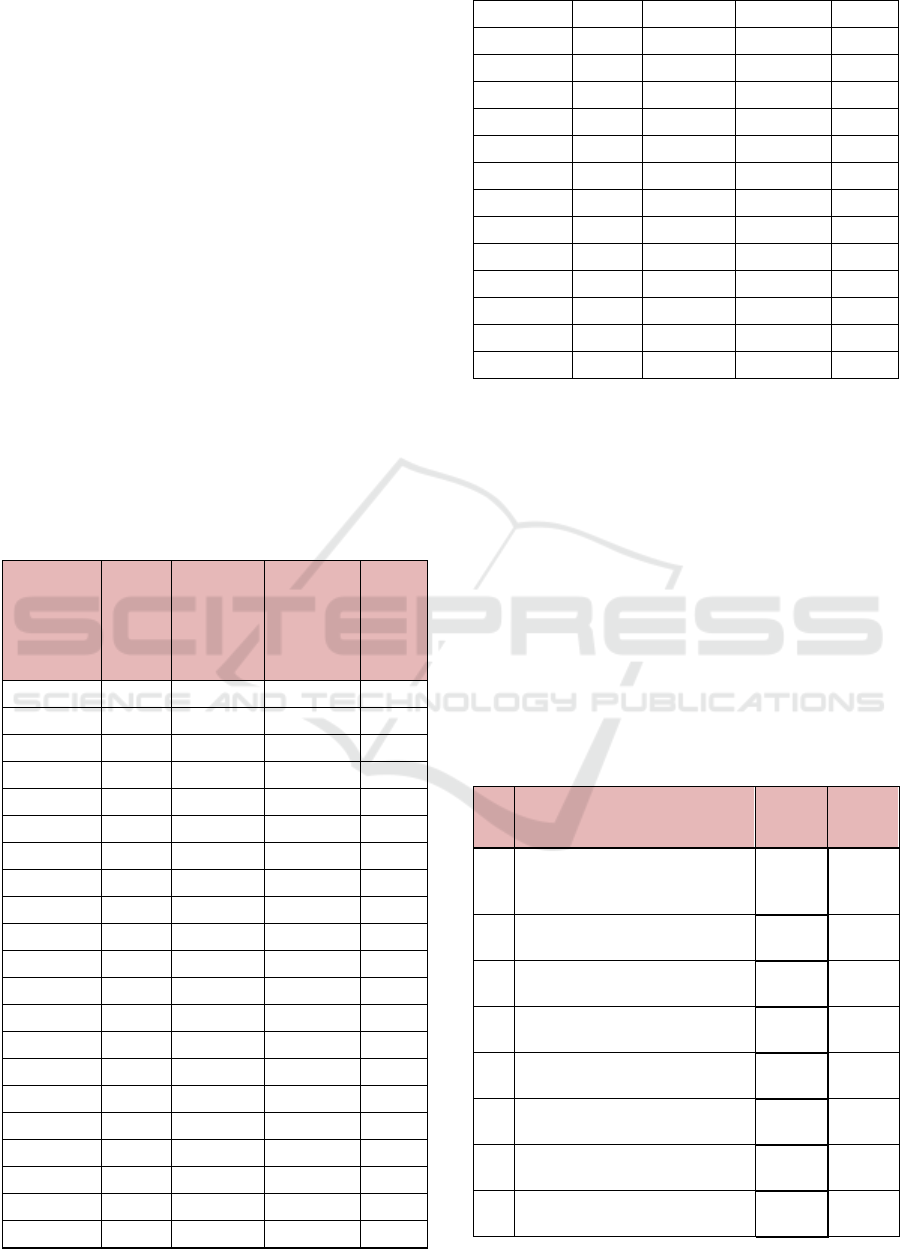
Table 1: Pearson Correlation Coefficient Values on 31
Level of Interest Variables and Satisfaction Level.
Variable
Table r
value
Interest
Rate
Correlation
Coefficient
Satisfaction
Level
Correlation
Coefficient
Validity
Variable 1 0.256 0.477* 0.443* Valid
Variable 2 0.256 0.491* 0.575* Valid
Variable 3 0.256 0.670* 0.677* Valid
Variable 4 0.256 0.481* 0.535* Valid
Variable 5 0.256 0.392* 0.536* Valid
Variable 6 0.256 0.534* 0.526* Valid
Variable 7 0.256 0.633* 0.541* Valid
Variable 8 0.256 0.613* 0.544* Valid
Variable 9 0.256 0.643* 0.629* Valid
Variable 10 0.256 0.686* 0.686* Valid
Variable 11 0.256 0.691* 0.691* Valid
Variable 12 0.256 0.662* 0.662* Valid
Variable 13 0.256 0.650* 0.650* Valid
Variable 14 0.256 0.626* 0.626* Valid
Variable 15 0.256 0.674* 0.674* Valid
Variable 16 0.256 0.693* 0.693* Valid
Variable 17 0.256 0.532* 0.532* Valid
Variable 18 0.256 0.632* 0.632* Valid
Variable 19 0.256 0.692* 0.692* Valid
Variable 20 0.256 0.612* 0.612* Valid
Variable 21 0.256 0.604* 0.604* Valid
Variable 22 0.256 0.455* 0.455* Valid
Variable 23 0.256 0.701* 0.701* Valid
Variable 24 0.256 0.267* 0.267* Valid
Variable 25 0.256 0.732* 0.732* Valid
Variable 26 0.256 0.565* 0.565* Valid
Variable 27 0.256 0.681* 0.681* Valid
Variable 28 0.256 0.711* 0.711* Valid
Variable 29 0.256 0.685* 0.685* Valid
Variable 30 0.256 0.687* 0.687* Valid
Variable 31 0.256 0.640* 0.640* Valid
Variable 32 0.256 0.670* 0.670* Valid
Variable 33 0.256 0.620* 0.620* Valid
Variable 34 0.256 0.623* 0.623* Valid
Variable 35 0.256 0.566* 0.566* Valid
Source: SPSS output data, * significant at 1% level (2-
sided test)
3.3 Interest Level Analysis
The questionnaire used used a Likert scale 5. Each
item/variable was scored according to the
respondents' answers. A scale of 1 means not
important and a scale of 5 means very important.
There are 35 variables and 100 respondents used in
the analysis of research data. Table 2 below presents
the total score and average of 35 variables of
importance at Komodo Labuhan Bajo Airport.
Table 2: Values/Scores and Average Weights of 35
Variables of Level of Interest at Komodo Labuhan Bajo
Airport.
No Variable
Total
Score
Average
Ӯ
1
Maintained and the
availabilityof cleaning
facilities at the airport terminal
477 4.77
2
Appropriate seating capacity
in the waitin
g
room
451 4.51
3
Adequacy of baggage service
equipment
410 4.1
4
Availability of facilities for air
circulation (AC, Fan)
417 4.17
5
Sufficient lighting/lighting
system for airport terminals
442 4.42
6
Availability and sufficient
number of trolle
y
s
455 4.55
7
Clean and tidy checkin
counter
416 4.16
8
Sufficient number and area of
chec
k
-in counters
407 4.07
Fulfillment of Quality of Service at Komodo Labuhan Bajo Airport to Increase Passenger Satisfaction
547
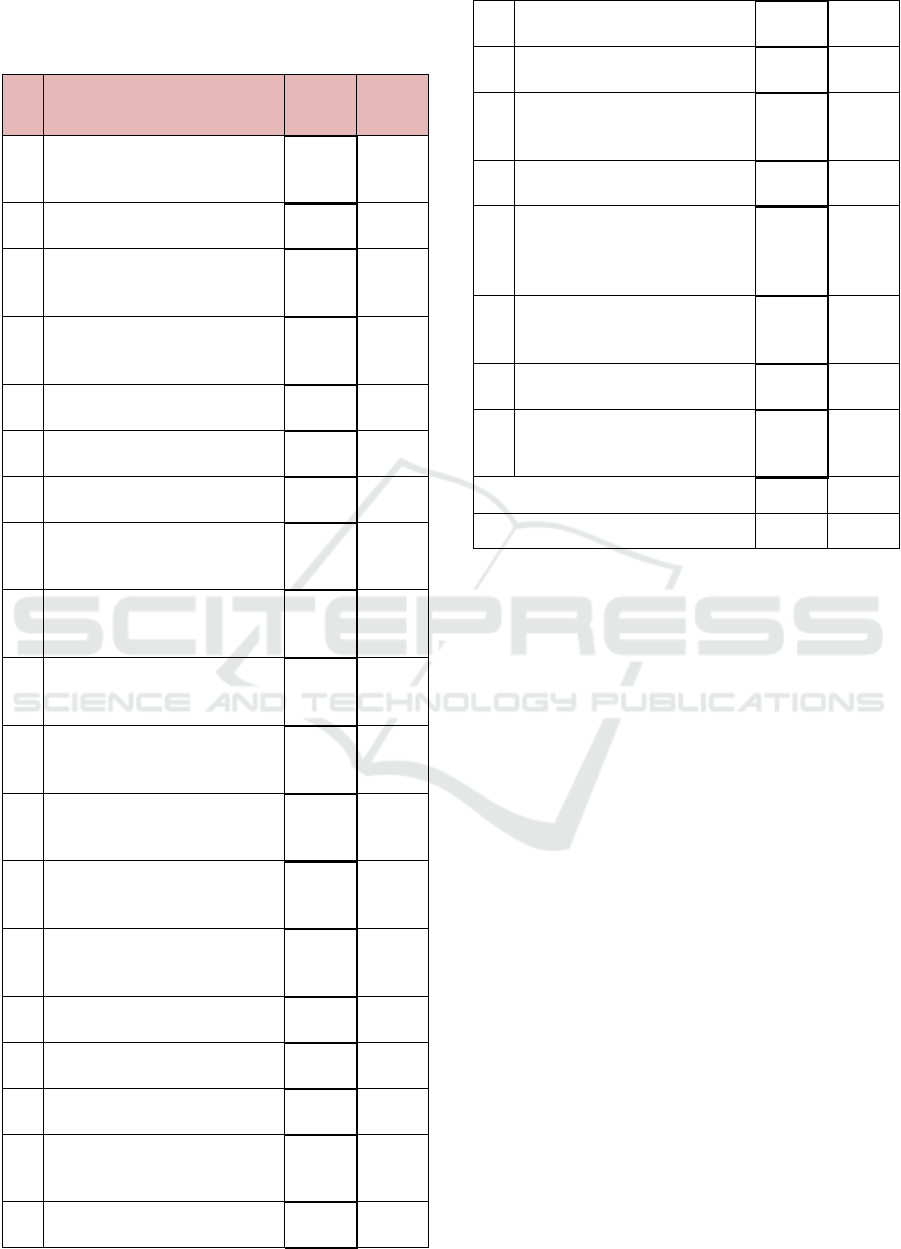
Table 2: Values/Scores and Average Weights of 35
Variables of Level of Interest at Komodo Labuhan Bajo
Airport (cont.).
No Variable
Total
Score
Average
Ӯ
9
Availability of Public
Information System
(announcement) facilities
415 4.15
10
Availability of flight progress
displa
y
(FIDS) facilit
y
412 4.12
11
Clarity of information from
the public address system
(si
g
na
g
e)
473 4.73
12
Information center counter
facilities that are easy to find
and informative
442 4.42
13
The coolness and comfort of
the passen
g
er waitin
g
room
440 4.4
14
Availability of complete toilet
facilities and eas
y
to fin
d
415 4.15
15
Cleanliness and comfort of
toilet facilities
412 4.12
16
Availability and adequacy of
commercial area
(canteen/restaurant)
434 4.34
17
Availability of computer
facilities for online ticket
purchases
406 4.06
18
Availability and convenience
of prayer rooms/places of
worship
415 4.15
19
Availability of facilities for
charging electronic devices
(char
g
in
g
)
412 4.12
20
Wifi facilities and public
Internet access are available
and functionin
g
474 4.74
21
Availability of special room
facilities for mothers and
b
abies (nurser
y
)
408 4.08
22
Availability of clean and
comfortable children's
pla
y
room facilities bermain
418 4.18
23
Availability of passenger
facilities with special needs
414 4.14
24
Availability of smoking room
facilities (smokin
g
area)
473 4.73
25
Availability of ATM facilities
and mone
y
chan
g
ers
409 4.09
26
Availability of
lounge/executive waiting
room for special passen
g
ers
417 4.17
27
Availability of adequate
parkin
g
area facilities
414 4.14
28
Cleanliness and tidiness of the
appearance of officers
420 4.2
29
Friendliness & ability of
officers in servin
g
408 4.08
30
Availability of advanced
transportation information
from the airpor
t
417 4.17
31
Easy access and transportation
from/to the airpor
t
415 4.15
32
Cabin crew conveys
information during the flight,
is responsive, skilled, friendly
and looks neat and polite
472 4.72
33
The facilities provided on the
plane to serve passengers are
in
g
ood and clean condition
408 4.08
34
There is a car park for 80% of
the bus
y
time passen
g
ers
417 4.17
35
There are facilities to get on
and off the plane (Use of the
g
arbarata)
414 4.14
Amount 14949 149.49
427.11 4.27
Source: primary data processed, 100 respondents
Based on table 2 above, it can be seen that the
average value of 35 variables of importance ranges
from 4.06 to 4.77. The variable awake and the
availability of cleaning facilities at the airport
terminal has the highest average value. This means
that passengers consider this variable important to be
provided by the airport in serving passengers. While
the variable Availability of computer facilities for
purchasing online tickets is the variable with the
lowest average value, this means that passengers do
not consider this facility important in Komodo
Labuhan Bajo airport services. Overall, the average
of 35 research variables shows a value of 4.27. This
means that 35 service variables have an important
meaning for passengers in supporting service
activities at the airport.
3.4 Analysis of Satisfaction Level
The satisfaction level variable also consists of 35
items which are calculated using a Likert scale 5.
Number 1 shows passengers who are not satisfied
with the service, number 2 is not satisfied, number 3
means normal, number 4 indicates satisfactory service
and number 5 means service is very satisfying for the
customer passenger. Table 3 below presents the total
score and average of 35 service satisfaction variables
at Komodo Labuhan Bajo Airport.
iCAST-ES 2021 - International Conference on Applied Science and Technology on Engineering Science
548
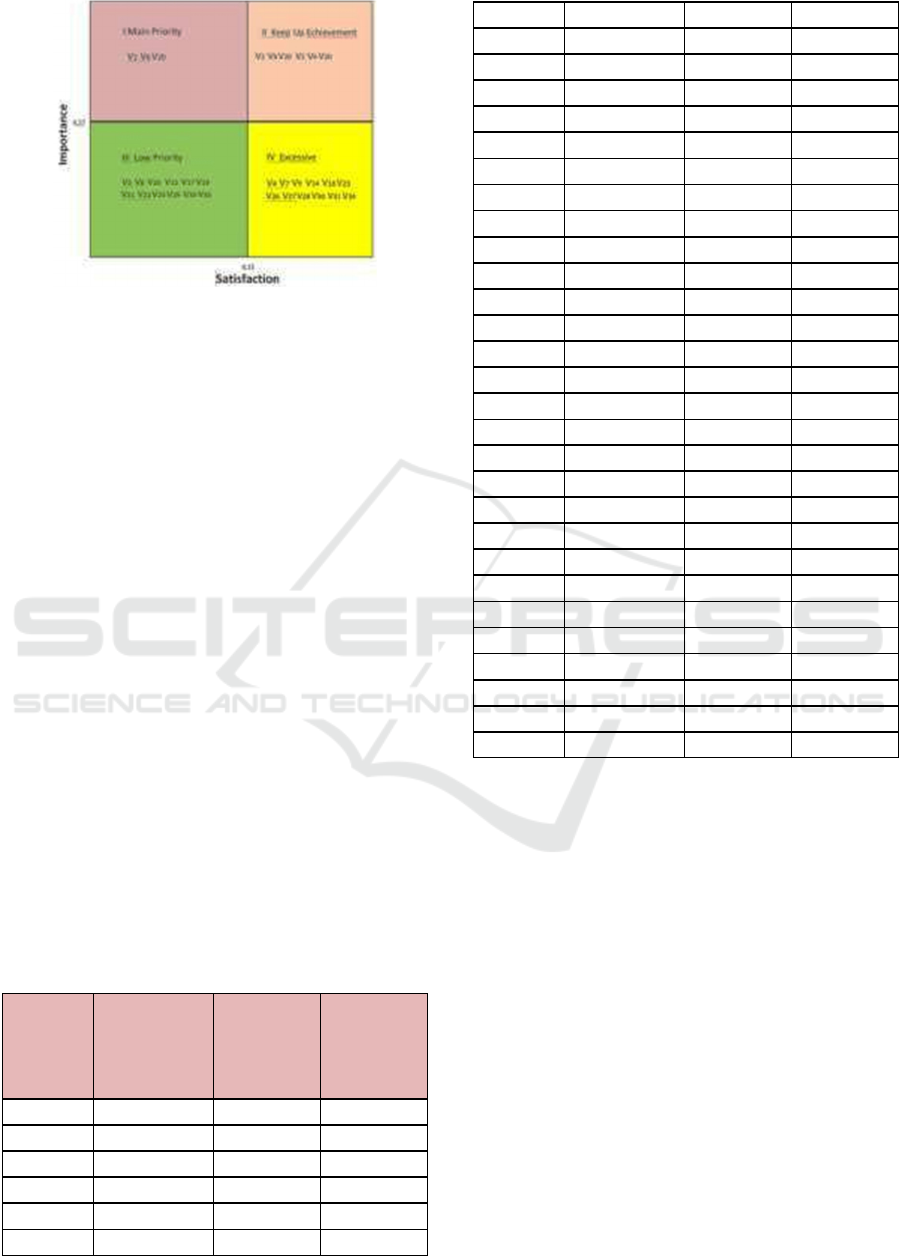
Source: Analysis Results, 2020
Figure 1: Importance Performance Quadrant of Komodo
Airport Labuhan Bajo.
Based on Figure 1, it can be seen that there are 3
service variables in quadrant 1. These variables are
(1) var 02, suitability of seating capacity in the
waiting room, (2) var 06, availability and adequacy
of the number of trolleys and (3) var 20, Wifi
facilities and public internet access are available and
functioning. Variables that are in quadrant 1 are
important variables that must get the main priority
for service improvement from Komodo Labuhan
Bajo Airport.
3.5 Gap Analysis (Gap)
Based on the analysis of the level of importance and
level of satisfaction there is a gap between the two.
The difference illustrates the distance that exists
between the value of satisfaction/performance and
the value of importance (Pranidiwya and Miharja,
2015). Table 4 below presents the difference/gap
between the average level of importance and
satisfaction for each service variable at Komodo
Labuhan Bajo Airport.
Table 3: Differences/Gaps Between Levels of Interest and
Satisfaction of Service Variables at Komodo Airport
Labuhan Bajo.
Variable
Average
Satisfaction/
Performance
(X)
Average
Interest (Y)
Difference /
Gap
Var 1 4.77 4.77 0
Var 2 3.81 4.51 -0.7
Var 3 3.55 4.1 -0.55
Var 4 4.19 4.17 0.02
Var 5 4.45 4.42 0.03
Var 6 3.8 4.55 -0.75
Var 7 4.2 4.16 0.04
Var 8 3.95 4.07 -0.12
Var 9 4.18 4.15 0.03
Var 10 4.14 4.12 0.02
Var 11 4.75 4.73 0.02
Var 12 4.45 4.42 0.03
Var 13 4.42 4.4 0.02
Var 14 4.18 4.15 0.03
Var 15 4.14 4.12 0.02
Var 16 4.65 4.34 0.31
Var 17 3.65 4.06 -0.41
Var 18 4.2 4.15 0.05
Var 19 4.14 4.12 0.02
Var 20 3.8 4.74 -0.94
Var 21 3.81 4.08 -0.27
Var 22 3.5 4.18 -0.68
Var 23 4.16 4.14 0.02
Var 24 4.74 4.73 0.01
Var 25 3.98 4.09 -0.11
Var 26 4.18 4.17 0.01
Var 27 4.15 4.14 0.01
Var 28 4.21 4.2 0.01
Var 29 4.09 4.08 0.01
Var 30 4.19 4.17 0.02
Var 31 4.16 4.15 0.01
Var 32 4.73 4.72 0.01
Var 33 4.09 4.08 0.01
Var 34 4.18 4.17 0.01
Var 35 3.72 4.14 -0.42
Source: primary data processed, 2021
Based on table 3, it can be seen that there are 35
service variables, 10 have negative gap values. This
means that the gap between the value of
satisfaction/performance and the value of the level
of importance of passengers, each attribute has not
all met the expectations of passengers. The three
variables with the highest negative values are var 20
Wifi facilities and public internet access that are
available and functioning (-0.94), var 6 Availability
and adequacy of the number of trolleys (-0.75), and
var 22 Availability of children's playroom facilities
clean and comfortable by (-0.68). This shows that
passengers feel the highest dissatisfaction with the
service aspect at Komodo Labuhan Bajo Airport.
The three variables with the smallest minimum
values are var 2 Suitability of seating capacity in the
waiting room (-0.7), var 25 Availability of ATM and
money changer facilities (-0.11) and var 8 Adequate
number and area of check-in counters (- 0.12). This
Fulfillment of Quality of Service at Komodo Labuhan Bajo Airport to Increase Passenger Satisfaction
549
shows that passengers feel low dissatisfaction with
the service aspect at Komodo Labuhan Bajo Airport.
The results of the gap analysis can be concluded that
based on passenger perceptions, service variables at
Komodo Labuhan Bajo Airport are still below
passenger expectations.
3.6 Analysis of Services with the Kano
Model
Kano model is used to determine the service
variables included in the basic factor. If there are
variables that fall into this category, the airport
should improve services so that it can achieve
passenger satisfaction. The level of implicit
importance is obtained from the correlation
coefficient between item variables 1, 2, 3 and so on
until 35 to the total score of the level of importance.
Spearman correlation in SPSS program is used to
calculate the value of implicit importance level. The
following table 5 presents the values of the explicit
and implicit importance levels at Komodo Labuhan
Bajo Airport.
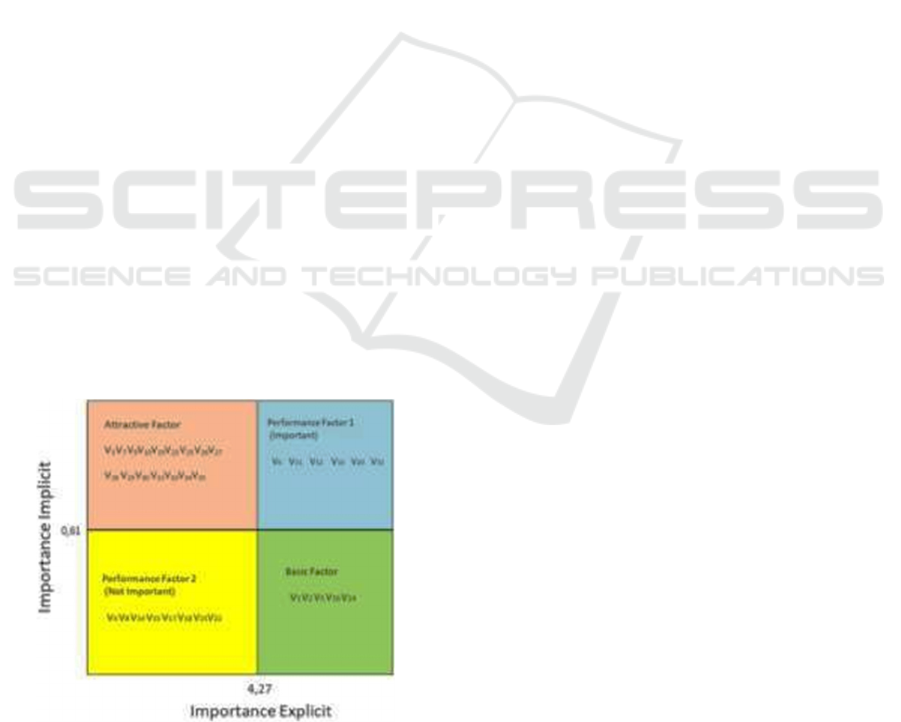
There are 6 service variables in the performance
group 1, namely: (1) Var6, Availability and
adequacy of the number of trolleys, (2) Var11,
Clarity of information from the public address
system (signage), (3) Var12 Information center
counter facilities that are easily found and
informative, (4) Var13, Coolness and comfort of the
passenger waiting room, (5) Var20, Wifi facilities
and public internet access available and functioning
and (6) Var32, Cabin crew conveys information
during the flight, responsive, skilled, friendly and
well-groomed and polite. Based on the canoe model,
Source: Analysis Results, 2021
Figure 2: Grouping of Implicit and Explicit Interest
Variables Komodo Airport Labuhan Bajo.
it can be seen that the variables in the basic factor
group are variables that are the basic needs that must
be met by Komodo Labuhan Bajo Airport. In
addition to the variables in the basic factor group,
Komodo Labuhan Bajo Airport must also pay
attention to the service variable in the performance 1
(important) group.
If the variables in this group are met, then
Komodo Labuhan Bajo Airport can increase
passenger satisfaction, and vice versa if it is not
fulfilled it can reduce passenger satisfaction.
4 CONCLUSION
Based on the results of data analysis, it can be
concluded as follows:
1. Passenger perceptions of service quality at
Komodo Labuhan Bajo Airport indicate that
overall the satisfaction variable is in the ordinary
classification with an average value of 4.15 while
the importance variable is in the important
classification with an average value of 4.27
2. There are 3 service variables Komodo Airport
has the highest negative gap value, the highest is
var 20 Wifi facilities and public internet access
are available and functioning (-0.94), var 6
Availability and adequacy of the number of
trolleys (-0.75) , and var 22 Availability of clean
and comfortable children's playroom facilities of
(-0.68). This high gap means that the 3 service
variables have not met passenger expectations,
3. The value of the passenger satisfaction index is
97%, meaning that based on the passenger's
perception the services provided by Komodo
Labuhan Bajo Airport are good.
4. There are 3 service variables that require the
main priority of service improvement from
Labuhan Bajo Airport, NTT, namely (1) var 02,
suitability of seating capacity in the waiting
room, (2) var 06, availability and adequacy of the
number of trolleys and (3) var 20 , Wifi facilities
and public internet access are available and
functioning.
5. There are 5 variables in the basic factor group,
namely: 1) Var1, Maintained and available
cleaning facilities at airport terminals, (2) Var2,
suitability of seating capacity in waiting rooms,
(3) Var5, airport terminal lighting system
sufficient, (4) Var16, Availability and adequacy
of commercial area (canteen/restaurant) and (5)
Var24, Availability of smoking room facilities
(smooking area).
iCAST-ES 2021 - International Conference on Applied Science and Technology on Engineering Science
550

REFERENCES
Wijaya, H., Beik, I. S., & Sartono, B. (2017). The
Influence of Banking Service Quality on Customer
Satisfaction and Loyalty of XYZ Syariah Bank in
Jakarta. Journal of Business and Management
Applications (JABM), 3(3), 417.
Frans, John Hendrik, Harnen Sulistio and Achmad
Wicaksono. 2014. Study of Capacity, Services and
Strategy for El Tari Airport Development Kupang. J-
PAL Vol 5 No.2 pages 44-53.
Agustiyanti, (2019, December 26). Re: Labuan Bajo
Economic Anomaly, Candidate Location for the 2023
APEC Summit; https://katadata.co.id/agustiyanti/
finansial/5e9a4c 3d40d96/anomali-ekonomi-labuan-
bajo-calon- location-perteuan-ktt-apec-2023
Subekti, Sitti, 2016, Fulfillment of Service Quality at H.
Hasan Ende Airport to Improve Passenger
Satisfaction, Transportation Research and
Development Agency.
Sunyoto, Y. (2020). Auditor's experience, professional
commitment, and knowledge on financial audit
performance in Indonesia.
Pranidiwya, Wena Anggana and Miming Miharja. 2015.
Passenger Perception of Aspects of Airport Domestic
Departure Terminal Services (Case Study: Bandar
Soekarno-Hatta International Air).
Wijaya, Tony. 2011. Service Quality Management.PT
Index: Jakarta.
Fulfillment of Quality of Service at Komodo Labuhan Bajo Airport to Increase Passenger Satisfaction
551
