
Impact of Land-use Change on Surface Runoff
in Manikin Basin et Kupang Regency
Arnoldus Nama, Yacob Victor Hayer and Fabianus Jawal S. Nope
Department of Civil Engineering, State Polytechnic of Kupang, Jl. Adisucipto, Penfui-Kupang, Indonesia
Keywords: Manikin Basin, Land Use Change, Image Classification, Soil and Water Assessment Tool, Runoff.
Abstract: The study assessed the impacts of land-use change on runoff in the Manikin Basin, using the Soil and Water
Assessment Tool (SWAT) model. The model use to predict runoff for two scenarios. Both scenarios using
different land-use data. Land-use for the SWAT model is obtained from remote sensing images. Two remote
sensing images of Landsat 8 OLI from the years of 2014 and 2019 were used for land-use classification using
the supervised classification method. The classification results show that there is a change in land-use. Area
of land-use with the highest increase was shrubs with an increase of 20.25% (19.98 km
2
), while the land-use
area with the highest decrease was forest with a decrease of 14.1% (13.92 km
2
). The average annual runoff of
the first scenario is 134.7404, while the average annual runoff of the second scenario is 140.0596 mm, there
is an increase of 3.98% (5.19 mm). This study shows that, the increase in the area of shrubs, and the reduction
in forest area have an impact on increasing surface runoff in the Manikin watershed
1 INTRODUCTION
Watershed response to rainfall is determined by the
characteristics of the watershed, including
topography, soil moisture and type, land cover, and
drainage density of the watershed. The topography
and drainage density of the watershed are the physical
characteristics of the watershed that do not change. In
contrast to physical characteristics which tend to be
static, biophysical characteristics such as land cover
and soil interact dynamically. When these biophysical
factors change, the surface runoff and flood discharge
will also change as a watershed response to rainfall.
Research related to the impact of land-use
changes on surface runoff has been conducted by
several researchers. Patil, N. S. et. al. (2020), used the
hydrological model (SWAT), to find out the effect of
land-use change on surface runoff in the Hiranyakeshi
watershed, India. Astuti I. S. et al. (2019), assessed
the effect of land change on surface runoff using the
SWAT model in the Upper Brantas watershed,
Indonesia. Pertiwi, P. C. et. Al. (2020), analyzed the
effect of land-use change on runoff discharge using
the Nakayasu synthetic unit hydrograph (HSS)
method in the Pompong watershed, Indonesia..
Research related to the impact of land-use change
on surface runoff generally concludes that there is a
relationship between both factors. However, it should
be noted that the watershed response to rainfall differs
from one watershed to another. Therefore, an analysis
was carried out to understand the impact of land-use
change on runoff in the Manikin watershed. The Soil
and Water Assessment Tool (SWAT) hydrological
model was used to predict surface runoff. The
simulation of surface runoff in the Manikin watershed
consists of two scenarios that are simulated with two
different land-use data.
2 STUDY AREA
The study area (Fig. 1) is the Manikin River Basin in
West Timor, East Nusa Tenggara Province,
Indonesia. Manikin Basin has a catchment area of
about 98.69 km2, with the longest channel reach from
the upper basin of approximately 32 km to its outfall
into Kupang bay.
According to the Schmidth-Fergudon climate
classification, West Timor is dominated by climate
type E, which is a slightly dry area with savanna
forest vegetation. The rainy season in most of these
areas is short of only 3-4 months, starting in
December and ending in March or April. Annual
rainfall varies from 848 mm on Panite, on the south
526
Nama, A., Hayer, Y. and Nope, F.
Impact of Land-use Change on Surface Runoff in Manikin Basin et Kupang Regency.
DOI: 10.5220/0010948700003260
In Proceedings of the 4th International Conference on Applied Science and Technology on Engineering Science (iCAST-ES 2021), pages 526-533
ISBN: 978-989-758-615-6; ISSN: 2975-8246
Copyright
c
2023 by SCITEPRESS – Science and Technology Publications, Lda. Under CC license (CC BY-NC-ND 4.0)
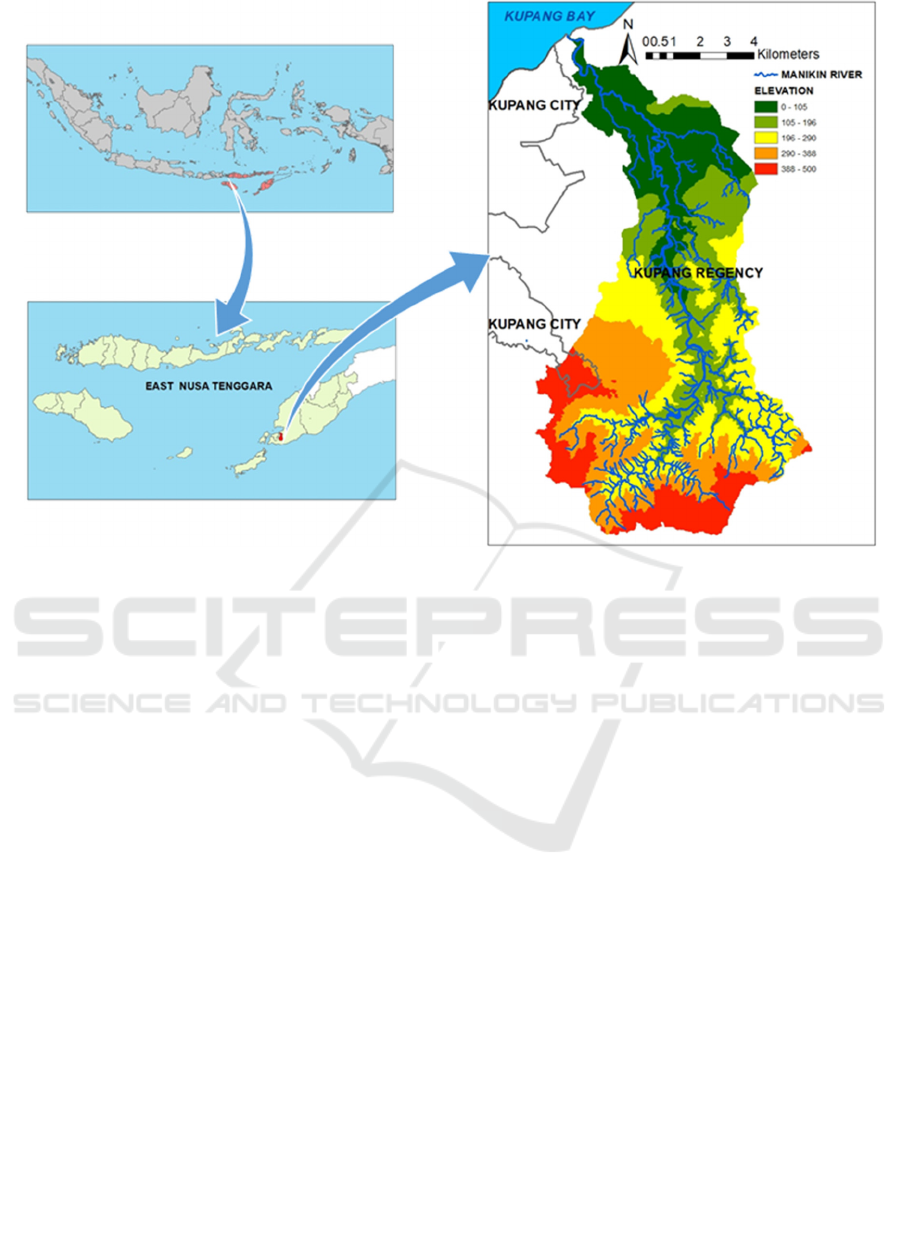
Figure 1: The Manikin Basin.
coast of Timor to 2,890 mm on Lahurus at the peak
of Mount Lakaan, but most of West Timor receives
900-1,500 mm of rainfall per year, and Kupang (the
provincial capital) and surrounding areas have an
average rainfall of 900-1,500 mm. average rainfall is
1,420 mm per year.
The land cover in the manikin watershed is
dominated by shrubs and savanna, while in the upper
watershed there is little forest area. The settlement
area is generally located in the downstream part of the
watershed close to the Kupang City, slightly in the
middle and upstream of the watershed.
3 MATERIALS AND METHODS
3.1 SWAT Model Description
The hydrological SWAT model used in this study is
a predictive model for watershed-scale developed by
Dr. Jeff Arnold for USDA Agricultural Research
Service (ARS). SWAT was developed to predict the
impact of land management practices on water,
sediment, and agricultural chemicals that enter rivers
or water bodies in a complex watershed with varying
soil, land use, and management over a long period of
time. SWAT models belong to a class of
ecohydrological process-based watershed models,
which can be defined as continuous dynamic models
based on mathematical descriptions of physical,
biogeochemical, and hydrochemical processes,
incorporating elements of both physical and semi-
empirical properties. The basic process model is not
completely distributed in three dimensions, but
usually includes a reasonable spatial disaggregation
scheme, apply into sub-watersheds and hydrological
response units (HRUs).
The basic SWAT model inputs are rainfall,
maximum and minimum temperature, radiation, wind
speed, relative humidity, land cover, soil, and
elevation. The watershed is subdivided into sub-
basins that are spatially related to one another, and,
further, into hydrological response units (HRUs),
which are homogenous units that possess unique
land-use/land-cover and soil attributes and account
for the complexity of the landscape within the sub-
basins. The subbasin watershed components can be
categorized as follows: hydrology, weather, erosion
and sedimentation, soil temperature, plant growth,
nutrients, pesticides, and land management. In the
land phase of the hydrological cycle, runoff is
predicted separately for each HRU. and routed to
obtain the total runoff for the watershed.
In SWAT, surface runoff is most commonly
predicted using the SCS curve number (SCS-CN)
method, which was developed by the Soil
Impact of Land-use Change on Surface Runoff in Manikin Basin et Kupang Regency
527

Conservation Service (now known as Natural
Resource Conservation Service/NRCS). It calculates
surface runoff according to the equation:
𝑄
𝑅
𝐼
𝑅
𝐼
𝑆
where Q
surf
is the surface runoff (mm), R
day
is the
rainfall for the day (mm), I
a
is the initial abstraction
including surface storage, interception, and
infiltration prior to runoff (mm), which is commonly
approximated as 0.2S, and S is a retention parameter.
The results of the SWAT model are calibrated
with monthly discharge data of 2012 measurements,
at locations near outlets. In the Manikin, river there is
no discharge measurement station, and the existing
discharge data is taken from manual measurements.
Nash-Sutcliffe Efficiency (NSE) was used to test the
reliability of the model. The NSE value of the test
results is 0.776. Referring to Moriasi et. al, in Nama
(2016), this model is very suitable to be applied in the
Manikin Basin.
3.2 Data
The data used in this study include: (a) daily rainfall
and temperature data – from Indonesian Meteorology
and Geophysics Agency; (b) streamflow data – from
Directorate General for Water Resources, Indonesian
Ministry of Public Works (c) land cover – generated
from Landsat 8 OLI satellite imagery (2014 and
2019); (d) soil map– from Indonesian Ministry of
Agriculture; and (e) digital contour map in Esri
format file (scale 1: 12500) from Indonesian
geospatial information agency, used to generate
digital elevation model (DEM).
3.3 Land-cover Assessment
Satellite imagery from Landsat 8 OLI (Operational
Land Imager), were obtained from U.S. Geological
Survey (USGS, http://earthexplorer.usgs.gov). There
are two images, the first is a 2014 image, the date of
recording (Date Acquired) 25 April 2014, and the
second is the 2019 image, the recording date is 23
April 2019, with a path-row of 111-067 (Fig.2). This
image covers the entire area of Kupang Regency,
Rote Ndao Regency, and part of South Central Timor
Regency, East Nusa Tenggara Province. This data is
a free download from the USGS website
(http://eartheexplorer.usgs.gov).
To obtain land use as input into the model, the
software ENvironment for Visualizing Images (ENVI
5.1) and ArcGIS 10.5, was used to perform image
analysis and classification. The ENVI software is
used for image pre-processing, such as radiometric
correction, noise reduction, and image sharpening.
Image sharpening using the Gram-Schmidt Pan
Sharpening method. To classify satellite images into
land use maps, ArcGIS 10.5 software is used.
Classification using the supervised technique with the
maximum likelihood classification method. Seven
land use classes were considered, namely: Grassland,
Shrub, Water Body, Cornfield, Forest-Mixed, Paddy
fields, and Residential-Medium Density.
Figure 2: The Landsat 8 OLI (Operational Land Imager) image path-row 111-067, True color.
iCAST-ES 2021 - International Conference on Applied Science and Technology on Engineering Science
528
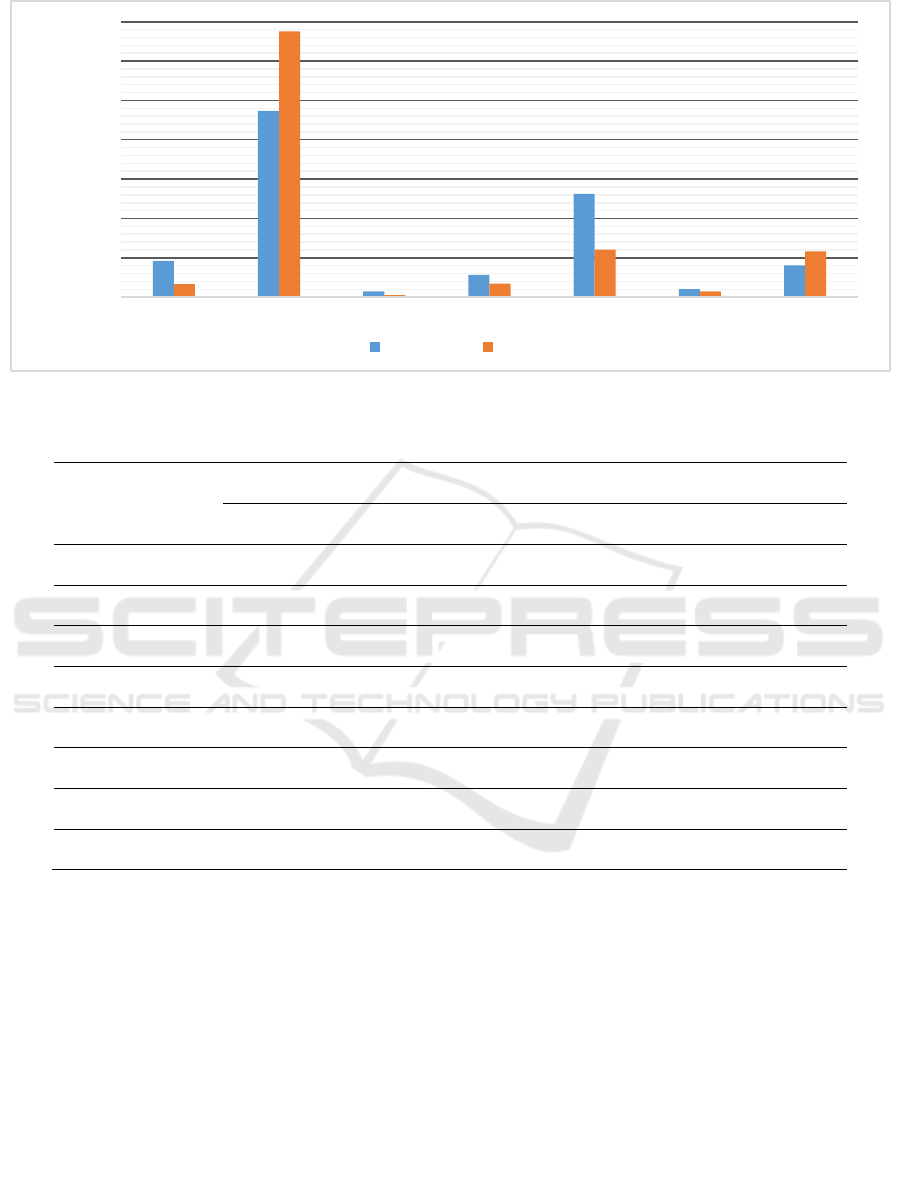
Figure 3: The comparison of land classes in 2014 and 2019.
Table 1: Land use in study area.
Land-use
2014 2019
Land area (Km
2
) % area Land area (Km
2
) % area
Grassland 9.16 9.28 3.24 3.29
Shrub 46.68 47.3 66.67 67.55
Water Body 1.46 1.48 0.48 0.49
Corn field 5.56 5.63 3.42 3.47
Forest-Mixed 25.86 26.2 11.94 12.1
Paddy fields 1.99 2.02 1.44 1.46
Residential 7.98 8.09 11.49 11.64
Total area
98.69
100
98.69
100
4 RESULTS AND DISCUSSION
4.1 Image Analysis
Landsat Images were classified to land-use map
using the Maximum Likelihood supervised
classification method. Classification results are
compared with observations. Verification was
carried out at 34 locations in and around the
watershed. Comparison of classification results and
field conditions is used to calculate the level of
accuracy in supervised interpretation, which is
85.29%.
The results of the classified images for the years
2014 and 2019 are shown in Table 1. The
distribution of land classes in the watershed, for
2014 and 2019 respectively, is shown in Figure 3.
As shown in Table 1, the residential land class
experienced a significant increase from 8.09% to
11.64%. Meanwhile, the land classes that decreased
in the area were grasslands and forests with changes
of 9.2% to 3.29% and 26.2% to 12.1% respectively.
0
10
20
30
40
50
60
70
Grassland Shrub Water Body Corn field Forest Paddy fields Residential
Percentage area
2014 2019
Impact of Land-use Change on Surface Runoff in Manikin Basin et Kupang Regency
529
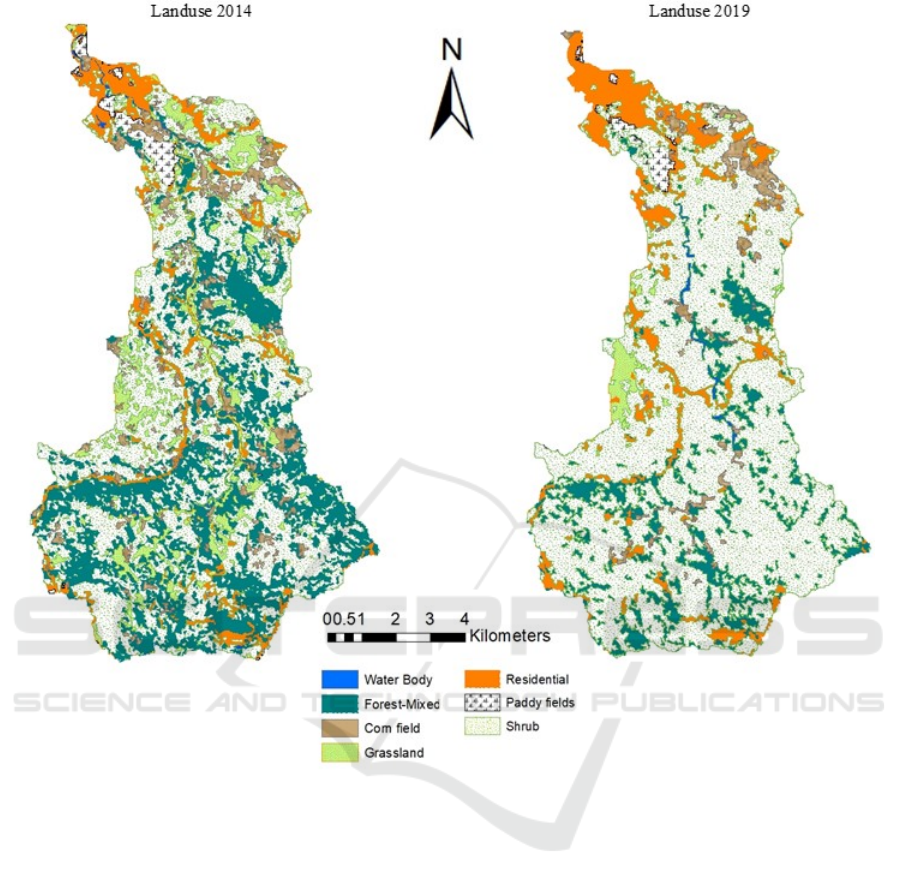
Figure 4: Land use class distribution on watershed for the year of 2014 and 2019.
4.2 Preparing Precipitation Data
Before the precipitation data is used, the consistency
test is carried out using the multiple mass curve
method. There are 4 precipitation stations in and
around the watershed used for SWAT model input,
namely Oeletsala, Baun, Tarus, and Penfui
precipitation stations. The results of the consistency
test of the four stations did not show any data
inconsistency with the respective correlation
coefficients above 0,99.
The next step is to do statistical calculations to
arrange rain data in a format that can be read by the
SWAT model. The statistical calculation of rain data
includes (1) average amount of precipitation falling in
month (PCPMM). (2) standard deviation for daily
precipitation in month (PCPSTD), (3) skew
coefficient for daily precipitation in month
(PCPSKW), (4) probability of a wet day following a
dry day in month (PR_W1), (5) probability of a wet
day following a wet day in month (PR_W2), (6)
average number of days of precipitation in month
(PCPD), and (7) extreme half-hour rainfall for month
(RAINHHMX).
WGN Parameters Estimation Tool software
(downloaded for free at https://swat.tamu.edu) can be
used to calculating Statistics of precipitation for swat
model input. Overall results of the calculation of
precipitation statistics are arranged according to a
format that can be read by the SWAT model (SWAT
version 2012), then inputted into the SWAT database
(WGEN_user). An example of calculating rain
statistics can be seen in Table 1.
iCAST-ES 2021 - International Conference on Applied Science and Technology on Engineering Science
530
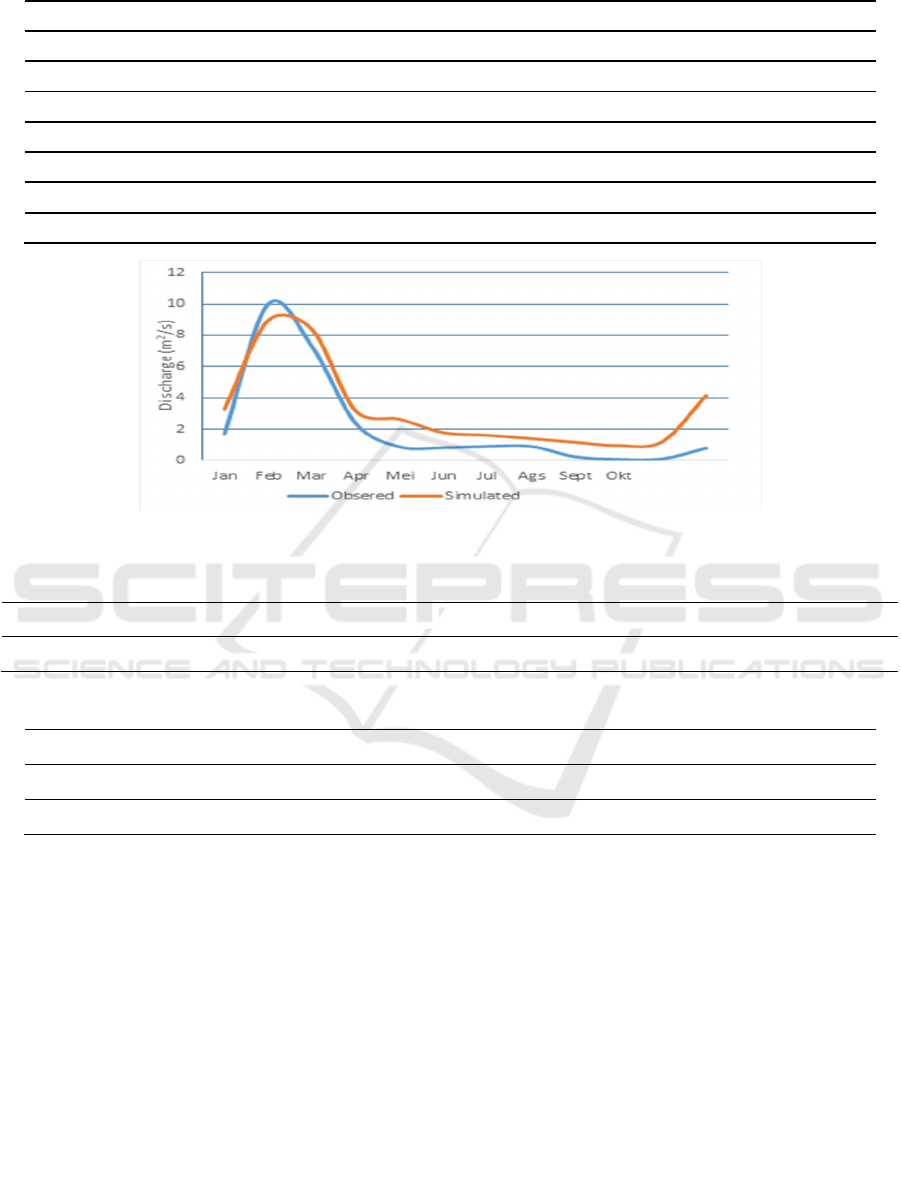
Table 2: Statistical precipitation parameter of Tarus Rain gauge.
Jan Feb Mar Apr May Jun Jul Aug Sep Oct Nov Dec
PCPMM 309.0 444.9 267.9 87.6 18.0 5.9 4.8 1.4 1.9 17.8 138.8 245.2
PCPSTD 14.5 21.6 15.4 9.1 3.0 1.5 1.2 0.7 1.0 2.6 12.2 14.9
PCPSKW 1.9 1.7 2.6 4.9 6.9 12.5 11.1 16.1 16.3 5.5 3.6 3.5
PR_W1 0.5 0.5 0.3 0.2 0.0 0.0 0.0 0.0 0.0 0.1 0.2 0.4
PR_W2 0.7 0.9 0.8 0.5 0.4 0.5 0.5 0.3 0.3 0.2 0.5 0.7
PCPD 20.2 21.9 19.4 8.4 2.4 1.4 1.2 0.2 0.2 2.7 10.2 19.5
RAINHHMX 73.0 95.5 83.0 83.0 28.0 25.0 18.0 11.0 18.0 20.0 87.0 109.0
Figure 5: Graph of the relationship between the measurement discharge and the calibrated model discharge.
Table 3: The model evaluation statistics and performance.
Observed mean St. dev Simulated mean St. dev C
p
MAE NSE R
2
2.175 3.141 3.227 2.729 0.256 1.052 0.776 0.951
Table 4: Monthly run off.
Jan Feb Ma
r
A
pr
Ma
y
Jun Jul Au
g
Se
p
Oct Nov Dec
2014 18622 42078 39337 8274 4455 0.001 0.0 0.0 0.0 49 2093 18070
2019 19318 43593 40950 8583 4678 0.001 0.0 0.0 0.0 51 2171 18883
4.3 Hydrological Modelling
The output of a model after being calibrated must be
evaluated statistically for the field data, although the
graph of the output of the model after calibration and
field measurements shows that the difference is not
too significant. This is done to determine the
suitability of the model with field data and to avoid
too large a deviation between the model results and
the field data. To test the reliability of the model, in
this study several statistical indicators were used,
namely the Correlation Coefficient (R2), Mean
Absolute Error (MEA), Coefficient Performance
(Cp), and Nash-Sutcliffe Efficiency (NSE). Figure 3
shows a graph of the relationship between the
measurement discharge and the calibrated model
discharge, while the results of the model reliability
test presented in Table 2.
4.4 Runoff Depths
The output of the SWAT model simulation is
discharge, runoff, total sediment, etc., however,
the only runoff will be discussed here. The
impact of land change on runoff can be seen in
table 4 and table 5.
Impact of Land-use Change on Surface Runoff in Manikin Basin et Kupang Regency
531

Figure 6: Total monthly run of.
Table 5: Annual run off.
Total (mm) Average (mm)
2014 132977 134.7404
2019 138227 140.0596
As presented in Tables 4 and 5, there was an
increase in runoff from the first scenario to the second
scenario, both monthly and annual runoff. The largest
total runoff for the two scenarios occurred in
February, which was 43,593 mm, the lowest occurred
in June, which was 0.001 mm. From July to
September are period that are no rainfall in this area
(dry season), therefore there is no runoff in this
period. The average annual runoff for the first
scenario is 134,7404 mm or about 8,279% of the total
annual rainfall (mean annual rainfall is 1627,511
mm). For the second scenario, the average surface
runoff is 140.0596 mm, or about 8.606% of the total
annual average rainfall. From this description, the
average runoff for the two scenarios is very small
compared to the total average rainfall. This condition
occurs because only storm rainfall cause runoff. The
deep of rain that causes runoff requires further
analysis.
There is an increase in annual runoff depth from
the first scenario to the second scenario. Average
annual runoff increased by 3.948% (5.19 mm). Area
of land-use with the highest increase was shrubs with
an increase of 20.25% (19.98 km
2
), while the land-
use area with the highest decrease was forest with a
decrease of 14.1% (13.92 km
2
). Shrubs and forest
land-use classes have different runoff coefficients.
The forest land-use class has a runoff coefficient that
is lower than the shrubs land-use class. Increasing the
area of shrubs and reducing the area of forest can
increase runoff. Another factor that causes the
increase in runoff is the increase in the area of
residential areas.
5 CONCLUSION
This study shows that in five years, there has been a
change in land use in the manikin basin. There are
five land-use classes that decried in size, they were
grasslands, water bodies, rice fields, and forests .The
land classes that increased were residential land
classes and shrubs. The average annual runoff of the
first scenario is 134.7404, while the average annual
runoff of the second scenario is 140.0596 mm. There
is an increase in runoff depth from the first scenario
to the second scenario, which is 3.98% (5.19 mm).
The Area of land-use with the highest increase
was shrubs with an increase of 20.25% (19.98 km
2
),
while the land-use area with the highest decrease was
forest with a decrease of 14.1% (13.92 km
2
). The
forest land-use class has a runoff coefficient that is
lower than the shrubs land-use class, So, increase in
the area of shrubs, and the reduction in forest area
have an impact on increasing surface runoff in the
Manikin watershed. Another factor that causes the
Jan Feb Mar Apr May Jun Jul Aug Sep Oct Nov Dec
Skenario 1
18621,5 42077,7 39336,8 8273,59 4455,28 0,001 0,000 0,000 0,000 49,204 2093,03 18069,6
Skenario 2
19317,9 43592,5 40949,6 8583,02 4678,05 0,001 0,000 0,000 0,000 51,123 2171,31 18882,8
0
5000
10000
15000
20000
25000
30000
35000
40000
45000
Run of (mm)
iCAST-ES 2021 - International Conference on Applied Science and Technology on Engineering Science
532

increase in runoff is the increase in the area of
residential areas. In general, this study shows that
land-use change in the manikin basin from the year of
2014 to 2015 has effect on increase in the total runoff
in the Manikin basin.
ACKNOWLEDGEMENTS
The leading author of this paper would like to thank
to State Polytechnic of Kupang as a sponsor of the
author's research through the State Polytechnic of
Kupang DIPA fund.
REFERENCES
Asdak, C. (2004). Hidrologi dan pengelolaan daerah aliran
sungai. Yogyakarta: Gajah Mada University Press.
Astuti I. S. et al. (2019). Impact of land use land cover
(LULC) change on surface runoff in an increasingly
urbanized tropical watershed. Journal of Water
Resources Management, 33, 4087–4103
Krysanova, V. & White, M. (2015) Advances in water
resources assessment with SWAT—an overview.
Hydrological Sciences Journal– Journal des Sciences
Hydrologiques, 60 (5).
Levin, N. (1999). Fundamentals of Remote Sensing.
Trieste, Italy: Hydrographic Data Management course,
IMO - International Maritime Academy.
Nama, A. (2016). Analisis Tingkat bahaya erosi dan arahan
konservasi lahan dengan aplikasi GIS di DAS Manikin.
Jurnal Teknik Pengairan, 7, 205-215
Neitsch, S. L., Arnold, J. G., Kiniry, J. R., Srinivasan, R.,
Williams, J. R. (2011). Soil and water assessment tool:
Theoretical documentation version 2009. Texas, USA:
Texas A & M University System College Station,
Nuri, R. (1985). Geografi Budaya dalam Wilayah
Pembangunan Nusa Tenggara Timur. Jakarta:
Departemen Pendidikan dan Kebudayaan Direktorat
Sejarah dan Nilai Tradisional Proyek Inventarisasi dan
Dokumentasi Kebudayaan Daerah
Patil, N. S. et. al. (2020). Effect of land use land cover
changes on runoff using hydrological model: a case
study in Hiranyakeshi watershed. Modeling Earth
Systems and Environment, 6, 2345–2357
Pertiwi, P. C. et. Al. (2020). The effect of land use change
to surface runoff discharge in the Pompong watershed
at Bangka regency. 2nd International Conference on
Green Energy and Environment (ICoGEE 2020)
Purwadhi, S. H., & Sanjoto, T. B. (2008). Pengantar
interpretasi citra penginderaan jauh. Semarang:
LAPAN & Universitas Negeri Semarang.
Impact of Land-use Change on Surface Runoff in Manikin Basin et Kupang Regency
533
