
Characteristics of Sediment Material at Bengkalis River Bengkalis
Regency, Riau
Dedi Enda, Zulkarnain and Oni Febriani
Department of Civil Engineering, State Polytechnic of Bengkalis, Jl. Bathin Alam, Sungai Alam,
Bengkalis Distric of Riau Province, Indonesia
Keywords: Sediment Characteristics, The Bengkalis River, Sediment Analysis.
Abstract: One of the causes of decreasing river capacity is silting and/or narrowing by sedimentation, this is what
happened in the Bengkalis River, another impact due to siltation is the occurrence of overflowing water from
the river which can threaten the area on the riverbank, so research is carried out on the characteristics of
sediment samples, especially the Bengkalis river with the aim to obtaining information about the
characteristics of river sediments. The method used in this research is field observation by measuring the river
profile and flow velocity, then taking soil samples at the riverbed and carrying out laboratory tests such as
specific gravity, filter analysis, and hydrometer. The results of BJ sediments from three sediment samples at
the estuary, middle and upstream locations of STA 0+000, STA 0+925, and STA 1+922 were 2.46; 2.26; and
2.37. Based on the results of laboratory tests, the results of the specific gravity show that the farther from the
sea, the smaller the density of the sediment. The types of sedimentary material from the results of the sieve
analysis and hydrometer test are silt (silt) and clay, respectively STA 0+000 37.84%, 19.81%, STA 0+925
42.46%, 31.01%, and STA 1 +922 50.07%, 28.82%.
1 INTRODUCTION
A river is a natural and/or artificial water channel or
container in the form of a water drainage network and
the water in it, starting from the upstream to the
estuary, bordered on the right and left by border lines
(PP No. 38, 2011).
The river is a flow of water that flows from
upstream to downstream and this river flow moves
from a high place to the lowest or shallow place.
River water always flows in one direction because the
river is located on the lower part of the earth's surface
than the surrounding land, which comes from
mountain water which then empties into one place,
namely the sea (Andini and Nisye, 2017).
The river consists of a river trough and a river
border. The space for flowing water is located in the
riverbed and as a place for the life of the river
ecosystem to take place, so that in essence rivers and
their tributaries play an important role in
accommodating, storing, and draining water that
comes from rainfall to the sea naturally. The success
of rivers in carrying out their functions minimizes the
risk of flooding, especially in urban areas (PP No. 38,
2011).
The river has its own capacity to be able to ward
off flooding. One of the causes of decreasing river
capacity is due to silting and/or narrowing by
sedimentation.
Sedimentation is a process of entering sediment
loads into a certain aquatic environment through
water media and being deposited in that environment.
Sedimentation that occurs in coastal and river
environments becomes a problem if it occurs in
locations where there are human activities that require
clean water conditions (Triatmodjo, 1999).
There are several causes of sedimentation,
including the deposition of river water, sea water
deposition. This deposition process will result in
sediment consisting of several materials with various
sizes of soil particles depending on the parent
material that composes them. Some materials that
often become sediment, including: sand and clay. The
type of sediment according to the particle size can be
found dissolved in the river or what is called the
suspended load and the sediment that creeps on the
riverbed is called the bed load (Triatmodjo, 1999).
The difference between sediment load and
creeping sediment can be seen by looking at the
movement of the sediment particles. The movement
518
Enda, D., Zulkarnain, . and Febriani, O.
Characteristics of Sediment Material at Bengkalis River Bengkalis Regency, Riau.
DOI: 10.5220/0010948500003260
In Proceedings of the 4th International Conference on Applied Science and Technology on Engineering Science (iCAST-ES 2021), pages 518-525
ISBN: 978-989-758-615-6; ISSN: 2975-8246
Copyright
c
2023 by SCITEPRESS – Science and Technology Publications, Lda. Under CC license (CC BY-NC-ND 4.0)
of these particles is influenced by flow velocity, river
morphology, riverbed roughness and river slope.
These parameters interact with each other so that it
will determine the amount and type of sediment and
the speed of sediment transport, this causes the results
of the sedimentation process in one place to another,
even though it is in one coastal area, as well as for the
Bengkalis island area which is on the coast of the
Malacca strait.
The source of origin of sediment is one of the
factors that cause differences in characteristics.
Waikelo Beach and Melolo are beaches facing the
Sumba Strait and facing the surrounding islands
(Flores Island and Sumbawa Island) so that the
coastal sediments have a major influence on the
sediment supply from the mainland. Meanwhile, the
Laboya beach is directly related to the Indian Ocean
which causes the size of the coastal sediment to be
smoother. The same thing was expressed by Nugroho
and Putra (2017), who conducted research on the
grain size of sediments in the Sumba Strait and to the
south and west of the Indian Ocean, that sediments
that are directly related to the Indian Ocean have a
smoother character than those in the Sumba strait.
The results of the calculation of the sediment
fraction of the waters of the Silandak River (Table 2)
sedimentary classification is dominated by sand
(sand) and clay (clay). Sand is found at points 1,2, and
3 where point 1 is upstream, points 2 and 3 are part of
the middle river, where the three points are areas with
a depth of < 30 cm and a low river current speed of
0.04 seconds. The condition around the river is in the
form of densely populated settlements, around the
river rocks and sand are found, so that the sediment
that is deposited in the form of sand, other fine
materials is carried by currents into lower waters to
the sea. Points 4 and 5 are dominated by clay with an
average clay percentage of 60%, this is because points
4 and 5 are parts close to the coast where fine particles
carried from upstream will enter downstream
(Dominig and Muskananfola, 2019).
Analysis of sedimentation characteristics has been
carried out in the New Straits port area at the mouth
of the Bengkalis Liong River, where the Liong River
estuary is located on the north coast of Bengkalis
Island which is directly connected to the Malacca
Strait. Analysis of sediment characteristics was
carried out at 2 station points in the New Straits port.
From the results of the sedimentation analysis, it was
found that there were three sediment fractions,
namely sand, silt and clay with various diameters.
The percentage of sand at station 1 is 75.87% which
is located in the port dock area, while the percentage
of sand at station 2 is 53.9%, precisely at the end of
the river mouth. The percentage of silt at station 1 is
20.85%, while at station 2 is 43.86%. The percentage
of clay at station 1 is 3.28%, while at station 2 is
3.24% (Khabib et all, 2013).
Research on sediment characteristics was also
carried out on the Selatbaru beach with a location
distance of +1 km (Khabib et all, 2013), where the
results obtained that the sediment characteristics of
the beach bottom surface were grouped into three
sedimentary fractions, namely gravel, sand and mud.
The sand sediment fraction is found at each station
and is the most common sedimentary sediment found
when compared to the gravel and mud fractions. The
type of sediment in the research location can be
grouped into 2 types of sediment, namely sand and
muddy sand. Sediment with sand type is found in
every sub-station, except for sub-station 1B which
has a muddy sand fraction type (Putra et all, 2017).
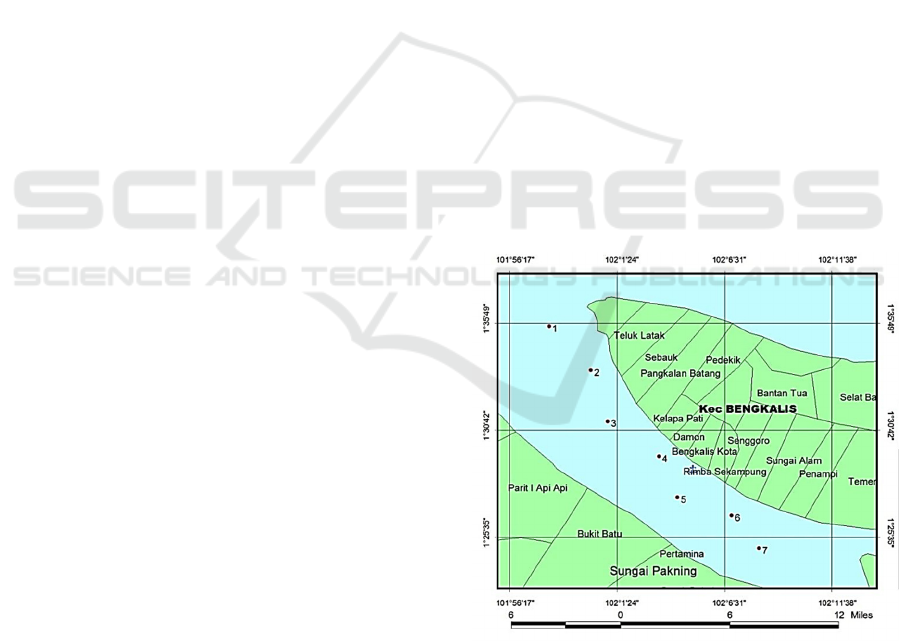
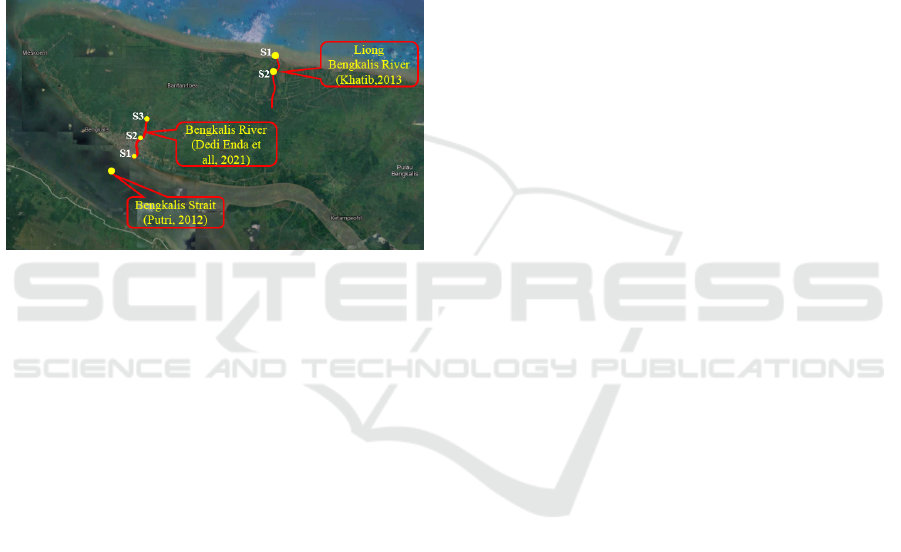
Study of sediment characteristics on the west
coast of Bengkalis Island, the study was carried out
by taking test samples using the Eckman Grab from 7
station points (Figure 1) then analyzed to determine
the composition and content of organic matter in the
sediment, where the results of the analysis of the
sediment fraction in the waters The Bengkalis Strait
shows that these waters consist of three types of
fractions, namely gravel, sand, and mud. However,
the dominant fraction in each station is the sand
fraction (Putri and Rifardi, 2012).
Figure 1: Sample station of Putri and Rifardi research,
2012.
The percentage of gravel fraction ranges from 0-
17.84% where the lowest percentage is at Stations 2,
3, and 5 while the highest percentage is at Station 4
with a percentage of 17.84%. The percentage of sand
fraction ranges from 80-96.72% where the highest
Characteristics of Sediment Material at Bengkalis River Bengkalis Regency, Riau
519
percentage is at Station 2 and the lowest is at Station
4. While the percentage of mud fraction is around
2,1618.42% where Station 4 is the lowest percentage
and Station 3 is the highest percentage. The type of
sediment fraction in these waters is dominated by
sand at each station (Putri and Rifardi, 2012).
Bengkalis River is one of the rivers in the
Bengkalis District with a total length of 3.81 km from
upstream to downstream. The location of the
Bengkalis river is in the coastal area so that the
condition of the river water level is strongly
influenced by the conditions of the tides and the ebb
and flow of sea water. Visual observation of several
sea segments of the Malacca Strait sedimentation
occurs (Figure 1).
The occurrence of sedimentation is strongly
supported by the condition of the river which has a
water flow at high tide that is greater than the flow at
low tide, so that the material carried by water
upstream during high tide will experience
sedimentation.
Over time, sedimentation that occurs in the
Bengkalis river results in greater siltation and causes
a reduction in the capacity of the river so that it has
the impact of overflowing water that threatens the
area on the outskirts of the river from the danger of
flooding, so it is necessary to do research on the
characteristics of sediment samples, especially the
Bengkalis river. Based on the description above,
research was conducted with the aim of obtaining
information about the characteristics of sediments in
the Bengkalis river, the results of this study can be
used as an initial reference in handling river
sediments, especially the Bengkalis river.
Besides that, the results of this test must include
SNI 3423:2008:
a. Percentage of grain greater than 2.00 mm;
b. The percentage of coarse sand 2.0 mm to 0.42
mm;
c. Percentage of fine sand, 0.42 mm to 0.074 mm;
d. Percentage of silt 0.074 mm to 0.002 mm;
e. The percentage of clay is less than 0.002 mm
and;
Colloidal percentage is smaller than 0.001 mm.
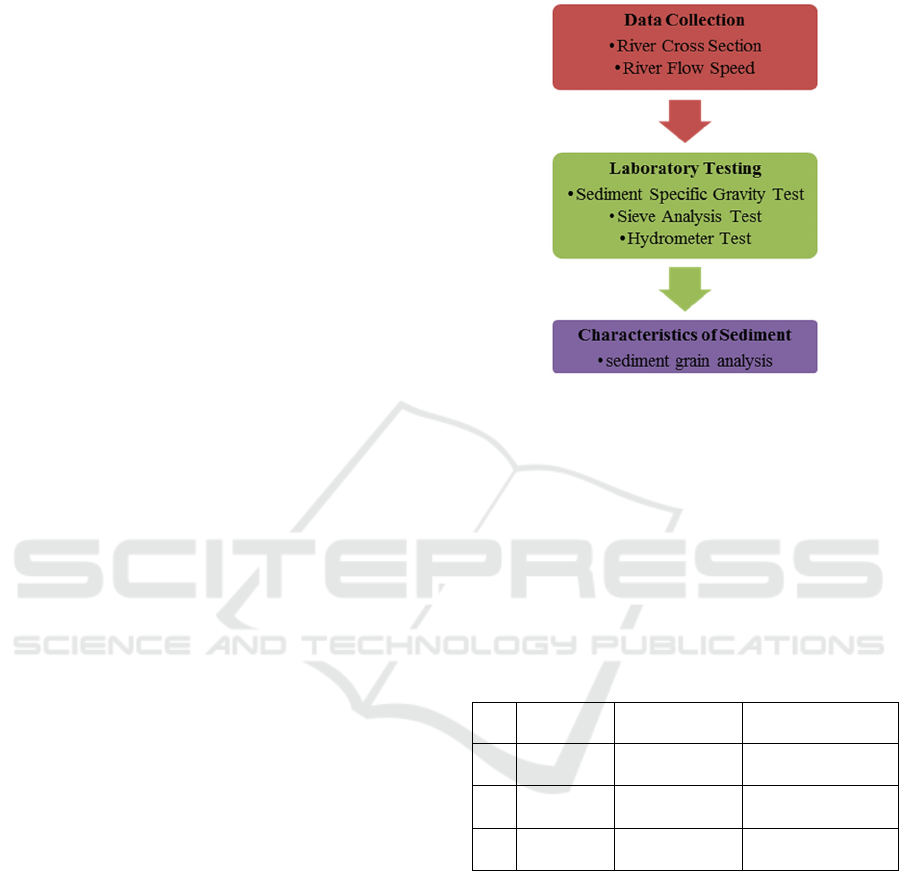
2 METHOD
The method implemented in this study is a field
observation method in the form of a field survey to
obtain input data needed in analyzing sediment
characteristics and by conducting tests at the Soil
Testing Laboratory of the Civil Engineering
Department of the Bengkalis State Polytechnic. The
stages of research implementation are as follows:
Figure 2: Research Flowchart.
To determine the characteristics of the Bengkalis
river sediment, a test sample is needed, the sediment
test sample used is the test material (sediment) which
represents the sediment that occurs in the Bengkalis
river, namely the test sample from STA 0+000, STA
0 +925 and 1 + 922. Location of position each point
of sediment sampling can be seen in Table 1 and
Figure 3, Figure 4, Figure 5 and Figure6. For each
STA 3 representative sediment samples were taken.
Table 1: Coordinate Sampling Points.
No STA River Basin Coordinate
1 0 + 000
Downstream/
Estuar
y
102
0
7’10,299” E
1
0
27’37,772” N
2 0 + 925 Middle
102
0
7’18,327” E
1
0
28’2,051” N
3 1 + 922 Upstrem
102
0
7’17,888” E
1
0
28’30,434” N
The stages of this research include the following
activities:
2.1 Data Collection Stage
Data collection includes measurement of river cross-
section, river flow velocity and sediment sampling.
Measuring the cross section of the river to determine
the dimensions of the river using the Theodolite
measuring instrument and drawing using AutoCad
software. Measurement of the speed of river currents
in a cross-sectional area of the river by using a
measuring instrument Currentmeter.
iCAST-ES 2021 - International Conference on Applied Science and Technology on Engineering Science
520
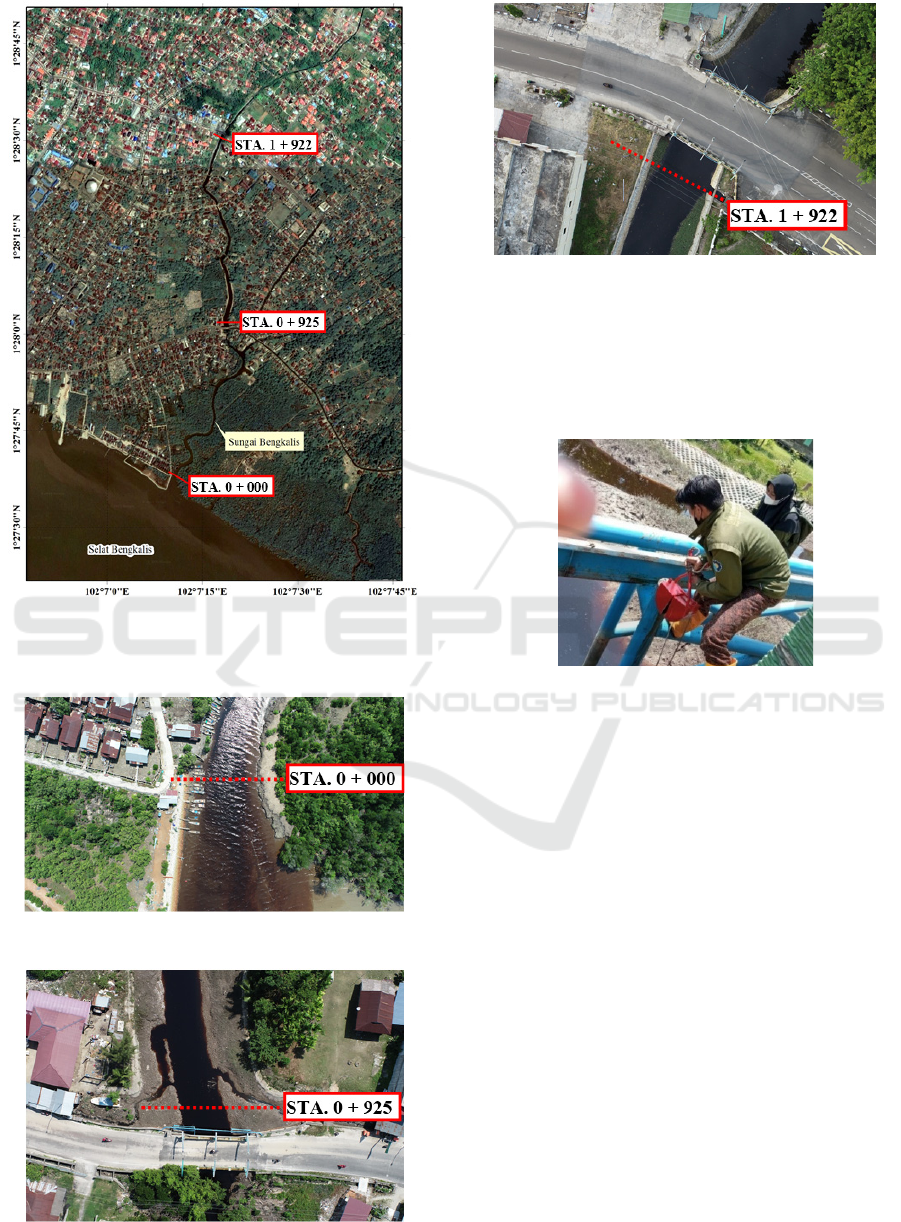
Figure 3: Research locations and sampling points in the
estuary, middle and upstream of the river in Bengkalis
Island.
Figure 4: Research locations STA 0+000.
Figure 5: Research locations STA 0+925.
Figure 6: Research locations STA 1+922.
Sediment Sampling was taken at several points,
namely at STA. 0 + 000, STA. 0 + 925 and STA. 1 +
922 by using a sediment sampler which will then be
tested for its characteristics at the Soil Testing
Laboratory.
Figure 7: Sampling of riverbed sediment.
2.2 Laboratory Testing Stage
This stage includes the activities of several sediment
sample testing to determine the characteristics of the
sediment. There are several tests carried out:
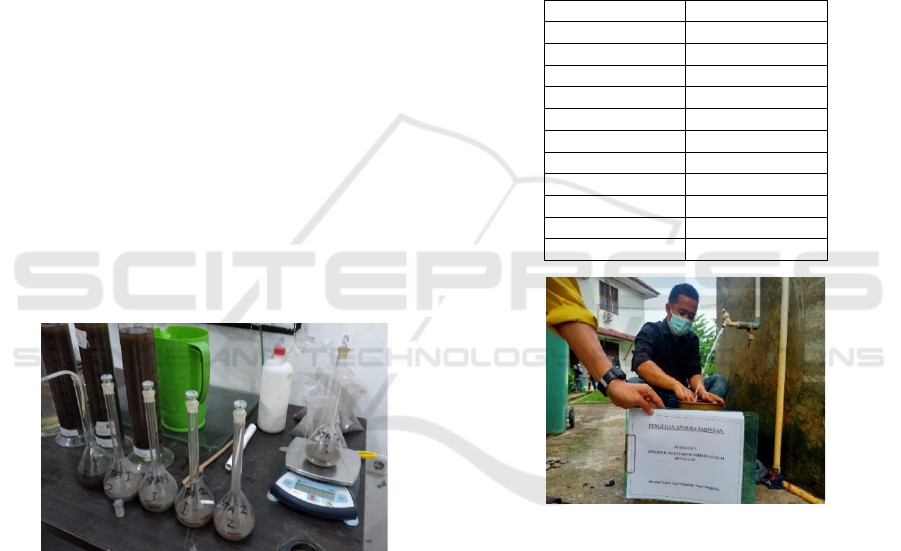
2.2.1 Sediment Specific Gravity Test (GS)
Specific gravity is the ratio between the density of soil
grains and the density of distilled water at the same
temperature and volume. The test uses a pycnometer
and a test object that passes the No. sieve. 40 (SNI
1964, 2008).
The sequence of processes in the specific gravity
test is as follows:
1. Preparation of tools including pycnometer (in
clean condition) and test sample
2. Weigh the pycnometer (W1)
3. Fill the pycnometer with water up to the
specified limit and then weigh the pycnometer +
water (W4)
Characteristics of Sediment Material at Bengkalis River Bengkalis Regency, Riau
521
4. Enter the test sample into the pycnometer to a
predetermined limit, then weigh the pycnometer
+ soil weight (W2)
5. Fill the pycnometer with water and gently shake
the pycnometer so that there are no more water
pores. Heat the water until it boils and put the
pycnometer in the pot, then the air bubbles will
evaporate until the air bubbles disappear. Lift
the pycnometer if the air bubbles are no longer
there, add water to the pycnometer to the
specified limit and let the pycnometer stand for
24 hours.
6. Weigh the pycnometer + water + the sample that
has been set aside (W3)
7. Analysis of sediment density calculation
Calculating the density of sediment using the
formulation
Gs = (W
2
-W
1
)/(W
4
-W
1
)-(W
3
-W
2
) (1)
Where:
Gs = Density of soil
W1 = Weight of pycnometer (grams)
W2 = Weight of pycnometer and dry sample
(grams)
W3 = Weight of pycnometer, sample and
water (grams)
W4 = Weight of pycnometer and water
(grams)
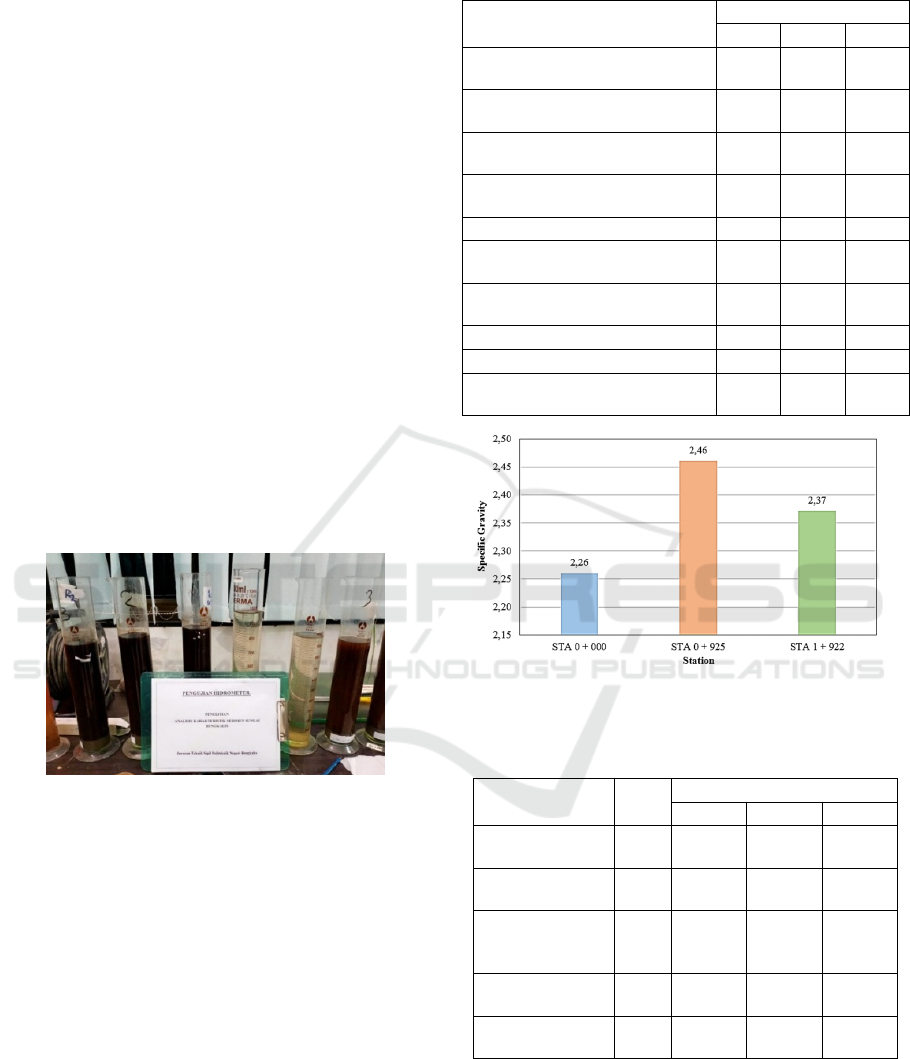
Figure 8: Specific Gravity Test of Sediment Samples.
2.2.2 Sieve Analysis Test
This test was carried out to obtain the grain size
distribution of the soil using sieve analysis. The test
object used was an oven-dried sediment sample. The
process in testing sieve analysis is as follows:
1. The test object is dried in an oven at a
temperature of (110 + 5 C).
2. Weigh the sieve used in an empty state.
3. Take a sample weighing 2000 grams.
4. Put the sample into the plastic and soak for + 1
hour.
5. After 1 hour, wash the sample above 1 set of
filters until the color of the water entering the
filter is the same as the water coming out of the
filter.
6. Put the sample retained on each sieve into
different containers and code according to the
sieve number.
7. Oven sample in container for 24 hours
8. Weigh and record the weight of the oven dry
sample.
The filter analysis test with the following sieve
size (SNI 3423, 2008):
Table 2: Sieve Size.
# Sieve ø
(
mm
)
2,5" 63,5
1,5" 38,1
1" 25,4
3/4" 19,05
3/8" 9,525
No. 4 4,75
No. 10 2,000
No. 20 0,850
No. 40 0,425
No. 100 0,150
No. 200 0,075
Figure 9: Wet method sieve analysis (washing).
2.2.3 Hydrometer Test
The hydrometer test is a test carried out to calculate
the grain size distribution of a fine-grained soil or the
fine-grained portion of a coarse-grained soil based on
the sedimentation of the soil in water, sometimes also
called the sedimentation test.
In the hydrometer test, the tested soil sample is
dissolved in water in a dispersed state, the soil grains
will drop freely to the bottom of the vessel. The
settling speed of the soil grains varies depending on
the size of the soil grains. The largest soil particles
will settle first with a greater settling velocity. The
process in testing the hydrometer analysis is as
follows SNI 3423, 2008 :
iCAST-ES 2021 - International Conference on Applied Science and Technology on Engineering Science
522
1. Prepare tools and test samples that pass the No.
sieve. 200 which has been oven-dried weighing
50gr.
2. Weigh the kalgon to be used weighing 15 grams.
3. So that the soil settles Pour a little water on the
sample and leave it for 10 minutes.
4. Fill 30 ml of water into the first measuring cup,
put kalgon into the water and stir until dissolved.
After dissolving add water until the volume of
water becomes 1000 ml.
5. Fill 1000 ml of water in the second measuring
cup.
6. Fill 1000 ml of water in the third measuring cup
7. Close the second measuring cup and shake for
60 times
8. Place the first, second and third measuring cups
in a parallel position, turn on the stopwatch for
2 minutes, take the hydrometer and temperature
readings on the 2nd measuring cup.
9. Lift the hydrometer and thermometer and clean
it, calculate the hydrometer and temperature in
the first measuring cup
10. Do the same steps at a time of 5 minutes, 15
minutes, 30 minutes, 60 minutes, 240 minutes
and 1440 minutes.
Figure 10: Hydrometer Test.
3 RESULTS AND DISCUSSION
In this study, researchers conducted an examination
of the specific gravity of the sediment obtained by the
test results as shown in Table 3 and Figure 11.
From table 4, it is known that the speed and
discharge of water at low tide decreases from
downstream to upstream. Likewise, the speed and
discharge of water at high tide decreases from
downstream to upstream. However, the speed of the
water at low tide is higher than the speed of the water
at high tide. however, the water discharge at low tide
that occurs at STA 0+925 and STA 1+922 is greater
than at high tide.
Table 3: Specific Gravity of Bengkalis River Sediment.
Description
STA
0 + 000 0 + 925 1 + 922
Empty pycnometer weight (M
1
)
(gr)
88.10 96.90 172.53
Weight of pycnometer + dry soil
(
M
2
)
(g
r
)
151.10 157.13 299.50
Weight of pycnometer + soil +
water (M
3
) (gr)
371.37 380.63 741.90
Weight of pycnometer + water
(M
4
) (gr)
336.23 344.87 668.50
Temperature t °c (degrees) 29.17 29.00 29.17
Dry soil weight (A = M
2
–
M
1
)
(gr)
63.00 60.23 126.97
Weight of soil in water (B = M
3
-
M
4
) (gr)
35.13 35.77 73.40
C = A- B 27.87 24.47 53.57
Specific gravity Gs = A / C 2.26 2.46 2.37
G for 27.5 °c = Gs * (Bj. Water t
°c/B
j
. Wate
r
27.5 °c
)
1923.41 2069.67 2017.30
Figure 11: Specific Gravity of Sediment at 3 observation
stations.
Table 4: Specific gravity, velocity and river discharge.
Description Unit
STA
0 + 000 0 + 925 1 + 922
Specific Gravity
Gs
2.26 2.46 2.37
Average speed of
low tide
m/s 0,133 0,039 0,036
Average
Discharge of Low
tide
m
3
/s 3,137 1,254 0,194
The average
speed of the tide
m/s 0,088 0,037 0,030
Average High
Water Dischar
g
e
m
3
/s 4,27 1,143 0,162
According Table 3 and Figure 11, it can be seen
that there are differences in the density of sediment in
each STA, where the density of sediment at STA
0+925 is greater than the density of sediment at STA
0+000 and STA 1+922. This difference is influenced
by the position of the STA. Sampling at STA 0+000
Characteristics of Sediment Material at Bengkalis River Bengkalis Regency, Riau
523
is in the estuary area, STA 0 + 925 is in the middle of
the length of the river and is in the area after the
bridge, while STA 1+922 is in the upper part of the
river. The deposition at the end of the river mouth
(STA 0+000) is smaller due to ship wave activity and
the influence of tidal currents is greater than in the
areas of STA 0 + 925 and STA 1+922.
Different results were also obtained a study for
one of the rivers on the island of Bengkalis (Liong
River) (Khatib et all, 2013), the density of sediment
at station one (2,551) and station two (2,569), where
the density of sediment at station two was greater than
that at station two. with the sediment density of
station one. This difference is influenced by the
position of the station. Sampling at station one is in
the port dock area, while station two is at the end of
the river mouth. The deposition at the end of the river
mouth is caused by ship waves and the influence of
tidal currents is greater than in the area near the harbor
pier. That even though the rivers are in the same
island, the specific gravity of the sediment deposits
has different characteristics.
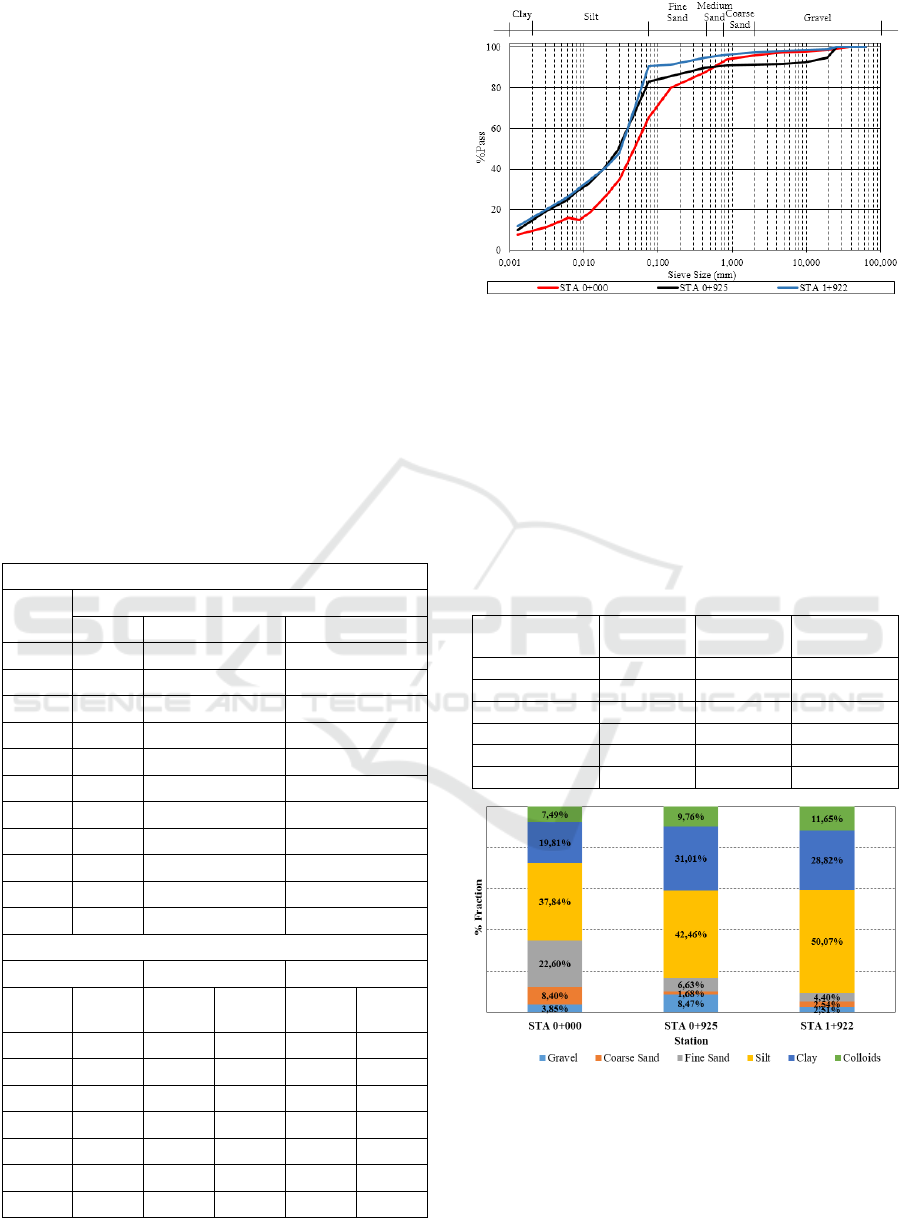
Table 5: Analysis of sediment grains.
Sieve Analysis
ø (mm)
% Pass
0 + 000 0 + 925 1 + 922
63,5 100,00 100,00 100,00
38,1 100,00 100,00 100,00
25,4 99,37 100,00 100,00
19,05 98,45 95,01 99,15
9,525 97,98 92,68 98,48
4,75 97,41 91,90 98,10
2,000 96,15 91,53 97,49
0,850 94,24 90,95 96,20
0,425 87,74 89,86 94,95
0,150 79,92 85,84 91,55
0,075 65,14 83,23 90,55
Hydrometer Analysis
0 + 000 0 + 925 1 + 922
Diameter
(mm)
% Pass
Diameter
(mm)
% Pass
Diameter
(mm)
% Pass
0,0307 35,33 0,0289 49,38 0,0300 47,83
0,0203 27,30 0,0190 40,77 0,0195 40,47
0,0121 18,74 0,0114 32,73 0,0116 34,34
0,0087 14,99 0,0082 29,29 0,0083 30,05
0,0062 16,06 0,0059 24,69 0,0060 26,37
0,0031 11,51 0,0030 18,95 0,0030 19,62
0,0013 7,49 0,0013 9,76 0,0013 11,65
Figure 12: Grain size distribution of Bengkalis river
sediment.
For testing the grain size distribution analyzed by
hydrometer analysis and sieve analysis and presented
in the form of a cumulative weight percentage curve.
The test results can be seen in table 5 and Figure 12
below.
The form should be completed and signed by one
author on behalf of all the other authors. The grain
size of sediment can be grouped as follows:
Table 6: Grouping of Bengkalis river sediment grain size.
Sediment Grain
Size
STA 0+000 STA 0+925 STA 1+922
Gravel 3,853 8,467 2,510
Coarse San
d
8,403 1,677 2,540
Fine San
d
22,60 6,63 4,40
Silt 37,84 42,46 50,07
Cla
y
19,81 31,01 28,82
Colloids 7,49 9,76 11,65
Figure 13: Bengkalis river sediment grain size grouping.
From table 6 and figure 13 it is known that the
dominant types of sedimentary material in the
Bengkalis river are silt (silt) and clay, respectively
STA 0+000 37.84% and 19.81%, STA 0+925 42.46%
and 31 0.01% and STA 1+922 50.07% and 28.82%.
iCAST-ES 2021 - International Conference on Applied Science and Technology on Engineering Science
524
The percentage of silt has increased from downstream
to upstream. In contrast to the sediment content of the
Liong Bengkalis river (Khatib et all, 2013), which is
dominated by 75.87% sand (station 1) and 53.9%
(station 2) while silt is 20.85% (station 1) and 43.86%
(station 2 ). The results of this study are also very
different from the results of research on sediment
deposits in the Bengkalis strait (Putri and Rifardi,
2012), the percentage of sand fraction and gravel
fraction dominates the type of sedimentary material
ranging from 80-96.72% and 0-17.84%, so it can be
concluded it is stated that the type of sedimentary
material between the river and the sea where the river
empties has different materials.
Figure 14: Location Research of Sediment.
4 CONCLUSIONS
Based on the results of data analysis that has been
carried out, conclusions can be drawn including
Density of sediment from the dominant sedimentary
material, respectively STA 0+000 2,26, STA 0+925
2,46 and STA 1+922 2,37.
The type of sedimentary material that dominates
the Bengkalis river sediment deposits are silt (silt)
and clay, respectively STA 0+000 37.84% and
19.81%, STA 0+925 42.46% and 31.01% and STA
1+922 50.07% and 28.82%.
The type of sedimentary material that dominates
the sediment in the Bengkalis river is different from
the type of sedimentary material in the Bengkalis
strait where the Bengkalis river estuary.
ACKNOWLEDGEMENTS
The research team would like to thank the Bengkalis
State Polytechnic Research and Community Service
Center for funding the initial stages of this research,
and hope to be willing to contribute to the next
follow-up research. To the team members who
always contribute to this research activity so that it
can be completed within the allotted time.
REFERENCES
Andini, Nisye. F. (2017). Pengukuran Debit dan
Sedimentasi DAS Batang Lembang Bagian Tengah
Kenegarian Selayo Kabupaten Solok, Jurnal
Kepemimpinan dan Pengurusan Sekolah. Vol.2 No. 2
Juni 2017: 133-140.
Dominig, A., Muskananfola, M, R. (2019). Sedimentation
Rate of Silandak River West Semarang, Journal of
Maquares. Vol.8 No. 3 2019: 126-132.
Khatib, A., Adriati, Y., Wahyudi, A.E. (2013). Analisis
Sedimentasi dan Alternatif Penanganannya di
Pelabuhan Selatbaru Bengkalis, Konferensi Nasional
Teknik Sipil 7 (KoNTekS 7). UNS-Surakarta, 24-25
Oktober 2013
Nugroho, S, H., Putra, P, S. (2019). Characteristics of
Grain Size Distribution on Beaches Sediment of Sumba
Island, Nusa Tenggara Timur Based on Grainsize and
Geochenical Data, Jurnal Geologi dan Sumberdaya
Mineral. Vol.20 No. 3 Agustus 2019: 153-164.
Peraturan Pemerintah Republik Indonesia Nomor 38 Tahun
2011. Sungai.
Putra, R., Elizal., Thamrin. (2017). Sediment
Characteristics and Distribution of Crab Scopimera
Globosa on The Selat Baru Beach Bengkalis District.
Jurnal Online Mahasiswa, Fakultas Perikanan dan Ilmu
Kelautan Unri, Vol 4, No. 2
Putri, D. Y., Rifardi. (2012). Komposisi Butiran Pasir
Sedimen Permukaan Selat Bengkalis Propinsi Riau.
Repository University of Riau.
SNI 3423:2008. Cara Uji Analisis Ukuran Butir Tanah.
Badan Standardisasi Nasional
SNI 1964:2008. Cara Uji Berat Jenis Tanah. Badan
Standardisasi Nasional.
Triatmodjo, B. (1999). Teknik Pantai, Beta Offset, 5th
edition.
Characteristics of Sediment Material at Bengkalis River Bengkalis Regency, Riau
525
