
Google Earth Engine for Assessing Land Use and Land Cover
Change in Banyuwangi Regency
Abdul Holik
1a
, Zulis Erwanto
2b
and Siska Aprilia Hardiyanti
2c
1
Department of Agribusiness, Politeknik Negeri Banyuwangi, Jl. Raya Jember Km 13 Kabat, Banyuwangi, Indonesia
2
Department of Civil Engineering, Politeknik Negeri Banyuwangi, Jl. Raya Jember Km 13 Kabat, Banyuwangi, Indonesia
Keywords: GEE, Land Use Land Cover, Remote Sensing, Supervised Classification, Banyuwangi.
Abstract: Land use and land cover (LULC) change needs regularly monitor because it causes a multiplayer effect. This
study examines the LULC in Banyuwangi regency between 2013 using Landsat-8 and 2021 using Sentinel-2
satellite images data. All processing data used Google Earth Engine (GEE) with supervised classification,
classified eight LULC characteristics. The results show that GEE can quickly process image data from the
acquisition process, cloud removal, classification to accuracy tests. LULC significant changes in paddy fields
(-3.76%) and forests (+3.08%), moderate changes in plantations (+0.44 %), water bodies (-0.39%), built-up
(+0.34%), and bare soil (+0.27%), while minor changes occur in field (-0.01%) and shrubs (+0.26%). Even
though forest land is increasing, the loss of paddy fields must be a serious concern to maintain the stability of
rice stocks.
1 INTRODUCTION
Remote sensing is a popular tool for mapping and
monitoring land use/land cover change. It is currently
the most reliable tool for monitoring various
spectrally sensitive changes of the earth (Alam, Bhat,
& Maheen, 2020). Several satellite images like
Landsat and Sentinel with band-combination are
widely used to detect the changes on a large scale.
Google earth engine (GEE) is a cloud-based
platform for geospatial data analysis, especially raster
data. GEE provides powerful computing capabilities
and provides many remote sensing data and various
auxiliary datasets (Qu, Chen, Li, Zhi, & Wang, 2021).
GEE can be accessed via an application programming
interface (API) over the web-based Internet. Users
can prototype, visualize results quickly (Gorelick et
al., 2017), and also analyze big geospatial data in a
sophisticated way without requiring access to
supercomputers or special coding skills (Tamiminia
et al., 2020). In addition, (Zurqani, Post, Mikhailova,
Schlautman, & Sharp, 2018) demonstrates the
advantages of using GEE and the public archive
a
https://orcid.org/0000-0001-9987-1161
b
https://orcid.org/0000-0001-7938-9116
c
https://orcid.org/0000-0001-6003-6791
database on its platform to track and monitor changes
in LULC over time.
The impacts caused by land cover changes are a
reduction of agricultural land (Wijaya & Susetyo,
2017), implications for groundwater quality (He, Li,
Wu, & Elumalai, 2019), sooner and later, theland is
converted into wasteland (Ramanamurthy &
Victorbabu, 2021). Monitoring of LULC to map
needs regular updates. It requires high spatial
resolution time-series data to understand better LULC
dynamics and their impact on biomass (Jr et al.,
2020).
Banyuwangi Regency is the largest regency and
the most significant contributor to staple foods in East
Java. In the last ten years, Banyuwangi has
experienced rapid development (international airport,
mining, railway factory, sugar industry factory,
building of five-star hotels and villas), so that land use
and land cover (LULC) change is inevitable. Rural
areas are experiencing profound social-economic
transitions driven by industrialization and
urbanization (Zhu et al., 2021) as well as
Banyuwangi. Practically, land cover change is
expected in the developing regions and part of the
416
Holik, A., Erwanto, Z. and Hardiyanti, S.
Google Earth Engine for Assessing Land Use and Land Cover Change in Banyuwangi Regency.
DOI: 10.5220/0010946800003260
In Proceedings of the 4th International Conference on Applied Science and Technology on Engineering Science (iCAST-ES 2021), pages 416-422
ISBN: 978-989-758-615-6; ISSN: 2975-8246
Copyright
c
2023 by SCITEPRESS – Science and Technology Publications, Lda. Under CC license (CC BY-NC-ND 4.0)
regional development indicators. Nevertheless, this
certainly impacts the carrying capacity of the
environment, especially in the agricultural sector. The
monitoring results are expected to be useful for
policymakers in Banyuwangi, especially to maintain
food stocks in a stable condition.
2 STUDY AREA
The study area covers about 3,600 square kilometres
with a coastline of about 175.8 km, including all
urban agglomeration which is located between the
latitude of 7°43' − 8°46' and longitude of 113°53' −
114°38'. The east, Banyuwangi is bordered by the
Bali strait and the west by Ijen mountain, which is
3,200 m high. While the south is bordered directly by
the Indian Ocean. The total population of
Banyuwangi regency increased from 1,559,088 in
2010 to 1,754,719 inhabitants in 2020 (BPS Badan
Pusat Statistik, 2020).
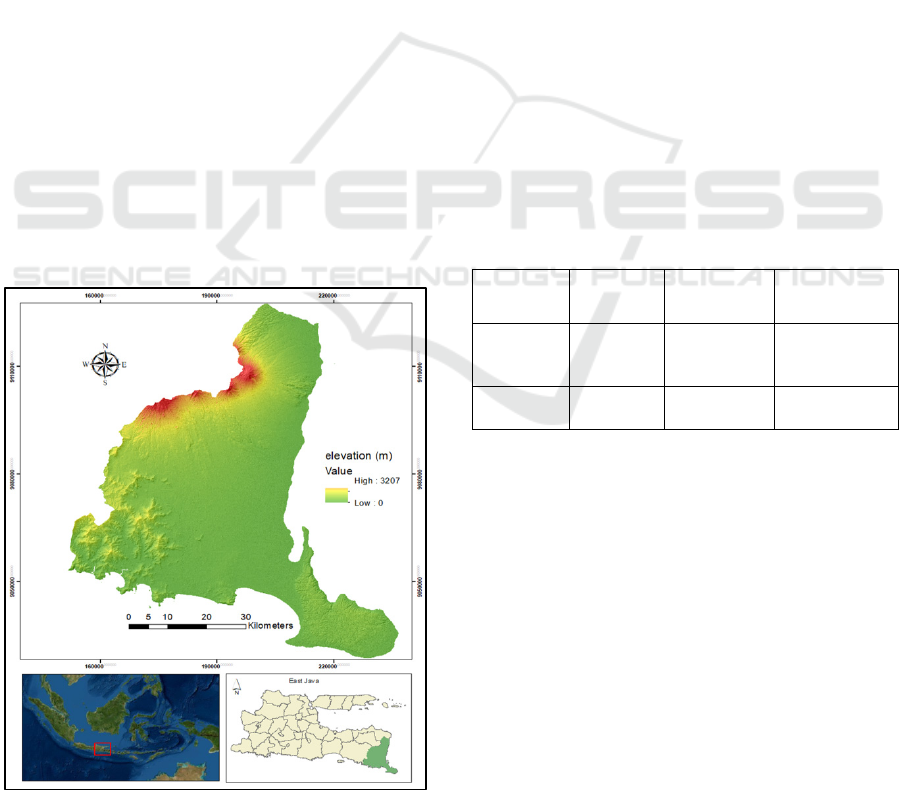
Topographically, the study area can be divided
into three distinct regions: the mountainous area
located to the west and northwest (Figure 1), north
and south dominated by dense forests, and
settlements are primarily in flat areas that tend to be
close to coastal areas and lowland areas. The average
slope level in the western and northern regions is 40°,
with a higher average rainfall when compared to other
parts of the region.
Figure 1: The topographic of Banyuwangi.
Lowlands stretch from south to north. Wherein
many rivers always flow in throughout the year. In
Banyuwangi, there are 35 watersheds, so that besides
being able to irrigate an extensive view of the rice
fields as well positive effect on the level of soil
fertility. The mountainous region is a plantation
product-producing area. Lowland produces primary
agricultural products, and areas around the beach line
produce various marine biota.
3 METHODS OF DATA
ACQUISITION AND ANALYSIS
Landsat images and Sentinel images were collected
from the official webpage of the Google Earth Engine
(GEE). LULC change monitoring requires data for
two different periods. Remote sensing approaches
typically use two or more date satellite imagery to
measure land use and land cover changes in any area
(Alam et al., 2020). In this study, collecting data was
in 2013 for Landsat-8 and 2021 for sentinel-2 images.
The spatial resolution of the image is 30*30 m to
10*10 m pixel size. The images were georeferenced
and projected as the Universal Transverse Mercator
(UTM) within Zone 50 S. Details of the satellite data
used in this study are presented in Table 1.
Table 1: Characteristic of the datasets.
Data
Spatial
resolution
Time
acquisition
GEE Image
Collection ID
Landsat-8 30 m 2013
LANDSAT/LC
08/C01/T1_TO
A
Sentinel-2 10 m 2021
COPERNICUS
/S2
_
SR
In this analysis, LULC classification was
implemented based on eight classes, and a brief
description of major LULC classes is provided in
Table 2. This classification is based on the Indonesian
National Standard (SNI) 7645:2010. This standard
refers to land cover classification united nation – food
and agriculture organization LCCS-UNFAO and ISO
19144-1 geographic information system- part 1:
classification system structure and developed with
phenomena that exist in Indonesia.
Google Earth Engine for Assessing Land Use and Land Cover Change in Banyuwangi Regency
417
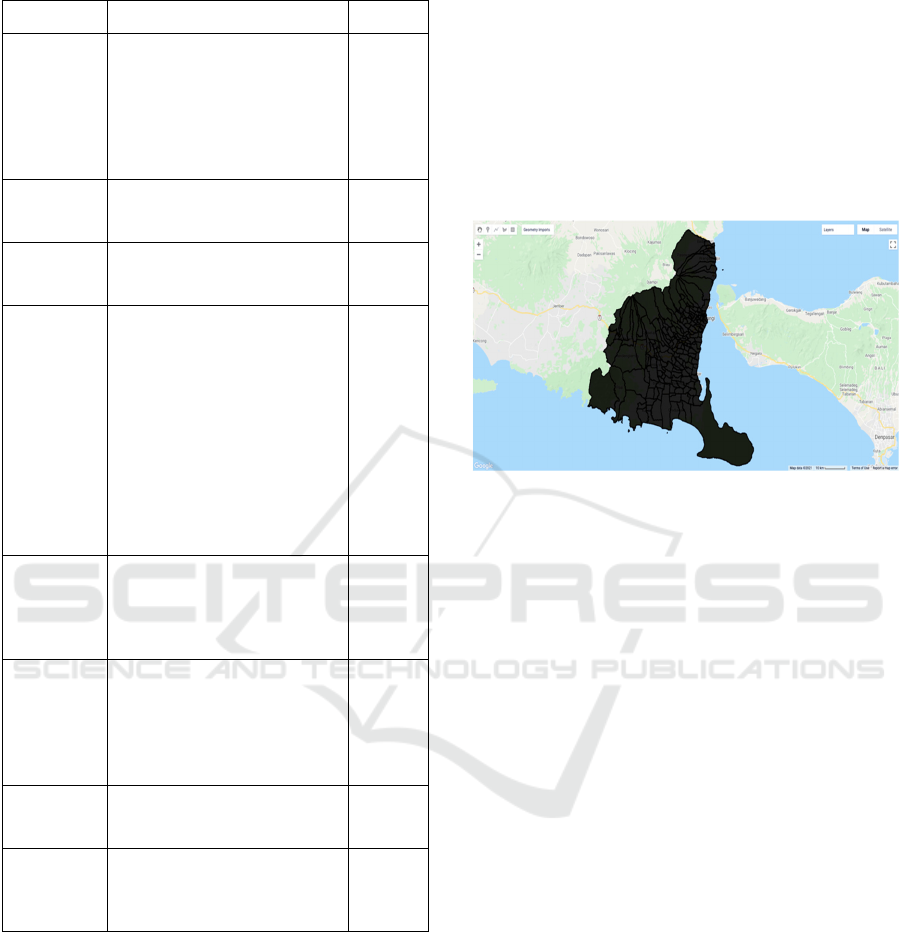
Table 2: LULC classification scheme.
LULC type Description value
paddy field the agricultural area that is
inundated with water either
with irrigation technology,
rainfed, low tide, or tidal,
which is characterized by a
bund pattern, by planting short-
lived food cro
p
s
(p
add
y)
1
field an area used for agricultural
activities with seasonal crops
on dr
y
lan
d
2
plantation land used for agricultural
activities without changing
crops for two years
3
shrubs the dry land area has been
overgrown with various
heterogeneous and
homogeneous natural
vegetation; the density level is
rare to dense. The area is
dominated by low vegetation
(natural). Bushes in Indonesia
are usually former forest areas
and usually do not show any
traces or build-up spots
anymore
4
forests forests that grow and develop
in dryland habitats which can
be lowland forests, hills,
mountains, or highland tropical
forests
5
built-up area areas where the natural or
semi-natural land cover has
been substituted with an
artificial land cover, which is
usually impermeable and
relatively permanent
6
water bodies all aquatic features, including
seas, reservoirs, coral reefs,
and seagrass beds
7
bare soil land without cover, whether
natural, semi-natural, or
artificial. according to
characteristics
8
4 RESULT AND DISCUSSION
4.1 Region of Interest
The first thing that must be done in the classification
process is to make a boundary of the study area. This
is intended so that the classification process can be
carried out correctly without and not going out of the
predetermined limits. ROI can be created by
uploading a shapefile file and saving it to a GEE’s
database. Then during the classification process, this
ROI can be recalled and used as a geometry variable.
The script used to call the uploaded data is as
follows:
var shp =
ee.FeatureCollection('users/abdu
lholik/adm_bwi')
Map.addLayer(shp)
shp is the variable name, while the script in brackets
is a link to the storage location. ROI can be shown by
the following Figure 2.
Figure 2: Region of Interest (ROI).
4.2 Image Acquisition
The image acquisition process can be quickly done by
looking at the Earth Engine Data Catalog script
(https://developers.google.com). It depends on the
type of satellite used. Different satellite, then the code
name will also be different. The acquired image data
can be directly adjusted to the time and condition of
the cloud cover, where cloud cover can be cleared all
at once.
The script used for Landsat-8 in this process is as
follows:
var maskL8 = function(image) {
var qa = image.select('BQA');
var mask = qa.bitwiseAnd(1 <<
4).eq(0);
return image.updateMask(mask);}
var composite =
ee.ImageCollection('LAND
SAT/LC08/C01/T1_TOA')
.filterDate('2013-04-
01','2013-12-31')
.map(maskL8)
.median()
.clip(shp);
While script for sentinel-2 is as follows:
function maskS2clouds(image) {
var qa = image.select('QA60');
var cloudBitMask = 1 << 10;
var cirrusBitMask = 1 << 11;
iCAST-ES 2021 - International Conference on Applied Science and Technology on Engineering Science
418
var mask =
qa.bitwiseAnd(cloudBitMask
).eq(0).and(qa.bitwiseAnd(
cirrusBitMask).eq(0));retu
rn
image.updateMask(mask).divide(10000
);}
var composite =
ee.ImageCollection('COPERN
ICUS/S2_SR')
.filterDate('2021-01-01', '2021-
06-30')
.filter(ee.Filter.lt('CLOUDY_PIX
EL_PERCENTAGE',20))
.map(maskS2clouds)
.median()
.clip(shp);
To visualize the image data, the script is written as
follows:
var RGBTrue =
composite.select(['B4', 'B3',
'B2']);
var RGBparam = {min: 0, max: 0.3,};
Map.addLayer(RGBTrue, RGBparam,
'TRUE');
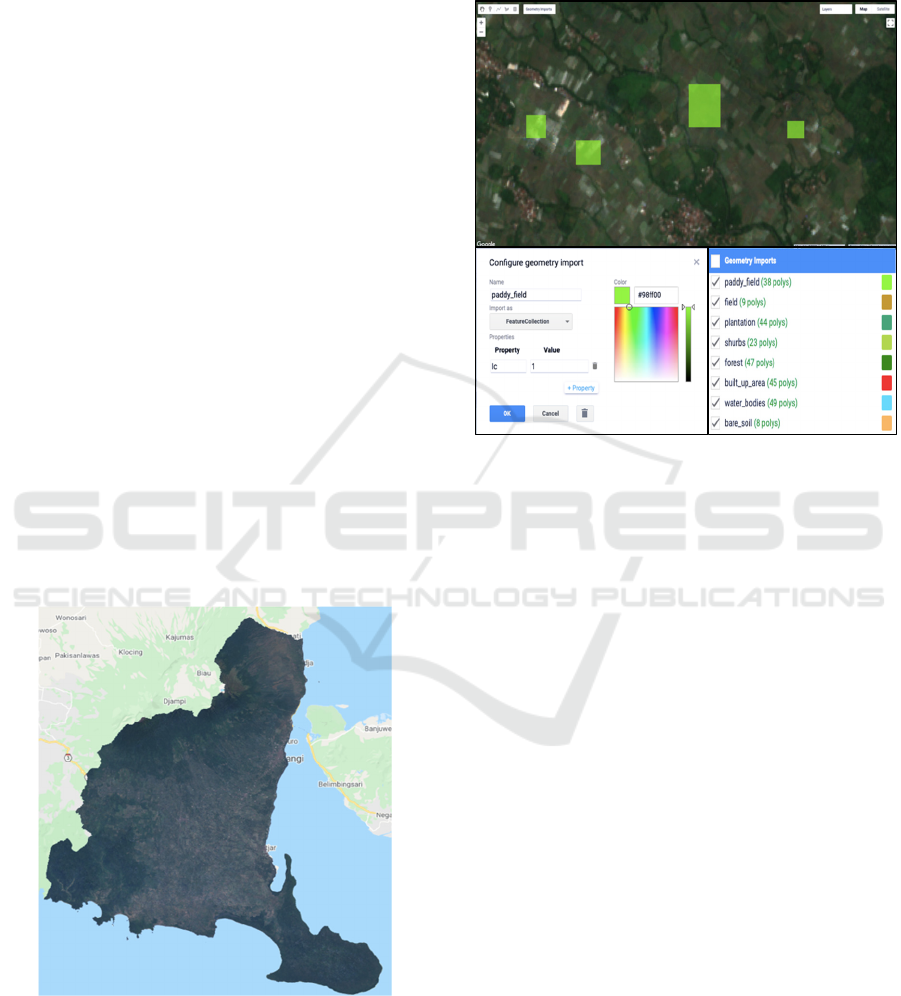
The results are shown in Figure 3. The true colours
displayed are the composite colours of band 4, band
3, and band 2 for landsat-8 and band 5, band 4, and
band 3 for Sentinel-2.
Figure 3: True Color composite band.
4.3 Training Area
LULC classes are earned by creating a training area.
The training area is an area created to represent the
value of each class. It is created by adding a geometry
variable and filling it with a name and value
(according to Table 2) for each training area as Figure
4.
Figure 4: Properties of the training area.
4.4 LULC Classes
After the training area has been created, the next step
is to run the classification process through guided
classification. In this study, the algorithm used in the
classification process uses a random forest. The
Random Forest (RF) classification method is used
most often and shows minimum and maximum
overall accuracy compared to other classifiers
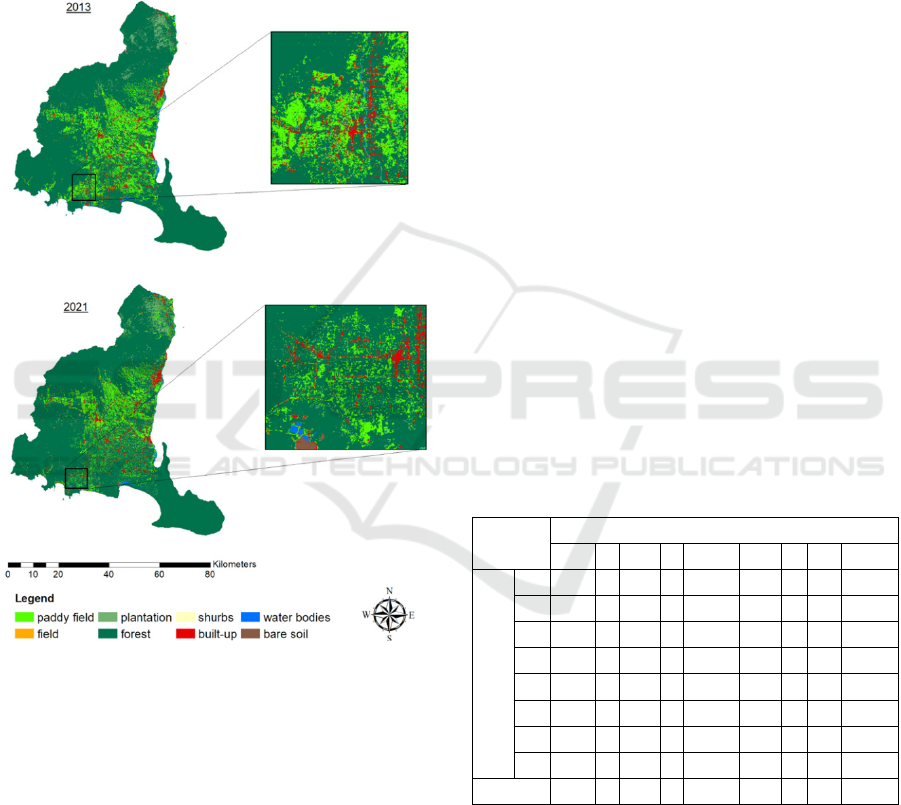
(Tamiminia et al., 2020). The classification results are
shown by the following Figure 5 and the script used
in this step is:
var aoi =
paddy_field.merge(field).merge(plan
tation).merge(shurbs).merge(forest)
.merge(built_up_area).merge(water_b
odies).merge(bare_soil);
var bands =
['B1','B2','B3','B4','B5','B6','B7'
];
var training =
composite.select(bands).sampleRegio
ns({ collection: aoi, properties:
['lc'], scale: 30});
var classifier =
ee.Classifier.smileRandomForest(100
).train({features: training,
Google Earth Engine for Assessing Land Use and Land Cover Change in Banyuwangi Regency
419
classProperty:'lc',inputProperties:
bands});
var classified =
composite.select(bands).classify(cl
assifier);
Map.addLayer(classified,{min: 1, max:
8,palette:['#98ff00','#c4980e','#46
a37a','#40ab36','#048711','#ff0000'
,'#68d9ff','#ffb868']},'landcover';
Figure 5: LULC classification in 2013 and 2021.
4.5 Accuracy Test
The accuracy test is carried out in almost the same
way as making a classification, namely making a
sample training area. This training area sample is then
combined with the classification results for the
validation process. The accuracy test script is shown
as follows, while the accuracy test matrix is shown in
Table 3 and 4.
var uji_aoi =
accuracy_test_paddy_field.merge(acc
uracy_test_field).merge(accuray_tes
t_plantation)
.merge(accuracy_test_shurbs).merge(acc
uracy_test_forest).merge(accuracy_t
est_built_up_area).merge(accuracy_t
est_water_bodies).merge(accuracy_te
st_bare_soil);
var validasi =
classified.sampleRegions({collectio
n: uji_aoi,properties:
['lc'],scale: 30,});
print(validasi);
var akurasi =
validasi.errorMatrix('lc',
'classification');
print('Confusion matrix', akurasi);
print('Overall accuracy: ',
akurasi.accuracy());
var class_areas =
ee.Image.pixelArea().divide(1000*10
00).addBands(classified)
.reduceRegion({
reducer:
ee.Reducer.sum().group({groupField:
1,groupName: 'code',}),geometry:
shp, maxPixels : 5000000000,scale:
30,})
.get('groups');
print(class_areas);
Table 3: Accuracy of LULC maps obtained from 2013
Landsat-8 satellite data.
Matrix
Sample area test
1 2 3 4 5 6 7 8 Total
Class image
1 234 0 0 0 36 1 0 0 271
2 0 0 0 0 3 0 0 0 3
3 2 0 33 0 53 0 0 0 88
4 2 0 1 0 0 0 0 0 3
5 0 0 2 0 6434 16 0 0 6452
6 1 0 0 0 4 34 0 0 39
7 0 0 0 0 0 0 3 0 3
8 1 0 0 0 1 0 0 0 2
Total 240 0 36 0 6531 51 3 0 6861
Sum of diagonal = 6738
Total = 6861
Overall accuracy = 98.2%
iCAST-ES 2021 - International Conference on Applied Science and Technology on Engineering Science
420
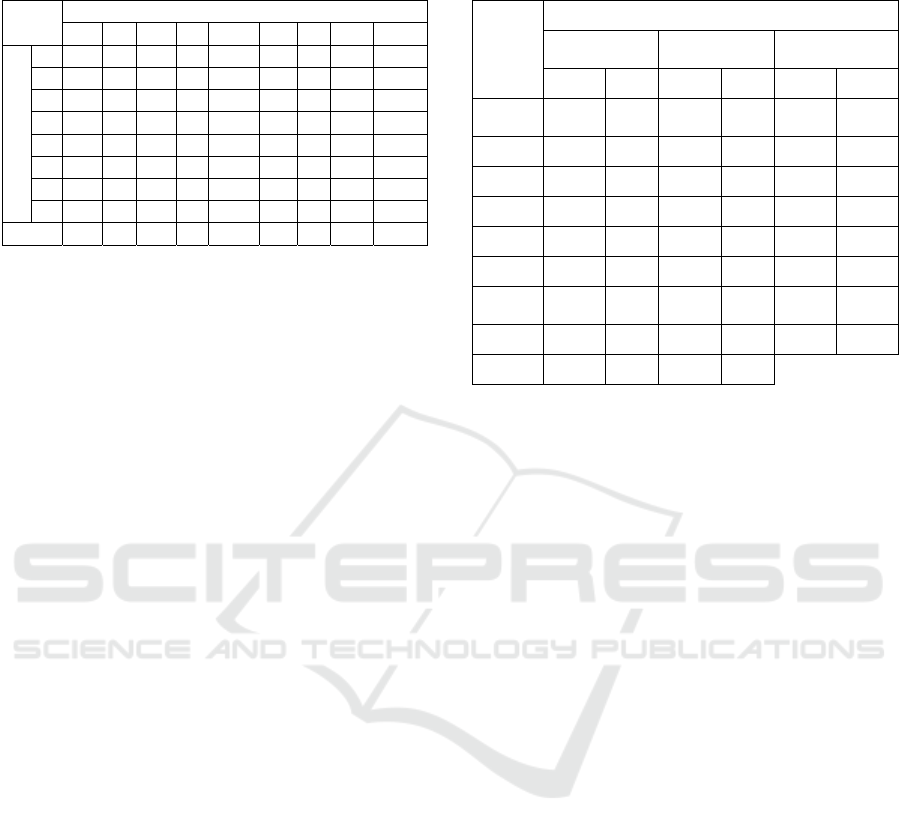
Table 4: Accuracy of LULC maps obtained from 2021
Sentinel-2 satellite data
Matrix
Sample area test
1 2 3 4 5 6 7 8 Total
Class image
1 352 0 1 0 2 0 1 0 356
2 0 0 0 0 0 0 0 0 0
3 1 0 216 0 0 0 0 0 217
4 0 0 0 0 0 0 0 0 0
5 73 12 310 8 35032 1 1 1 35438
6 0 0 0 0 0 169 0 2 171
7 0 0 0 0 0 0 47 0 47
8 0 0 0 0 0 0 0 122 122
Total 426 12 257 8 35034 170 49 125 36351
Sum of diagonal = 35938
Total = 36351
Overall accuracy = 98.8%
4.6 Distribution of LULC Change
The results of the study indicate that all land classes
have changed. The most significant changes occurred
in paddy fields and forests. Medium changes occur in
plantations, water bodies, built-up land, and open
land. While minor changes occurred in fields and
shrubs, as shown in Table 5.
Paddy fields decreased drastically due to several
things: First, changing paddy fields into built-up land.
The existence of new settlements caused by the
increase in population and the development of several
industrial sectors contributed to converting paddy
fields into built-up land. Second, the change of paddy
fields into forests because farmers convert rice plants
into wood plants, namely Sengo (Albizia Chinensis).
Third, the conversion of paddy fields into plantations.
Many farmers in southern Banyuwangi have turned
their fields into dragon fruit plantations (pitaya:
Hylocereus undatus).
The subsequent reduction in the class category is
water bodies and fields. Many water bodies are
located around the coast. The decrease in water
bodies is caused by many ponds being abandoned
because their permits have expired. Then switch
functions into mangrove forests, and some of them
turn into built-up land. The number of fields is
reduced because farmers change their crop
commodities into wood plants, so it is included in the
forest class.
Table 5: The distribution of land cover classification for
each year.
Land use
classes
The coverage area for each year
2013 2021
change 2013-
2021
km
2
% km
2
% km
2
%
paddy
field
514.59 14.24 378.71 10.48 -135.88 -3.759
field 0.59 0.02 0.41 0.01 -0.18 -0.005
plantation 76.48 2.12 92.38 2.56 +15.90 +0.440
shrubs 0.27 0.01 1.36 0.04 +1.09 +0.030
forests 2890.74 79.98 3001.95 83.06 +111.21 +3.077
built-up 101.69 2.81 114.04 3.16 +12.35 +0.342
water
b
odies
29.8 0.82 15.72 0.43 -14.08 -0.390
bare soil 0.18 0.00 9.75 0.27 +9.57 +0.265
Total 3614.34 100 3614.32 100
5 CONCLUSIONS
The study results conclude that the GEE Platform can
perform high-speed spatial analysis for large areas
and large data sets without searching and
downloading satellite data for desktop processing.
The land class can also be appropriately classified
using random forest classification with a very
satisfactory level of accuracy.
Significant land changes occur in paddy fields
and forests. Even though forest land is increasing, the
reduction of lowland rice land must be a severe
concern for the government to secure rice as the
leading staple food for the people of Banyuwangi. In
the future, monitoring of land change must continue
to be carried out by assessing the impact of land
change on environmental carrying capacity and land
criticality in the Banyuwangi Regency.
ACKNOWLEDGEMENTS
We would like to gratefully acknowledge the funding
support from Politeknik Negeri Banyuwangi through
the research master plan scheme.
REFERENCES
Alam, A., Bhat, M. S., & Maheen, M. (2020). Using
Landsat satellite data for assessing the land use and land
cover change in Kashmir valley. GeoJournal, 85(6),
Google Earth Engine for Assessing Land Use and Land Cover Change in Banyuwangi Regency
421

1529–1543. https://doi.org/10.1007/s10708-019-
10037-x
BPS Badan Pusat Statistik. (2020). Banyuwangi dalam
Angka. Retrieved from www.banyuwangikab.bps.go.id
Gorelick, N., Hancher, M., Dixon, M., Ilyushchenko, S.,
Thau, D., & Moore, R. (2017). Google Earth Engine:
Planetary-scale geospatial analysis for everyone.
Remote Sensing of Environment, 202, 18–27.
https://doi.org/10.1016/j.rse.2017.06.031
He, S., Li, P., Wu, J., & Elumalai, V. (2019). Human and
Ecological Risk Assessment : An International
Groundwater quality under land use / land cover
changes : A temporal study from 2005 to 2015 in.
Human and Ecological Risk Assessment: An
International Journal, 0(0), 1–27.
https://doi.org/10.1080/10807039.2019.1684186
Jr, C. M. S., Shimbo, J. Z., Rosa, M. R., Parente, L. L.,
Alencar, A. A., Rudor, B. F. T., … Oliveira, S. W. De.
(2020). Reconstructing Three Decades of Land Use and
Land Cover Changes in Brazilian Biomes with Landsat
Archive and Earth Engine. Remote Sensing, 12(2735).
Qu, L., Chen, Z., Li, M., Zhi, J., & Wang, H. (2021).
Accuracy Improvements to Pixel-Based and Object-
Based LULC Classification with Auxiliary Datasets
from Google Earth Engine. Remote Sensing, 13(453).
Ramanamurthy, B. V, & Victorbabu, N. (2021). Land Use
Land Cover ( LULC ) classification with wasteland
demarcation using Remote sensing and GIS
Techniques. In IOP Conference Series: Materials
Science and Engineering. International Conference on
Sustainable Systems and Structures (p. 012035). IOP
Publishing. https://doi.org/10.1088/1757-
899X/1025/1/012035
Tamiminia, H., Salehi, B., Mahdianpari, M., Quackenbush,
L., Adeli, S., & Brisco, B. (2020). Google Earth Engine
for geo-big data applications: A meta-analysis and
systematic review. ISPRS Journal of Photogrammetry
and Remote Sensing, 164, 152–170.
https://doi.org/10.1016/j.isprsjprs.2020.04.001
Wijaya, A., & Susetyo, C. (2017). Analisis Perubahan
Penggunaan Lahan di Kota Pekalongan Tahun 2003,
2009, dan 2016. Jurnal Teknik ITS, 6(2), 417–420.
Zhu, C., Lin, Y., Zhang, J., Gan, M., Xu, H., Li, W., …
Wang, K. (2021). Exploring the relationship between
rural transition and agricultural eco-environment using
a coupling analysis : A case study of Zhejiang.
Ecological Indicators, 127.
https://doi.org/10.1016/j.ecolind.2021.107733
Zurqani, H. A., Post, C. J., Mikhailova, E. A., Schlautman,
M. A., & Sharp, J. L. (2018). Geospatial analysis of
land use change in the Savannah River Basin using
Google Earth Engine. International Journal of Applied
Earth Observation and Geoinformation, 69, 175–185.
https://doi.org/10.1016/j.jag.2017.12.006
iCAST-ES 2021 - International Conference on Applied Science and Technology on Engineering Science
422
