
Twitter Sentiment Analysis on the Implementation of Online
Learning during the Pandemic using Naive Bayes and
Support Vector Machine
I. Wayan Suasnawa, I. Gusti Ngurah Bagus Caturbawa, I. Gede Suputra Widharma,
Anak Agung Ngurah Gde Sapteka, I. Nyoman Eddy Indrayana and I. Gusti Agung Made Sunaya
Department of Electrical Engineering, Politeknik Negeri Bali, Badung, Bali, Indonesia
Keywords: Online Learning, Machine Learning, Naïve Bayes, Support Vector Machine.
Abstract: The Covid-19 pandemic situation presents a new phenomenon in the world of education. In this situation, it
is not possible to conduct face-to-face learning so that online learning becomes the main choice. The online
learning method certainly has advantages and disadvantages. There are many comments, both pros and cons
regarding the implementation of this online learning. People's sentiments can be grouped into three, those
who feel that the implementation of online learning is able to provide a good solution (positive), those who
consider it not an effective solution (negative), and those that are not both (neutral). In this study, the data
used in the social media Twitter. In this study, the Naive Bayes classifier and the Support Vector Machine
will be used to obtain sentiment analysis on the implementation of online learning during the pandemic. The
results of this study indicate that public sentiment is classified into three classes positive, negative and neutral
with a precision level of 0.76 (positive), 0.79 (negative) and 0.92 (neutral) in machine learning using the
Naïve Bayes classifier and 0.78 (positive), 0.50 (negative). ) and 0.54 (neutral) on machine learning using the
Support Vector Machine classifier. Meanwhile, the accuracy value is above 0.8 for the Naïve Bayes classifier
and 0.61 for the Support Vector Machine classifier. The results obtained in machine learning with 2 different
classifiers show that the Naïve Bayes classifier has better precision and accuracy than the Support Vector
Machine.
1 INTRODUCTION
The Covid-19 pandemic has become an epidemic that
has changed many aspects of life since its emergence
in January 2020. The pandemic has caused significant
global social and economic disruption. The pandemic
causes delays or cancellations of activities, food
disruptions, and an increase in poverty because many
businesses cannot run normally. In addition,
educational institutions and public areas have been
partially or completely closed.
The Covid-19 pandemic situation presents a new
phenomenon in the world of education. In this
situation, it is not possible to conduct face-to-face
learning so that online learning becomes the main
choice. Online or online learning requires the
presence of technology, and the need for technology
is strongly felt in the learning process. The online
learning method certainly has advantages and
disadvantages. During this pandemic we are teachers
using trial and error techniques because this is a new
thing for most teachers and students.
Of course, there are a number of obstacles faced
by teachers and students when learning online. There
are many comments, both pros and cons regarding the
implementation of this online learning. For this
reason, it is necessary to know how far community
sentiment is in terms of implementing online
learning. People's sentiments can be grouped into
two, those who feel that the implementation of online
learning is able to provide a good solution and there
are also those who think that the implementation of
online learning is not an effective solution.
To find out people's sentiments, we can take and
use data on social media. Social media is a medium
that is a means to express opinions in the public
sphere through digital media. One of them that is
often used as a reference is the sentiment of social
media twitter. With methods in the computer world
known in machine learning, results can be obtained in
348
Suasnawa, I., Caturbawa, I., Widharma, I., Sapteka, A., Indrayana, I. and Sunaya, I.
Twitter Sentiment Analysis on the Implementation of Online Learning during the Pandemic using Naive Bayes and Support Vector Machine.
DOI: 10.5220/0010945500003260
In Proceedings of the 4th International Conference on Applied Science and Technology on Engineering Science (iCAST-ES 2021), pages 348-353
ISBN: 978-989-758-615-6; ISSN: 2975-8246
Copyright
c
2023 by SCITEPRESS – Science and Technology Publications, Lda. Under CC license (CC BY-NC-ND 4.0)

the form of negative tweets, neutral tweets and
positive tweets. In this study, the Naive Bayes method
and the Support Vector Machine will be used to
obtain sentiment analysis on the implementation of
online learning during the pandemic.
2 THEORY
2.1 Machine Learning
Machine learning is a subset of Computer Science
that makes computers learn from experiences like
humans. This science was developed for
computational learning, pattern recognition, and
information retrieval. One of the main advantages of
machine learning is that computers can be trained to
automate tasks that would be exhausting or
impossible for humans.
It is a branch of artificial intelligence, which
requires the design and development of algorithms
that enable computers that can learn from data and
predict data. Since intelligence requires knowledge,
computers also need to derive knowledge from
empirical data. Machines can be trained to translate
knowledge into features. The extracted features can
be used to develop the model. Machine learning
algorithms make predictions or decisions based on
data by building mathematical models from empirical
data rather than following a predetermined set of
program instructions. In traditional programming
Program and Data Input determine the output,
whereas in Machine Learning the data input and
Output from past instances determine the program.
Machine learning as a computer program that can
learn from experience with respect to several tasks
and required performance measures (Mitchell, 1997).
Tens of thousands of machine learning algorithms
already exist and every year hundreds of new
algorithms are developed. Every machine learning
algorithm has three components called
representation, evaluation and optimization (Luna, et
al., 2011). Representation is a representation of the
model space and is carried out in the form of decision
trees, rule-based programs, Bayes/Markov models,
artificial neural networks, supporting vector
machines and ensemble models. Evaluation is to
measure how effective the algorithm is and is carried
out using measures such as Mean Square Error,
Accuracy, Precision and Recall, Confusion Matrix,
Cost, Utility, Entropy, Maximum Likelihood Error,
Gini Index and KL divergence etc. Optimization, is
how the represented model space is searched to get a
better evaluation.
Machine learning involves two phases, namely
the training phase and the testing phase. In the
training phase, the system learns to complete certain
tasks such as classification or prediction using a
specific data set that contains information about that
particular problem. Based on this learning, the system
is able to analyze new sample data with the same
distribution as the trained data and provide
predictions. In reality, there is no perfect method to
solve a particular problem, because it relies on
empirical data.
Machine learning algorithms are classified into
Unsupervised, Supervised and Reinforcement
Learning algorithms (Putra, 2020). Unsupervised
algorithms learn from unlabeled data, Supervised
algorithms are trained from labeled data, and
Reinforcement Learning algorithms use
environmental information other than learning data
and can make decisions adaptively.
2.2 Sentiment Analysis
Sentiment analysis can aim to extract the polarity of
opinion against an entity from a document, extracting
the polarity of opinion from individual sentences
(Chen, et al., 2019). A large number of sentiment
analysis methods are categorized as rules-based,
machine learning-based, and deep learning-based
methods. The existence of huge amounts of
unstructured data in recent decades has made
sentiment analysis adaptable to new requirements and
methods. Sentiment analysis trends can be grouped
into aspect sentiment analysis, multimodal,
contextual, sentiment reasoning, domain adaptation
and so on (Al-Ghadir, et al., 2020).
2.2 Naïve Bayes
The Naïve Bayes method is a collection of
classification algorithms based on the Bayes
Theorem, commonly used in machine learning. This
method is not a single algorithm but a set of
algorithms that all have the same principle, that each
classified feature does not depend on the value of
other features. For example, a fruit is considered an
apple if it is green, round, and about 6 cm in diameter.
The Naive Bayes classifier considers each of these
features (green, round, 6 cm in diameter) to contribute
independently to the probability that the fruit is an
apple, regardless of any correlation between the
features. However, the features are not always
independent which is often considered as a drawback
of the Naive Bayes algorithm. While this is a
relatively simple idea, Naive Bayes can often
Twitter Sentiment Analysis on the Implementation of Online Learning during the Pandemic using Naive Bayes and Support Vector Machine
349

outperform other more sophisticated algorithms and
is very useful in general applications such as spam
detection and document classification. In short,
algorithms allow us to predict classes, given a set of
features using probabilities. So in another fruit
example, we can predict whether the fruit is an apple,
orange or banana (class) based on its color, shape, and
so on. To understand the Naive Bayes algorithm, the
concepts of class probability and conditional
probability must be introduced first.
The class probability is the probability of a
class in the data set.
𝑃
(
𝐶
)
=
𝑐𝑜𝑢𝑛𝑡 (𝑖𝑛𝑠𝑡𝑎𝑛𝑐𝑒𝑠 𝑖𝑛 𝐶)
𝑐𝑜𝑢𝑛𝑡 (𝑖𝑛𝑠𝑡𝑎𝑛𝑐𝑒𝑠 𝑖𝑛 𝑁𝑡𝑜𝑡𝑎𝑙)
(1)
The class probability is the probability of a
class in the data set.
𝑃
(
𝑉|𝐶
)
=
𝑐𝑜𝑢𝑛𝑡 (𝑖𝑛𝑠𝑡𝑎𝑛𝑐𝑒𝑠 𝑤𝑖𝑡ℎ 𝑉 𝑎𝑛𝑑 𝐶)
𝑐𝑜𝑢𝑛𝑡 (𝑖𝑛𝑠𝑡𝑎𝑛𝑐𝑒𝑠 𝑤𝑖𝑡ℎ 𝑉)
(2)
The class probability is the probability of a
class in the data set.
𝑃
(
𝐴|𝐵
)
=
𝑃
(
𝐵
|
𝐴
)
𝑃(𝐴)
𝑃(𝐵)
(3)
The advantage of using the Naive Bayes algorithm is
that it is easy to understand. Moreover this method
works well on datasets with irrelevant features, as
their probability of contributing to the output is low.
Therefore they are not taken into account when
making predictions. In addition, this algorithm
usually produces good performance in terms of
resources consumed, because it only needs to
calculate the probabilities of features and classes,
there is no need to look for coefficients like in other
algorithms (Zhang, et al., 2016).
2.3 Support Vector Machine (SVM)
SVM is a data classification method in machine
learning. This method uses Supervised Learning to
analyze data and recognize patterns for classification
and regression analysis (Burges, 1998). SVM
efficiently minimizes prediction errors and model
complexity. With a series of training examples each
marked as belonging to one of two categories, the
SVM training algorithm builds a model that assigns
new examples into one of the categories. SVM is a
popular classification algorithm that can be applied to
fraud detection, identifying cancer cells from healthy
ones, facial recognition, weather prediction, etc.
(Ben-Hur, et al., 2008). SVM was developed to find
binary classifiers using training data, whose data is
already labeled. There are several variations of this
problem in the literature, but the binary SVM
classification is the most popular (Kim, et al., 2012).
Classification algorithms are used to maximize
performance and maintain generalization for
unknown data. In other words, there is a trade-off
between adapting the data and the generalizability of
the model. The SVM algorithm classifies data by
looking for a hyperplane that can separate the two
classes. This approach is represented as equation 4.
𝑦
= sign (H(x)
)
(4)
where H(x) is the decision function in this formula.
The separating hyperplane is the set of all points that
can satisfy conditions such as equation 5.
H(x) = w
T
x + b = 0
(5)
where x is a feature vector, w is the weight vector, and
b is offset. In the linear equation above, the weight
vector determines the orientation of the hyperplane in
space. The hyperplane is directly proportional to the
weight vector, and b is the offset or hyperplane
distance from the starting point. The hyperplane
divides the input space into two and a half spaces. An
important property of this hyper-plane is that H(x) >
0 in one of the half spaces and H(x) < 0 in another
room and H(x) = 0 for all data points in the hyper-
plane. This hyperplane is used to classify test data
into two classes, where H(x) > 0 means related to
label +1 and H(x) < 0 related to label -1.
𝑦
=
1𝑤
𝑥+ 𝑏>0
−1 𝑤
𝑥+ 𝑏<0
(6)
The distance from the nearest data point in the
training set to the dividing hyper plane is called the
separator margin. Although we can find several
hyperplanes that satisfy Equation 6, the hyperplane
which has the maximum dividing margin between the
two classes is unique and is found through
optimization. The maximum separation margin is
required because it increases the generalizability of
the model or the ability to handle noise better in the
test data and data points that lie on the margins are
classified according to their location. Another term
named for this method is support vector. A support
vector is a data point whose distance from the
separating hyperplane is equal to one after
normalization.
iCAST-ES 2021 - International Conference on Applied Science and Technology on Engineering Science
350
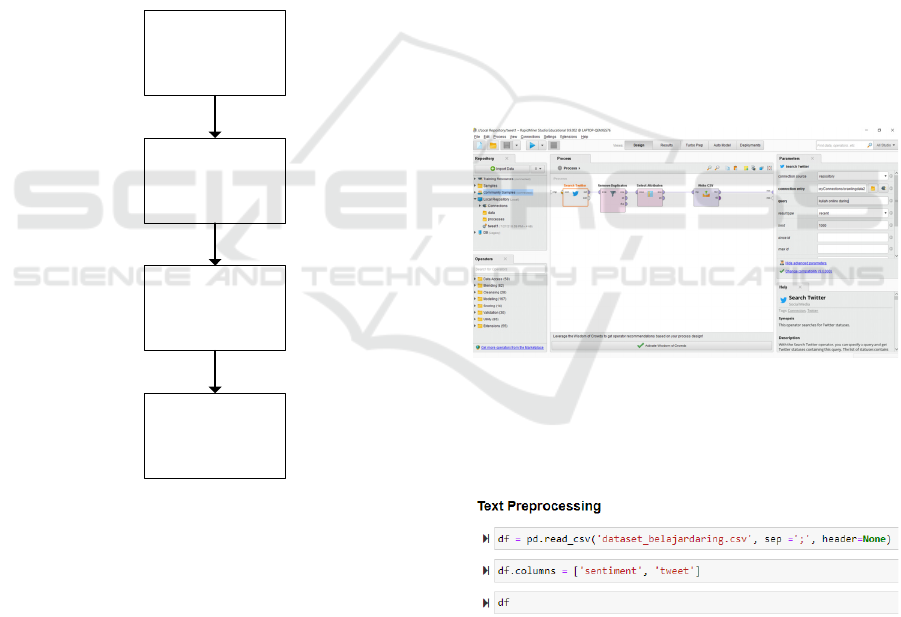
3 RESEARCH METHODOLOGY
The method used in this study can be described as
shown in Figure 1. This research is an analysis of
sentiment towards online learning in Indonesia. So
that the data taken from twitter is data comments or
tweets in Indonesian. At the initial stage, the dataset
collection from Twitter social media will be used for
training and testing. The data collection carried out is
in the form of data collection related to the data
needed to be used as initial data, namely data from
community comments regarding the implementation
of online learning on Twitter social media during this
pandemic. The data obtained is then stored in a .csv
file. Then proceed with data preprocessing. Data
preprocessing is data processing so that data is clean,
without noise to improve machine learning
performance.
Crawling Data
Twitter
Preprocessing
Training
Testing
Figure 1: Sentiment analysis with machine learning
algorithm.
The next stage is training, the model is made to
learn by linking input, namely commentary text based
on existing datasets to output in the form of
appropriate tags. The amount of training and test data
used is 800. The feature extractor processes text input
into feature vectors. The feature vectors and tags
(positive, negative or neutral) are processed by
machine learning algorithms to generate models. The
feature extractor in the prediction process converts
invisible text input into feature vectors. The feature
vector is entered into the model to get a predicted tag
(positive, negative, or neutral). The feature extraction
technique can improve the performance of the
classifier so that the result is that the categorization of
words with similar meanings has a similar
representation. The classifiers used are Naïve Bayes
and Support Vector Machines.
In the final stage, namely testing, by providing
input comments to the machine learning training
model. The result of this test is whether the output
produced by the model is appropriate or not. The test
results are an evaluation as a basis for whether the
model needs to be improved or not.
4 IMPLEMENTATION
4.1 Data Collection
Data collection is done by taking data from twitter.
The data from this survey will be used as a dataset for
machine learning during the system training process
to get the model. This data retrieval using rapidminer
software as shown in Figure 2.
Figure 2: Twitter data collection with Rapidminer.
The data is organized into files in .csv format for input
into machine learning. Figure 3 below is the code to
retrieve data that is ready for further processing.
Figure 3: Program code to enter the dataset into the system.
4.2 Data Preprocessing
At this stage, data selection is carried out so that the
data used becomes more structured. The stages of text
preprocessing in this study use several stages,
including: filtering, tokenization, stopword removal,
Twitter Sentiment Analysis on the Implementation of Online Learning during the Pandemic using Naive Bayes and Support Vector Machine
351
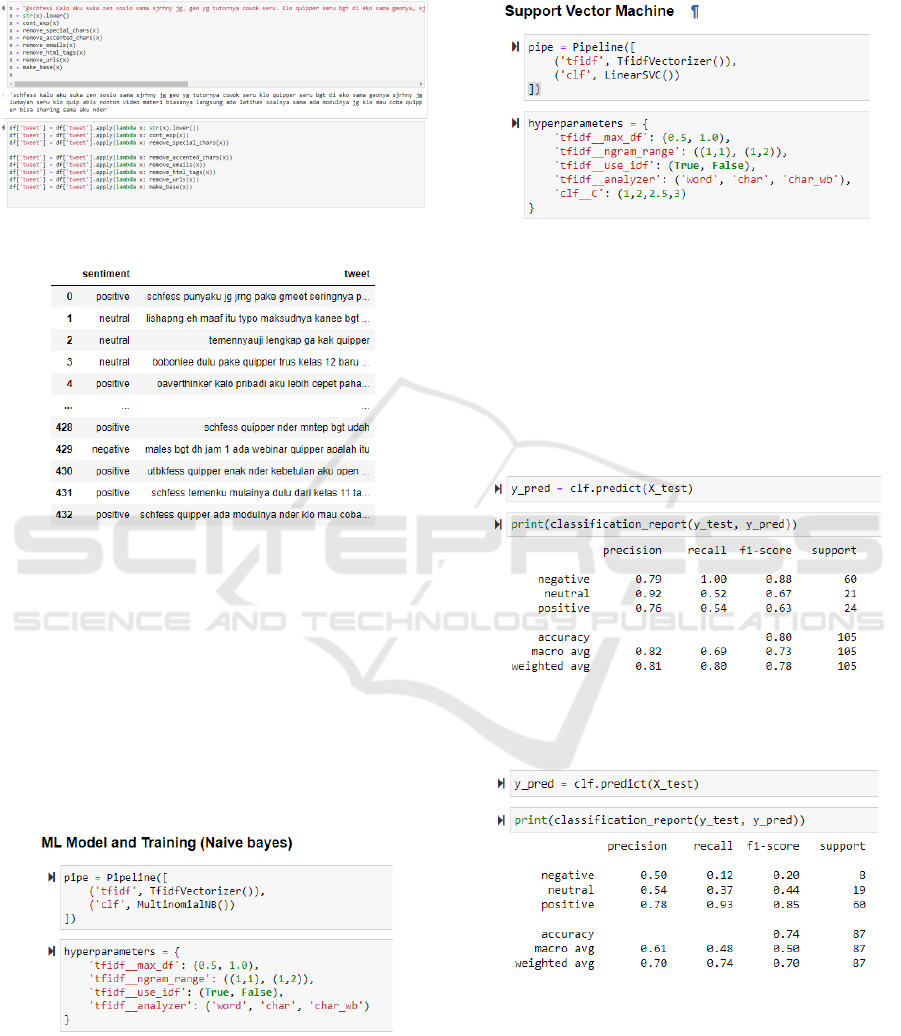
and stemming. Figure 4 is the twitter sentiment data
preprocessing code that has been entered into the
system. And the results can be seen in Figure 5.
Figure 4: Preprocessing data.
Figure 5: Data preprocessing results.
4.3 Model Training
Twitter sentiment data that has gone through
preprocessing will be used for machine learning in the
training process, and some of the data is used as
testing, classified according to its class (sentiment
class) to determine the polarity of the text whether it
includes positive, negative, or neutral opinions using
the Naïve Bayes Classifier. and Support Vector
Machines.
Figure 6: Program code for training with the Naïve Bayes
Classifier.
Figure 6 is the training code with the Naïve Bayes
Classifier and Figure 7 below is the training code with
the Classifier Support Vector Machine.
Figure 7: Program code for training with the Support Vector
Machine classifier.
While the results of training with the Naïve Bayes
classifier can be seen in Figure 8 and with the Support
Vector Machine classifier it can be seen in Figure 9.
The results of the training and classification of
comments will get the values of accuracy, precision,
and recall from the calculation results of Machine
Learning.
Figure 8: Results of training with the Naïve Bayes
classifier.
Figure 9: Results of training with the Support Vector
Machine classifier.
4.4 Model Testing and Evaluation
System evaluation is done by providing input in the
form of comments on Twitter media related to online
iCAST-ES 2021 - International Conference on Applied Science and Technology on Engineering Science
352

learning to systems that have gone through the
training process and the system will provide output or
output in the form of sentiment.
5 RESULTS AND DISCUSSION
In the training process, the values of precision,
accuracy and recall are obtained. This parameter is
used as a measure of the reliability of the resulting
machine learning. Machine learning training and
testing is carried out to determine accuracy with 2
classifiers, namely Naïve Bayes and Support Vector
Machine in the case of sentiment analysis of the
implementation of online learning during the
pandemic. Table 1 shows the precision and accuracy
results obtained with the Naïve Bayes Classifier and
Table 2 using the Support Vector Machine Classifier.
Based on Table 1 and Table 2, it is found that
accuracy and precision with the Naïve Bayes
classifier have better results than the results of the
Support Vector Machine classifier for case studies of
online learning during the pandemic.
Table 1: Accuracy and precision results on Naïve Bayes
Classifier.
Precision
Ne
g
ative 0.79
Neutral 0.92
Positive 0.76
Accurac
y
Macro av
g
0.82
Wei
g
hted av
g
0.81
Table 2: Accuracy and precision results on the Support
Vector Machine Classifier.
Precision
Negative
0.50
Neutral
0.54
Positive
0.78
Accurac
y
Macro avg
0.61
Weighted avg
0.70
6 CONCLUSIONS
Machine learning that can be applied to find out
people's sentiments towards online learning during a
pandemic has 3 sentiment values, namely positive,
negative or neutral. In this study using a machine
learning algorithm where the classifier uses Naïve
Bayes and Support Vector Machine. The results of
this study indicate that public sentiment is classified
into three classes positive, negative and neutral with
a precision level of 0.76 (positive), 0.79 (negative)
and 0.92 (neutral) in machine learning using the
Naïve Bayes classifier and 0.78 (positive), 0.50
(negative). ) and 0.54 (neutral) on machine learning
using the Support Vector Machine classifier.
Meanwhile, the accuracy value is above 0.8 for the
Naïve Bayes classifier and 0.61 for the Support
Vector Machine classifier.
The results obtained on machine learning with 2
different classifiers show that the Naïve Bayes
classifier has better precision and accuracy than the
Support Vector Machine. From the results obtained,
the better model to use is the model that uses the
Naive Bayes Classifier. More datasets need to be
added to find out the possibility of getting better
precision and accuracy on the Support Vector
Machine.
REFERENCES
Mitchell, T. M., (1997). Machine Learning, McGraw-Hill,
New York.
Putra, J. W. G. (2020). Pengenalan Konsep Pembelajaran
Mesin dan Deep Learning, Self Publishing, Edisi1.4.
Zhang, H., Yao, D., Ramakrishman, N., and Zhang, Z.,
(2016). Causality reasoning about network events for
detecting stealthy malware activities. Elsevier pp.180-
198.
Burges, C. (1998). A Tutorial on Support Vector Machines
for Pattern Recognition, Data Mining and Knowledge
Discovery, vol 2, no 2, pp. 121–167.
Luna, Primitivo & Alejo, Roberto & Valdovinos, Rosa &
Méndez, Benjamín. (2011). Training Optimization for
Artificial Neural Networks. Ciencia Ergo Sum. 17.
Kim, G., Chae, B., and Olson, D. (2012). A support vector
machine (SVM) approach to imbalanced datasets of
customer responses: Comparison with other customer
response models. Service Business.
Ben-Hur A, Ong CS, Sonnenburg S, Schölkopf B, and
Rätsch G. (2008). Support Vector Machines and
Kernels for Computational Biology, PLoS Comput
Biol, vol 4, no. 10.
Chen M. Y., and Chen, T. H. (2019) Modeling public mood
and emotion: Blog and news sentiment and socio-
economic phenomena, Futur. Gener. Comput. Syst.,
vol. 96, pp. 692–699.
Al-Ghadir, A., Azmi, A., and Hussain, A. (2020). A novel
approach to stance detection in social media tweets by
fusing ranked lists and sentiments, Information Fusion,
vol 67, pp. 29-40.
Twitter Sentiment Analysis on the Implementation of Online Learning during the Pandemic using Naive Bayes and Support Vector Machine
353
