
Numerical Study the Effect of Undulation to Mitigate Erosion Elbow
Sultana Yafita Mawaddah, Lohdy Diana and Hendrik Elvian Gayuh Prasetya
Power Plant Engineering, Politeknik Elektronika Negeri Surabaya, Surabaya, Indonesia
Keywords: Erosion, Wear, Sand, Elbow, CFD, Computational Fluid Dynamics.
Abstract: Wear is a problem that is often encountered in the production process. It can cause erosion in the production
section of the pipe. Wear and tear can cause erosion resulting in leakage in the pipe, so it is necessary to
predict erosion on the elbow pipe. In this study, CFD modeling on ANSYS 19.1 application was used to
predict erosion in air flow with variations in undulation and combined with a twist configuration can reduce
erosion in the elbow pipe. This is to determine whether the modeling with a certain number of undulation and
combined with a twist configuration can reduce erosion in the elbow pipe. Changes in flow greatly affect the
rate of erosion because they can affect the interaction of particles with the wall and the speed of impact. The
final result of this research is that the pipe with the 3-undulation variation reduces erosion by 38%, while the
pipe with the 5-undulation variation reduces erosion by 22% compared to the planned pipe.
1 INTRODUCTION
Wear is a problem that is often encountered in the
production process. This is because it can cause
erosion in the production section of the pipe. The
process is repeated over and over again, resulting in
the pipe will often experience friction and pressure
with coal particles. Coal particles gain momentum
from the fluid passing through the flow path and
impacting the walls, resulting in erosion (Yudhatama,
Purbawanto, and Jatimurti 2018). Pneumatic particles
that move generally can trigger the erosion process
and impact the wall. The impact produces particle
interactions (Duarte and de Souza 2017). In addition,
the mixture of gases and sand particles passing
through the pipe combined with the velocity and
nature of the fluid creates a risk for different
equipment. Therefore, it is expected to be able to
predict erosion accurately (Strømme 2015).
A simulation was carried out in this study to
determine the erosion rate at the pulverizer outlet pipe
using 4-undulation and 8-undulation variations.
Undulation is a waveform in a pipe by combining
similar circles and varying in several angles. This
aims to determine the pipe location that may
experience the earliest leakage due to coal and the
best geometry to reduce erosion. Then the results of
this study can then be used as a reference to prevent
erosion on pipe elbows in various industries.
2 NUMERICAL METHOD
Computational Fluid Dynamics (CFD) is the art of
replacing integral and partial differential equations
into discrete algebraic equations, which can then be
solved to obtain solutions in the form of flow values
at discrete points of space and time (Anderson 1995).
In the case of air fluid flow using sand, the CFD
model equation is used. (Diana et al. 2020)
2.1 Flow Modelling
Flow modeling is the first step in the erosion
prediction stage using CFD to solve the Navier-
Stokes equation or adjust the fluid motion equation.
In most circumstances, the fluid flow through the pipe
is critically affected by the presence of the pipe wall.
The no-slip condition between the fluid and the wall
causes a change in the mean velocity field in the near
wall region, where viscous damping and kinematic
blocking reduce the velocity and normal fluctuations
near the wall. However, a large gradient in the mean
velocity causes the production of turbulent kinetic
energy which consequently builds up turbulent flow
towards the center of the pipe as the fluid flow
approaches the core region of the pipe (Wee and Yap
2019).
Mawaddah, S., Diana, L. and Prasetya, H.
Numerical Study the Effect of Undulation to Mitigate Erosion Elbow.
DOI: 10.5220/0010945400003260
In Proceedings of the 4th International Conference on Applied Science and Technology on Engineering Science (iCAST-ES 2021), pages 339-347
ISBN: 978-989-758-615-6; ISSN: 2975-8246
Copyright
c
2023 by SCITEPRESS – Science and Technology Publications, Lda. Under CC license (CC BY-NC-ND 4.0)
339

2.2 Secondary Phase Modelling
Discrete phase modeling was chosen to model the
secondary phase because the volume fraction of sand
in the fluid flow is below 10% (Wee and Yap 2019).
The particle trajectory is calculated by integrating the
particle motion under the Lagrangian frame of
reference, where the drag force, pressure gradient
force, and buoyancy forces are considered as follows:
du
⃗
dt
=F
⃗
+F
⃗
+F
⃗
+F
⃗
(1
)
Drag force F
⃗
is the force resulting from the
interaction between solid particles and a continuously
moving fluid. Of all the resulting particle forces, the
hydrodynamic or drag force F
⃗
has the dominant
effect on determining the trajectory of the particle.
The equation F
⃗
is given as follows:
F
⃗
=
18μ
ρ
d
C
Re
24
(u
⃗
−u
⃗
)
(2)
Where C
is the drag coefficient and Re
is the
Reynold number of the particle. The values of C
and
Re
are obtained by the following equation:
C
= a
+
a
Re
+
a
Re
(3)
Re
=
ρd
u
⃗
−u
⃗
μ
(4)
Where a
, a
dan a
are constant smooth spherical
particles. F
⃗
is the pressure gradient force of the
particles with the exchange of pressure between
particles. The equation governing F
⃗
is:
F
⃗
=
ρ
ρ
∇P
(5)
The Buoyancy Force is the force that holds the
particles from the fluid, the equation that governs the
Buoyancy Force is:
F
⃗
=
ρ
− ρ
ρ
g
⃗
(6)
Particle dispersion due to turbulence in the fluid
phase can be corrected using the stochastic tracking
model (Wee and Yap 2019).
3 PARTICLE WALL
INTERACTION
For non-rotating particles, the interaction of the
particles with the wall causes a loss of energy due to
the inelastic impact with the wall. This causes the
particle to bounce off the boundary as its momentum
changes. The change in momentum is defined as the
coefficient of restitution. The normal coefficient of
restitution is the sum of the momentum in the
direction normal to the wall that holds the particle
after collision with the boundary. Similarly, the
tangential coefficient of restitution is the sum of the
momentum in the direction tangential to the wall
holding the particle. The effects of particle behavior
with walls were described in the application of the
Forder Rebound Model. The Ford Rebound Model
was chosen based on the type of collision used, which
is sand and iron particles (Wee and Yap 2019). It is
possible more stable to predict the interaction of the
particles with the walls in this final project.
4 EROSION MODELLING
The equation used is a variation of the speed and
impact angel performed by Oka and Yoshida. The
equation uses a model based on the same material at
varying speeds. In the Oka equation (Oka, Okamura,
and Yoshida 2005), the erosion damage is written as:
𝐸
(
𝑎
)
=𝑔(𝑎)𝐸
(7)
Where 𝑔(𝑎) is the impact angle using
trigonometric functions and initial Vickers hardness
(Hv). n1 and n2 are exponents obtained from eroded
material hardness and other impact conditions.
𝑔
(
𝑎
)
=
(
𝑠𝑖𝑛𝑎
)
1 + 𝐻𝑣
(
1−𝑠𝑖𝑛𝑎
)
(8)
E
90
is a representation of erosion at the normal
collision angle, it is related to the impact speed,
particle diameter, and the hardness of the eroded
material. Then the equation is:
𝐸
=81.714 𝐻𝑣
.
(
𝑈𝑝
𝑈𝑟𝑒𝑓
)
(
𝐷𝑝
𝐷𝑟𝑒𝑓
)
(9)
𝑈𝑝 and 𝐷𝑝 are the impact velocity and diameter,
while 𝑈𝑟𝑒𝑓 and 𝐷𝑟𝑒𝑓 are references to the impact
velocity and diameter as described by Oka (Oka,
Okamura, and Yoshida 2005). While k2 is the
exponent of eroded material hardness and property of
the particle. For k3 is a parameter taken from the
iCAST-ES 2021 - International Conference on Applied Science and Technology on Engineering Science
340
property of the particle. Thus, the erosion rate can be
calculated with the desired wall domain with the
equation:
𝐸𝑓=
1
𝐴
𝑓
𝑚
𝐸(𝑎)
()
(10)
Where 𝐴𝑓 is the wall surface area, 𝑚
is the
particle flow rate and 𝐸𝑓 is the erosion ratio.
5 CFD MODELLING
5.1 Geometry
Undulation is a waveform with settings on the
number of loops configured with angle settings. In
this final project, 3-undulation and 5-undulation
configurations are used and make a pipe that twists
along the inlet flow of the elbow pipe.
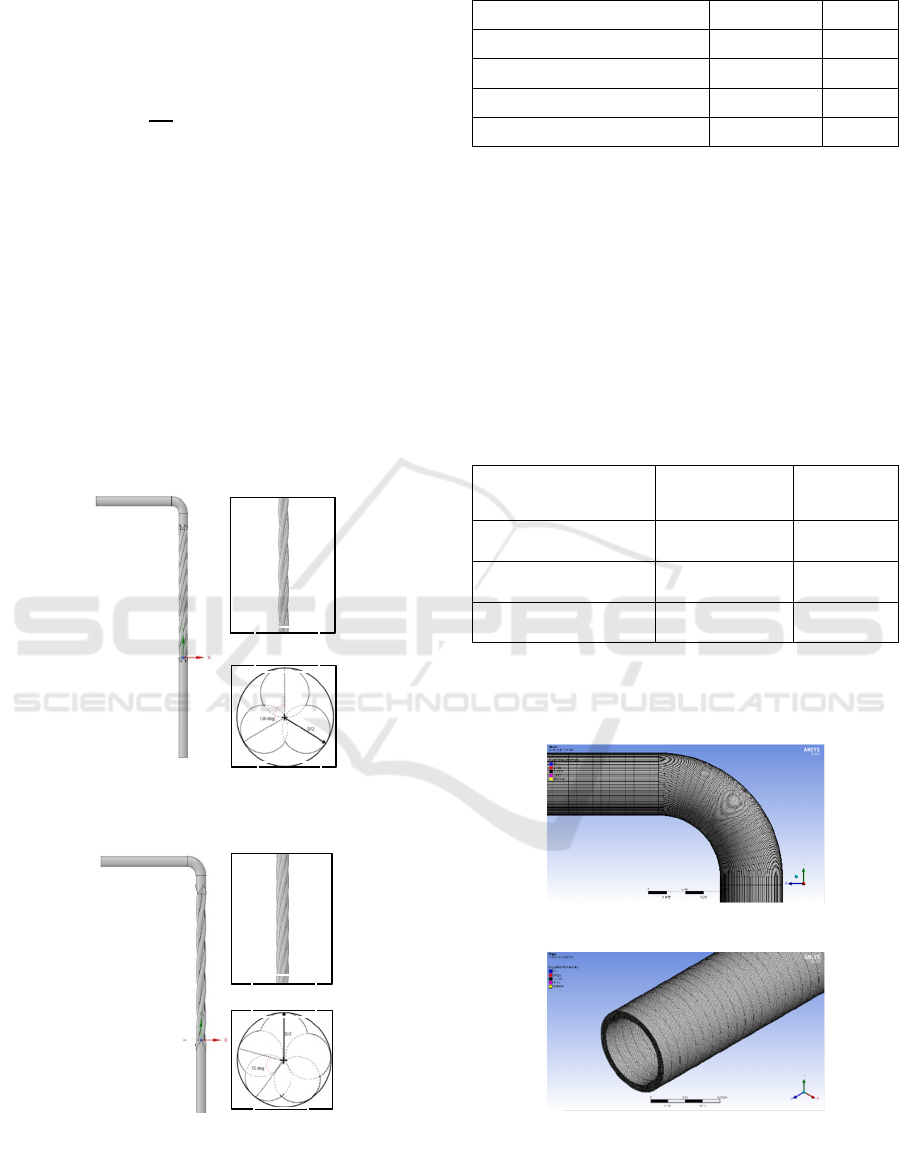
Figure 1: Pipe section scheme with 3 undulation.
Figure 2: Pipe section scheme with 5 undulation.
Table 1: Pipe Properties.
Properties Value unit
Elbow pipe diameter 76.2 mm
Elbow pipe inlet length 1000 mm
Elbow pipe outlet length 600 mm
Elbow pipe radius 90
o
114.3 mm
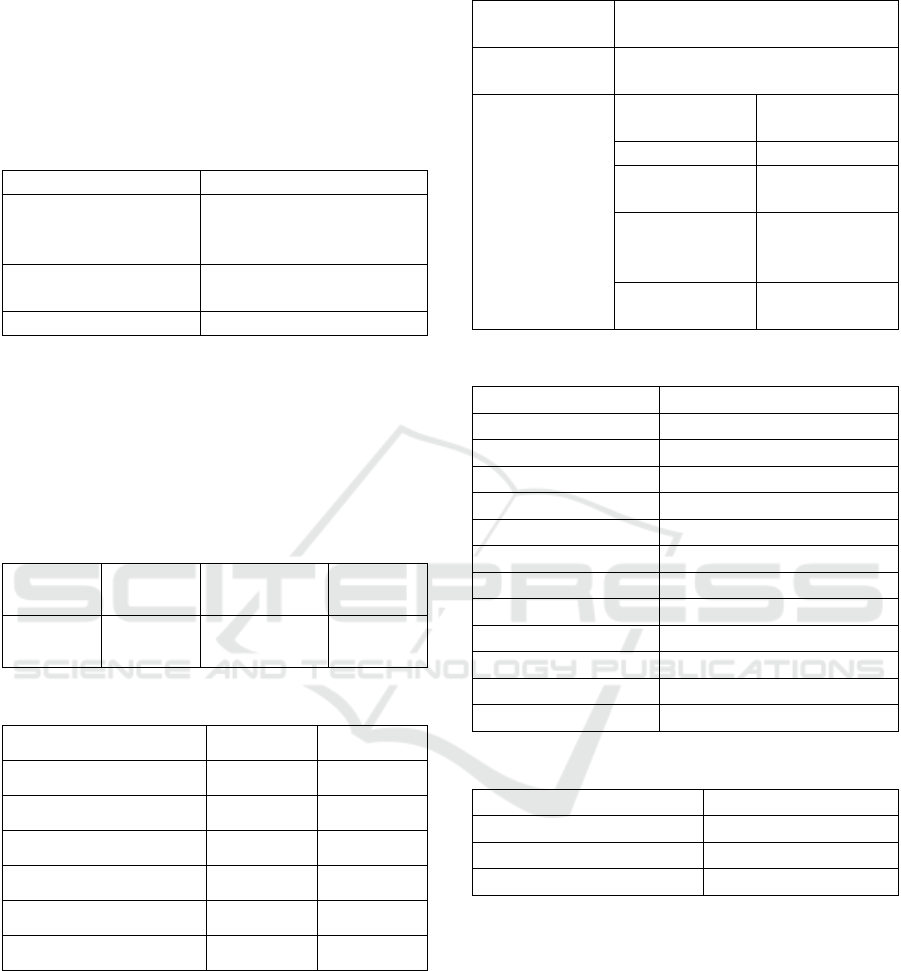
6 MESHING
Meshing is an important stage in CFD, this is because
meshing divides the components to be analyzed into
smaller elements. In general, the cell shape of
meshing is divided into 4 shapes for 3D geometry,
namely tetrahedron, pyramid, triangular prism, and
hexahedron.
Table 2: Comparison of the number of cells for each
variation.
Pipe Type
Number of
cell
Element
quality
Plan pipe 464662 0.45123
3-undulation pipe 540129 0.39183
5-undulation pipa 539532 0.52148
Meshing on the elbow will use a hexahedron cell
shape. This is because it shows that the use of the
hexahedron shape has a good mesh size value
(a)
(b)
Figure 3: Pipe section scheme mesh.
(a)
(c)
(
a
)
(c)
(b)
(b)
Numerical Study the Effect of Undulation to Mitigate Erosion Elbow
341
7 BOUNDARY CONDITION
The boundary condition is the boundary condition of
the mathematical equation and analysis is used.
Boundary conditions are used as parameters to be
executed by FLUENT.
Table 3: Boundary condition.
Boundar
y
condition Set up
Inlet
Velocity inlet
DPM, discreate phase
BC t
y
pe : escape
Wall
Solid material :
aluminiu
m
Outle
t
Pressure outle
t
8 MATERIAL PROPERTIES
There are two properties used, as shown in Table 4
and Table 5. The study used air-fluid and sand
injection.
Table 4: Air-Fluid Properties.
Material
Velocity
(m/s)
Viscosity
(Kg/ms)
Density
(Kg/m
3
)
Air 80
1.8 × 10
1.125
Table 5: Sand Properties.
Properties Value Unit
Shape Factor 0.53 -
D
min
65 µm
D
max
360 µm
D
mean
177 µm
Spread diameter (n) 4.10 -
Density 2650 Kg/m
3
9 SET UP
Initial setup is an important stage in the simulation.
This is because the setup is a process in choosing the
right model for the case. In this study, the commercial
program ANSYS Workbench 19.1 was used with the
Fluid Flow (Fluent) package. FLUENT settings as
follows:
Table 6: Set Up Fluent.
Solver
Pressure-Based Steady State
Solve
r
Solution
Scheme
SIMPLE algorithm (Segregated)
Spatial
Discretization
Gradient
Least Squares
Cell Based
Pressure Second Orde
r
Momentum
Second Order
Upwin
d
Specific
Dissipation
rate
Second Order
Upwind
Reynold
Stresses
Second Order
Upwin
d
Table 7: Set Up Fluid Properties.
Fluid air
Thermal -
Multiphase -
Model Turbulent
Realizable k-𝜀
Near-wall treatment Scalable wall function
Fluid viscosity 1.8 E-05 [kg/ms]
Velocity inlet 80 [m/s]
Wall condition No slip, smooth wall
Gravity 9.81 [m/s
2
]
Particle flow rate 0.78 [m/s]
Temperature 25
o
[C]
Pressure 101325 [Pa]
Density 1.18 [kgm
-3
]
Table 8: Set Up Sand Properties.
Injection type surface
Erosion model Oka
Drag law Spherical
Distribution Diameter Uniform
10 RESULT AND DISCUSSION
10.1 Mesh Independence
Mesh independence is based on the erosion ratio
value in ANSYS Workbench 19.1. From all the mesh
variations, the best variation will be chosen by
considering the situation in the simulation. Mesh
independence in this study project uses 4 variations
of mesh, namely:
iCAST-ES 2021 - International Conference on Applied Science and Technology on Engineering Science
342
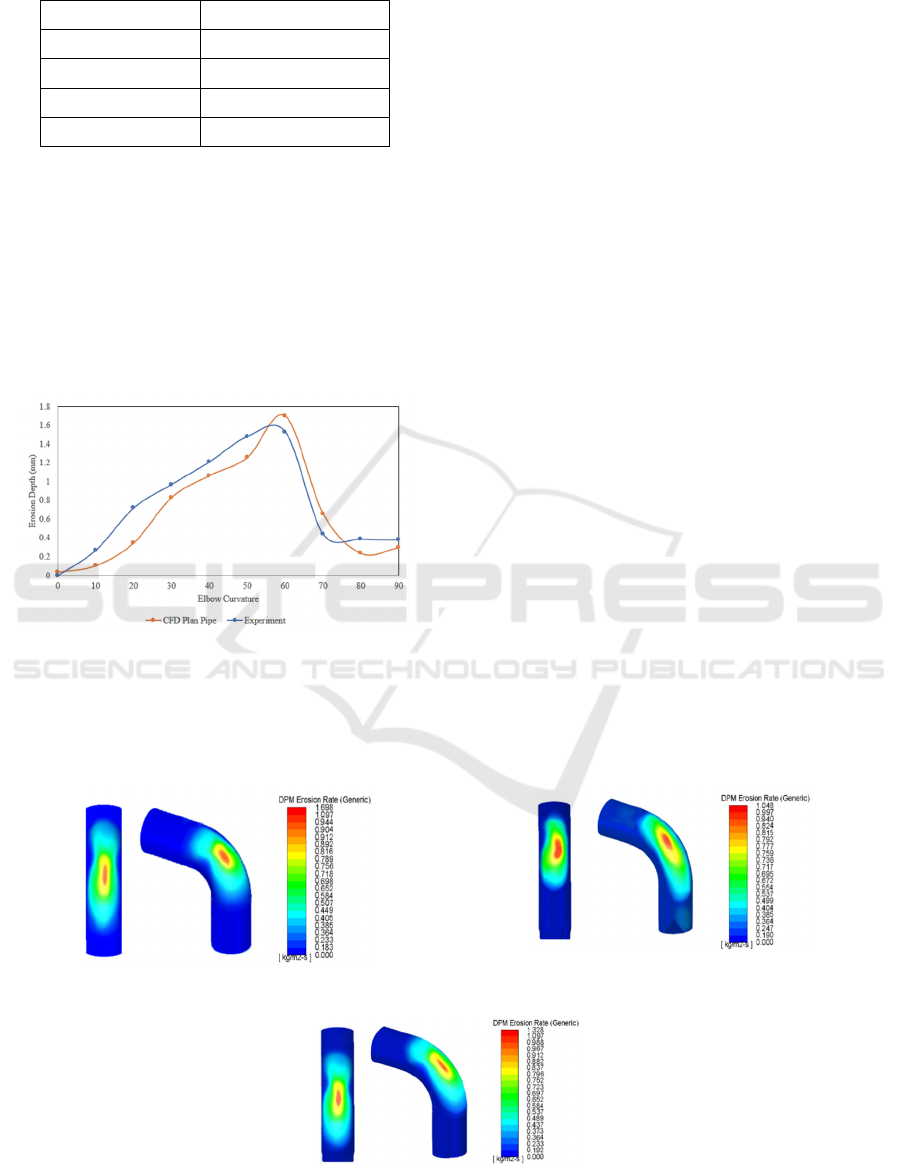
Table 9: Mesh independence.
Mesh Cell number
A 78459
B 464662
C 631611
D 785452
At a fluid velocity of 80 m/s, the highest erosion
rate results, namely meshing B, so that the next
approach will use meshing B, but by taking into
account geometric variations it is necessary to review
the quality of the meshing not only in terms of the
number of cells.
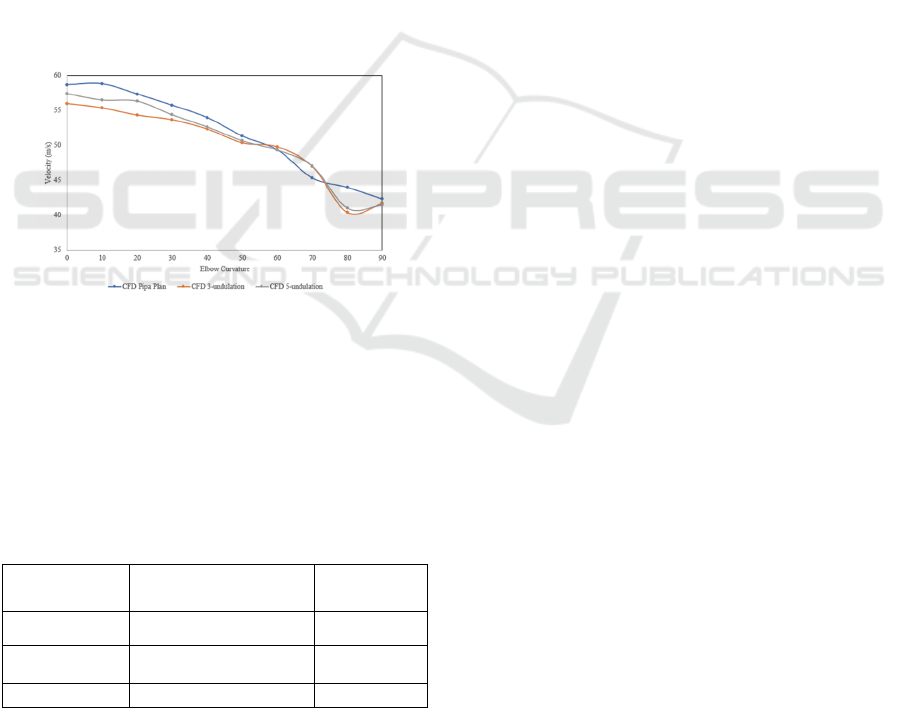
11 VALIDATION
Figure 4: Comparison graph of experimental data and CFD
data at a fluid velocity of 80 m/s.
Validation is an activity to prove the results obtained
through the same stages and processes as the
reference. Validation is done so that the results
obtained are close to the desired and research gets
maximum results in observation
In this study, validation was carried out by
comparing the graph of the erosion rate results
obtained with the erosion rate graph from the
reference journal (Wee and Yap 2019).
Because in the simulation there is no twisted pipe
configuration, the validation is done by comparing
the 90
o
elbow pipe with the reference. In this case, the
validation error reaches 7.36%, this is possible
because of the simulation situation that allows
loading too much data, as well as experimental data
that cannot be adjusted to conditions similar to ideal
conditions.
12 THE COMPARISON OF
VARIATION PIPE
In the observations, several things can affect the rate
of erosion. Among others:
• Particle impact velocity
• Particle impact angle
• Properties of particles
• The target material (in this final project,
stainless steel 316 is used)
Undulation is a circular shape on the elbow pipe
to get a very turbulent flow result. Naturally, the
particles will follow the results of the turbulent flow,
the particles will spread throughout the pipe wall.
With a pipe shape like this, the impact on the elbow
pipe will decrease in the same point concentration. In
the plan pipe the particles will focus more on the same
point because there are no obstacles before turning 90
(a) (b)
(
c
)
Figure 5: Contour DPM Erosion Rate (a) pipa plan, (b) 3-undulation pipe (c) 5-undulation pipe.
Numerical Study the Effect of Undulation to Mitigate Erosion Elbow
343
degrees. In this case, the things that affect the rate of
erosion are caused by the roughness of the walls and
the collisions between particles.
On the other hand, the variation pipe has a circular
shape and is designed to limit the movement of
particles. Compared to the plan pipe, the variation of
the pipe makes the elbows have a low risk of erosion.
This is because the wall is designed to have
undulation as a limited space for particle velocity.
particles with pipe walls. Experiments are the best
way to accurately determine the erosion rate problem
that occurs. However, to make it easier to do
numerical computational studies to understand the
erosion rate phenomenon that occurs in many
workpieces.
Figure 5 shows the erosion phenomenon and its
estimate in mm/year. Figure 5 (b) has the lowest
erosion value compared to other variations. This
result was obtained because the concentration of
particles that hit one point was reduced and scattered
at several other points. This is evidenced by the low
impact velocity value resulting in a low erosion rate.
Figure 6: Graph of Erosion Rate Against Elbow Curvative
at Centerline.
Figure 6 shows the graph of the erosion rate in
each variation having a graphic shape that is almost
the same as the planned pipe having the highest value.
In the plan pipe, all particles are focused on entering
the same tunnel so that they strike the same angle,
while for the 3-undulation pipe and 5-undulation pipe
variations, there is a special space to make the
particles turbulent and spread throughout the pipe.
This phenomenon causes the erosion rate value for 3-
undulation and 5-undulation pipes to be lower than
plan pipes. This result is almost similar to the study
conducted by Duarte (Duarte and de Souza 2017)
where the small amount of undulation results in a
lower erosion value.
There is a comparison of the experimental test
conducted by Christopher B. Solnordal (Solnordal,
Wong, and Boulanger 2015) with the CFD simulation
carried out. In Figure 4.3 it can be seen that the
experimental test value is higher than the CFD value
on the planned pipe. In this case, many things
happened in the experimental test which was not
ideal. When compared with computational
simulation, the experimental value can be influenced
by environmental conditions that can affect the
simulation value.
Figure 6 shows the results of erosion at the
centerline of the extrados pipe, in this case, it can be
seen that the 3-undulation pipe has the lowest erosion
peak value compared to the experimental, plan pipe,
and 5-undulation pipe. Extrados is the outer profile of
the pipe, while intrados is the inner profile of the pipe.
In Figure 5 both sides (extrados and intrados)
experience different erosion, on the intrados side the
pipe forms a region called separated region, where
separated region results in low velocity of the pipe.
This causes no erosion on the intrados side of the
pipe.
(a) (b)
Figure 7: (a) schematic of the x-y section of the pipe (b)
schematic of the profile of the x-z section of the pipe.
To get more accurate results, knowing the erosion
value on the pipe profile is carried out. It aims to
observe the distribution of erosion on 3-undulation
and 5-undulation pipes. The profile used is an x-y
cross-section with 9 points from extrados to intrados.
Figure 7 shows a schematic showing the inlet point at
0
o
and the outlet point at 90
o
, as well as the x-y and x-
z cross-sectional profiles on the pipe. This treatment
is to make it easier to analyze the erosion relationship
with the position on the pipe profile
Figure 8: Graph of representation of erosion rate on 3-
undulation profile.
iCAST-ES 2021 - International Conference on Applied Science and Technology on Engineering Science
344
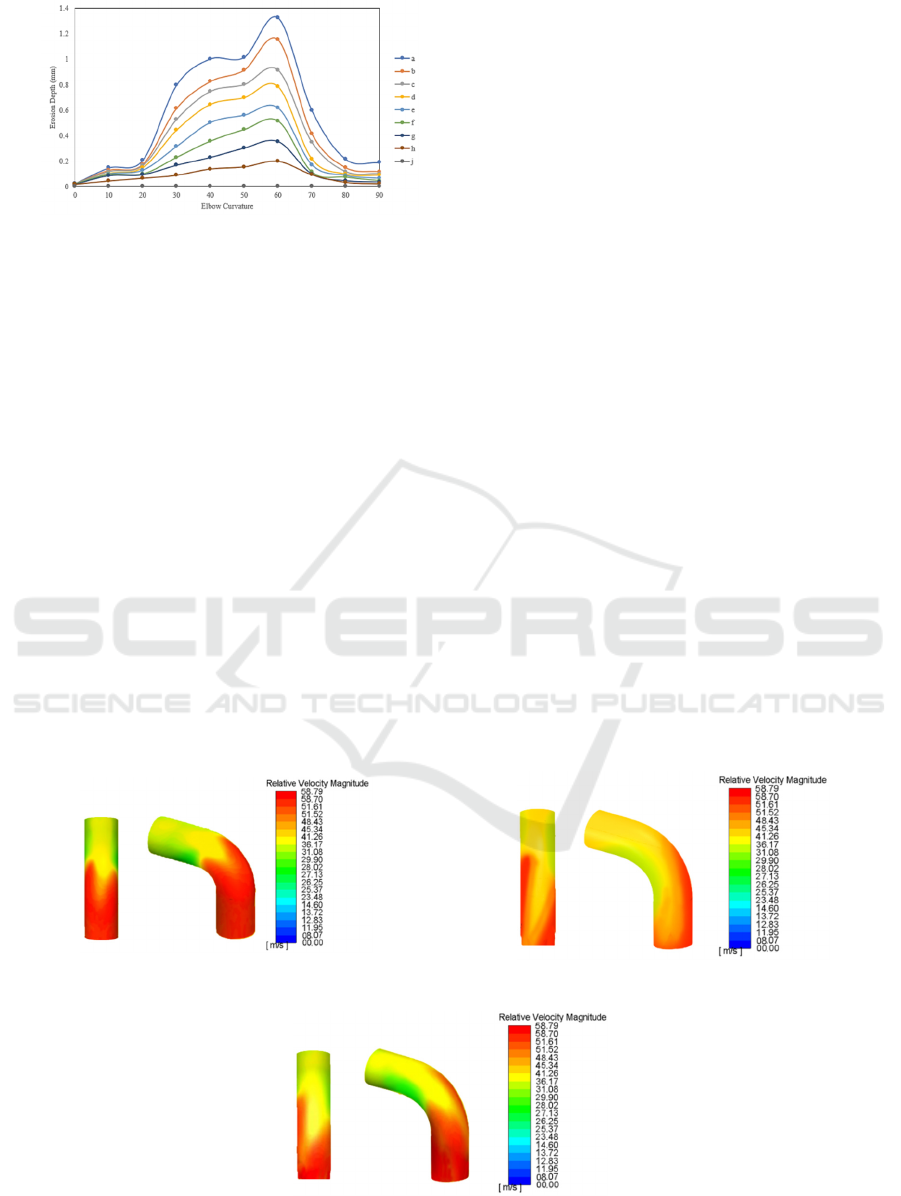
Figure 9: Graph of representation of erosion rate on 5-
undulation profile.
In Figures, 8 and 9 the highest erosion rate values
are at an angle of 60
o
. It was observed on the 3-
undulation pipe that the erosion difference in the a-b
profile was 0.038, the b-c profile was 0.051, the c-d
profile was 0.079. Meanwhile, in the 5-undulation
pipe, the erosion difference in the a-b profile is 0.169,
the b-c profile is 0.240, the c-d profile is 0.127.
From this case, it is explained that the decrease in
erosion value at the peak point of the 60
o
centerline
angle (profile A) of the pipe has an impact on
increasing erosion in the area around the centerline.
This proves that the decrease in erosion is caused by
the spread of sand particles, that the impact can be
evenly distributed on each pipe profile. This can be
observed directly by looking at the slope of Figures 8
and 9, wherein the 5-undulation pipe. The peak value
of erosion has a far difference compared to other
angles, and Figure 9 has a sharp indentation at an
angle of 60
o
. However, the impact produced by the
distributed particles does not make the erosion
profiles b, c and d in 3-undulation pipes have higher
yields than 5-undulation pipes. In terms of quantity,
the lowest erosion rate was experienced by the 3-
undulation pipe. Although the area around the center
line has almost the same erosion value, it does not
make the 3-undulation pipe value worse. It is proven
that table 4.1 on 3-pipe undulation pipe can reduce
erosion up to 38%.
The value of the erosion rate is not only caused by
different geometries, but the impact velocity also
affects. The provision of special space to make
changes to the flow in the pipe also has an impact on
the rate of erosion, with undulation, the flow in the
pipe will become very turbulent (turbulent) so that it
can slow down the velocity of particle impact on the
pipe elbow.
In Figure 6 it can be seen that the value of the
erosion rate has a significant difference at an angle of
30
o
– 60
o
. This is due to the fact that the impact
velocity value is also reduced at an angle of 30
o
– 60
o
.
High erosion values result in the possibility of pipe
leaks occurring.
The difference in the value of the erosion rate
caused by the impact velocity can also be seen from
the velocity contour in Figure 10. As previously
explained on the intrados side of the pipe, it forms a
region called a separated region. The separated region
has a low velocity so that the impact velocity becomes
weaker. At certain angles on the pipe extrados, the
erosion value becomes very high, such as an angle of
60
o
. This causes erosion, the injection of particles
hitting the extrados area having more energy than
increasing velocity.
(a) (b)
(c)
Figure 10: Contour velocity on (a) plan pipe, (b) 3-undulation pipe, (c) 5-undulation pipe.
Numerical Study the Effect of Undulation to Mitigate Erosion Elbow
345
Erosion is not only influenced by moving particles
or collisions between particles, but the fluid that flows
along with the particles is a determining factor for
erosion. Therefore, the velocity of the elbow pipe can
also be analyzed to determine the cause of erosion.
In the results of the velocity contour in Figure 10,
it can be seen that the velocity contour on the pipe
plan in Figure 5 (a), has the highest value.
Meanwhile, 3-undulation and 5-undulation pipes
have lower speeds. The impact of this phenomenon is
to reduce the rate of erosion (figure 5). The velocity
contour shows that the velocity value decreases from
the extrados to the intrados, this is caused by a
separate area on the pipe, this area is called a
separated region. A separated region is an area where
the lowest velocity value is on the inside of the pipe.
The 5-undulation form has a value that is almost
similar to the planned pipe, this can be due to the more
the number of undulations the pipe wall shape will be
closer to a circle or plan pipe compared to the 3-
undulation form.
Figure 11: Graph of representation of erosion rate on 5-
undulation profile.
The 5-undulation form has a value that is almost
similar to the plan pipe, this can be due to the more
the number of undulations the pipe wall shape will be
closer to a circle or plan pipe compared to the 3-
undulation form.
Table 10: Comparison of % erosion reduction in pipes with
variations.
Variation erosion value in 60
o
% erosion
reduction
pipa plan 1.69875 -
3-undulation 1.04865 38.26
5-undulation 1.32466 22.02
Table 10 shows the results that the % erosion
reduction value produced by 3-undulation pipes is
higher than 5-undulation pipes. In the 3-undulation
pipe, erosion can be reduced to reach 38.26%, while
in the 5-undulation pipe the erosion can be reduced to
22.02% of the planned pipe. This shows that the pipe
design with 3-undulation can be considered in the
future as a tool to reduce the rate of erosion.
13 CONCLUSION
This research is a study of sand erosion on the elbow
pipe. Gas flow is used to determine the rate of erosion
at 90
o
pipe bends. Making 3-undulation and 5-
undulation designs is an effort to reduce the erosion
phenomenon in pipe bends. In this study, the
following results were obtained:
• Changes in flow greatly affect the rate of
erosion because they can affect the interaction
of particles with the wall and the velocity of
impact. The highest erosion value remains on
the plan pipe and the lowest erosion value on
the 3-undulation pipe.
• 3-undulation pipe reduces erosion by 38.26%
while 5-undulation reduces erosion by 22.02%
ACKNOWLEDGEMENT
The authors acknowledge to PENS (Politeknik
Elektronika Negeri Surabaya) for support this
research.
REFERENCES
Anderson, Jd. 1995. “Computational Fluid Dynamics: The
Basics with Applications. 1995.” McGrawhill Inc.
https://doi.org/10.1017/CBO9780511780066.
Diana, L., A. G. Safitra, D. Ichsani, and S. Nugroho. 2020.
“CFD Analysis of Airflow Through Prism Obstacles
Inside Solar Air Heater Channel.” Journal of Physics:
Conference Series 1577 (1). https://doi.org/10.1088/
1742-6596/1577/1/012038.
Duarte, Carlos Antonio Ribeiro, and Francisco José de
Souza. 2017. “Innovative Pipe Wall Design to Mitigate
Elbow Erosion: A CFD Analysis.” Wear.
https://doi.org/10.1016/j.wear.2017.03.015.
Oka, Y. I., K. Okamura, and T. Yoshida. 2005. “Practical
Estimation of Erosion Damage Caused by Solid Particle
Impact: Part 1: Effects of Impact Parameters on a
Predictive Equation.” In Wear. https://doi.org/10.1016/
j.wear.2005.01.039.
Solnordal, Christopher B., Chong Y. Wong, and Joan
Boulanger. 2015. “An Experimental and Numerical
Analysis of Erosion Caused by Sand Pneumatically
Conveyed through a Standard Pipe Elbow.” Wear 336–
337: 43–57. https://doi.org/10.1016/j.wear.2015.04.017.
iCAST-ES 2021 - International Conference on Applied Science and Technology on Engineering Science
346

Strømme, Erik Grimm. 2015. “Simulation and Evaluation
of Slurry Erosion.” 83.
Wee, Siaw Khur, and Yung Jian Yap. 2019. “CFD Study of
Sand Erosion in Pipeline.” Journal of Petroleum
Science and Engineering. https://doi.org/10.1016/
j.petrol.2019.01.001.
Yudhatama, Ido Widya, Mas Irfan Purbawanto, and Wikan
Jatimurti. 2018. “Computational Fluid Dynamics
(CFD) Simulation of Sand Particle Erosion in Turbulent
Gas Fluid Flow in Vertical-Horizontal Elbow.” Jurnal
Teknik ITS. https://doi.org/10.12962/j23373539.v7i2.3
0445.
Numerical Study the Effect of Undulation to Mitigate Erosion Elbow
347
