
Improvement of Traffic Performance at Intersections on Cak Doko
Street, Kupang City, Indonesia
Mateus R. Sodanango, Amy Wadu, Obed Nenobais and Johan Lada
Department of Civil Engineering, Kupang State Polytechnic, Adi Sucipto Street, Kupang, Indonesia
Keywords: Intersection, Traffic, Volume, V/C Ratio.
Abstract: The increase in the vehicle population along with the lack of infrastructure capacity will cause social problems.
Cak Doko Street is located in a commercial area in the busy city center of Kupang. At unsigned intersections,
various turning movements will form many conflict points which will result in decreased traffic performance
at this point. The purpose of this study is to measure traffic performance at the intersection on Cak Doko
Street, especially at the meeting with the Nangka and Pemuda roads in the existing conditions and conditions
for the next 10 years and provide long-term handling directions to improve traffic performance at the
intersection without adding road infrastructure. The results show that the traffic conditions in the next 10
years will result in the v/c ratio for both intersections passing 1, after traffic regulation the v/c ratio will
decrease below 0.9. It can be concluded that the traffic regulation proposed in this study has succeeded in
improving the performance of the intersection on Cak Doko Street.
1 INTRODUCTION
Urban transportation is the main lifeblood of the
urban economy. Meanwhile, rapid economic
development does require smooth traffic flow. Thus,
the organization of level crossings is very important
in traffic control (J. Zhang et al., 2015). Traffic flow
data at intersections is very important in the design of
intersection configurations, canalization, and signal
control. Therefore, it is necessary to forecast current
and future traffic flows from the intersection
approach (Q. Fang et al., 2011).
At present, urban arterial road traffic is
increasingly congested, which eventually causes
social problems. At present, road conditions cannot
be fundamentally adjusted or engineered in the short
term, and traffic management tools such as junction
traffic canalization and traffic signal control
technologies are basically universally applied. Thus,
how to fully utilize and optimize limited road
resources and allocate traffic control resources, how
to better meet and serve road user demands, improve
arterial road traffic efficiency, and reduce traffic
congestion have become the subject of urgent
research (L. L. Dai et al., 2013).
The city of Kupang itself is the capital of the
province of East Nusa Tenggara (NTT) which is the
busiest city in the province of NTT. Based on data from
the Central Agency of Statistics for the City of Kupang
within the City of Kupang in 2020 figures, the number
of motorized vehicles in the City of Kupang continues
to increase every year, with a percentage increase of
7.09% per year. This means that this will result in an
increase in traffic movement which will burden the
existing road network. The growth of motorized
vehicles will have serious implications for road
infrastructure, road safety, urban parking, traffic
management (F. I. Ukonze et al., 2020).
The cak doko road section is located in a
commercial area in the very dense city center of
Kupang, there are shop houses lined up and there is
also a Subasuka Factory Outlet shopping center.
Traffic flow on this section is often jammed,
especially in the late afternoon. at unsigned
intersections, various turns form multiple points of
conflict. The number of conflict points increases
dramatically as the number of paths increases (P.
Ouyang et al., 2018). The most congested points on
the Cak Doko road are at 2 unsignalized intersections,
namely at the confluence of the Cak Doko road with
the Nangka road and the Pemuda road. These two T-
junctions are close so that there are often conflicts
over traffic movements here. No one relents and the
squabbling between road users further adds to the
congestion on this segment. If not taken seriously,
Sodanango, M., Wadu, A., Nenobais, O. and Lada, J.
Improvement of Traffic Performance at Intersections on Cak Doko Street, Kupang City, Indonesia.
DOI: 10.5220/0010944800003260
In Proceedings of the 4th International Conference on Applied Science and Technology on Engineering Science (iCAST-ES 2021), pages 321-328
ISBN: 978-989-758-615-6; ISSN: 2975-8246
Copyright
c
2023 by SCITEPRESS – Science and Technology Publications, Lda. Under CC license (CC BY-NC-ND 4.0)
321

this congestion problem will have an impact on
various sectors, such as the economic sector, namely
the increasing transportation costs, quality-of-life:
namely the deterioration of the quality of life in a
community due to the increased emotional level due
to travel (Y. Yao et al., 2020).
Given that this location is already crowded and
there is no more empty space to increase the width of
the road or intersection, the purpose of this study is to
determine the appropriate handling steps in the form
of controlling traffic flow by optimizing the use of
existing infrastructure to improve traffic flow
performance at the location. This is in order to
provide convenience to traffic efficiently in the use of
road space and to expedite the movement system
without changing the geometry of intersections and
segments (A. Wadu et al., 2019). These
countermeasures will be carried out with traffic
engineering simulations based on the 2014
Indonesian road capacity guidelines (PKJI, 2014).
2 RESEARCH METHODS
The research stages start from literature study, data
collection, data analysis, until the results are in the
form of conclusions and recommendations for
handling. It was started with a literature study which
then identified problems that caused traffic jams on
the Cak Doko street, especially at the intersection
with Nangka street and Pemuda street. This stage is
carried out to find out the real root problems that
occur in the study area. At this stage, the
concentration points of the study area and the scope
of the problems to be discussed are also carried out.
The analysis stage is a follow-up after data processing
is completed. The purpose of this stage is to
understand and analyze the processing results in
depth. The analysis is carried out by taking into
account the traffic performance at the two intersections
starting from capacity, delays and queuing
opportunities that occur with considerations based on
the 2014 Indonesian Road Capacity Guidelines (PKJI
2014). Then a projection of the condition of the next 10
years is carried out using data on the growth rate of
motorized vehicles in Kupang City to anticipate the
possibilities that occur in depth in the future so that the
handling of congestion problems can be carried out
efficiently for the long term.
2.1 Road Geometric
The collection of road geometric data using the
manual method is carried out directly at the survey
location by measuring the width of the road, the width
of the sidewalk, and the parking layout, as well as
other data about the roads related to this research by
using a meter.
2.2 Traffic
The survey conducted in this study is a classified
volume survey using the manual traffic counts
method. The survey is carried out by placing the
surveyor at a fixed point on the side of the road, so
that it can clearly observe passing vehicles at the
specified point. Data recording is filled in on the
survey form according to the vehicle classification
that has been determined. The implementation period
starts from 06.00 to 18.00 for 7 days.
2.3 Level of Service
Road service level analysis was conducted based on
the PKJI 2014 Indonesian road capacity guidelines.
The level of road service to passing traffic is usually
measured by the v/c ratio or commonly referred to as
the degree of saturation. The degree of saturation (Ds)
is the ratio between the traffic volume (V) and the
road capacity (C), the magnitude of which is
theoretically between 0 - 1, which means that if the
value is close to 1 then the road condition is close to
saturation.
Q
Ds
C
=
Where
Ds = De
g
ree Of Saturation
Q = Traffic flow (pcu/hour)
C = Capacit
y
(pcu/hour)
3 RESULTS AND DISCUSSION
3.1 Intersection Profile Existing
Condition
The intersection of Cak Doko Street – Pemuda Street
and Cak Doko Street –Nangka Street are types of 3-
arm unsignalized intersection that is passed by
vehicles from Cak Doko Street, Pemuda Street, and
Nangka Street. The three roads are successively
identified as approaches A1, B1 and A2 as shown in
Figure 1. The characteristics of each of these
approaches can be seen in PKJI 2014. Based on this
classification, the closest type of intersection is
determined for the intersection of Cak Doko Street –
iCAST-ES 2021 - International Conference on Applied Science and Technology on Engineering Science
322
Pemuda Street and Cak Doko Street –Nangka Street,
namely intersection 322 which means 3-arm
intersection with 2 lanes of minor roads and 2 lanes
of major roads
Figure 1: Overview of the intersection location.
The location of this intersection is in a commercial
environment, which is an environment that surrounds
many shops, shopping centers, banks, workshops.
And not far from the intersection there are several
schools. Pemuda Street also connects Cak Doko
Street and Kuanino Market, while Nangka Street
connects Cak Doko and Bhayangkara Hospital and
Oeba Market. Furthermore, in this discussion, the
Cak Doko Street and Nangka Street will be called the
intersection A, while the Cak Doko Street and
Pemuda Street intersections will be called the
intersection B.
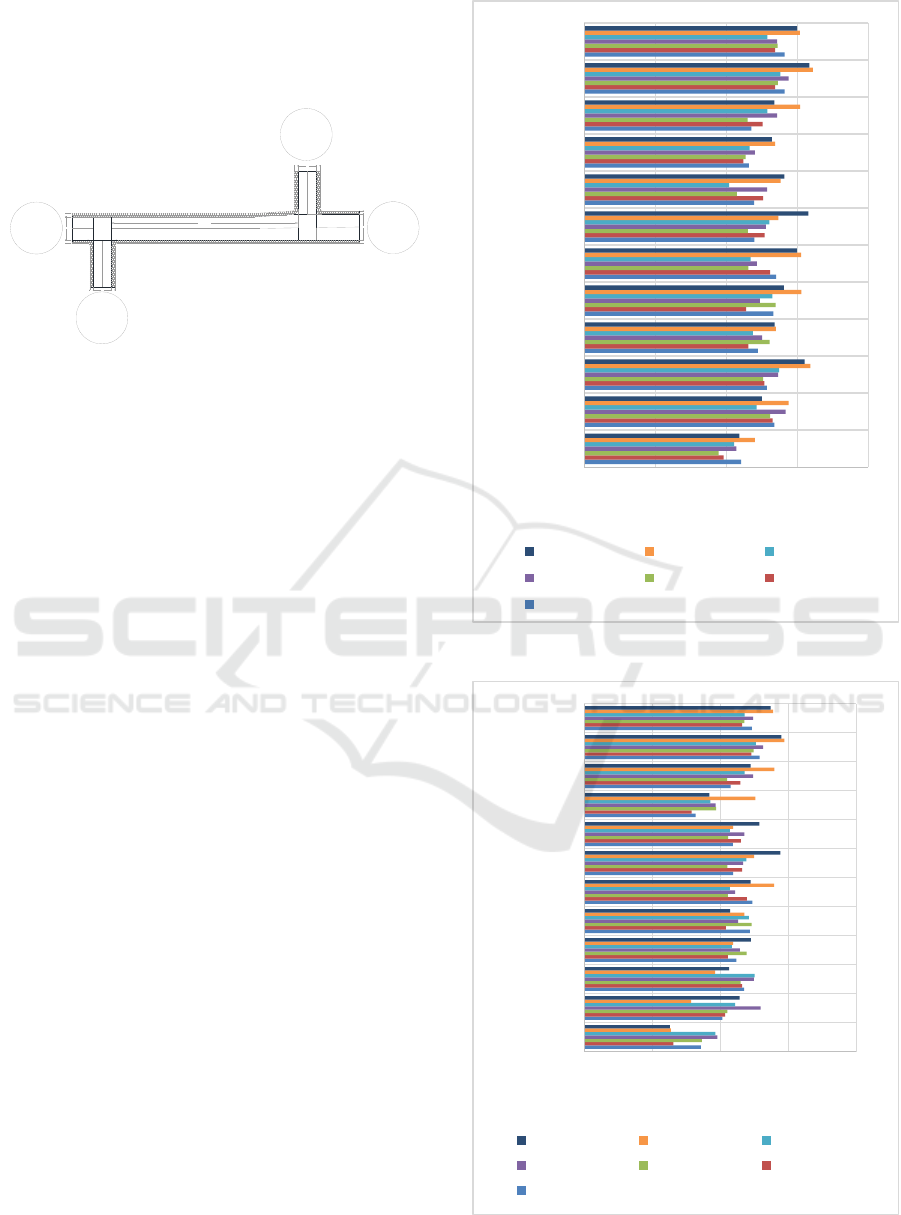
3.2 Existing Traffic Flow
Traffic counting passing through the intersection of
Cak Doko Street – Pemuda Street and Cak Doko
Street – Nangka Street was observed for 1 week of
observation. The results obtained for the calculation
of traffic volume are shown in Figure 2. Peak hours
occur on Saturdays between 17:00 – 18:00 with a
traffic volume of 1471 pcu/hour at the Cak Doko
Street - Pemuda Street intersection and 1610 pcu/hour
at the intersection. the intersection of Cak Doko Street
– Nangka Street.
From the peak hour data obtained from Figure 2
and Figure 3, then an analysis of the capacity of
intersection A and intersection B is carried out to
obtain traffic performance at both intersections, both
from the degree of saturation, intersection delays and
opportunities for queues. The geometric data for
intersection A is shown in figure 4 with the traffic
composition shown in table 1, while the geometric
data for intersection B is shown in figure 5 with the
traffic composition shown in table 2.
Figure 2: Traffic Flow in Intersection A.
Figure 3: Traffic Flow in Intersection B.
65 m
B2
1.2
1.2
8.0
1.2 1.2
A2
Cak Doko Street
6.2
A1
1.2 1.2
9.0
1.2
1.2
6.4
B1
0 500 1000 1500 2000
6-7
7-8
8-9
9-10
10-11
11-12
12-13
13-14
14-15
16-17
17-18
18-19
Traffic Flow (pcu/hour)
Hours
Sunday Saturday Friday
Thursday Wednesday Tuesday
Monday
0 500 1000 1500 2000
6-7
7-8
8-9
9-10
10-11
11-12
12-13
13-14
14-15
16-17
17-18
18-19
Traffic Flow (pcu/hour)
Hours
Sunday Saturday Friday
Thursday Wednesday Tuesday
Monday
Improvement of Traffic Performance at Intersections on Cak Doko Street, Kupang City, Indonesia
323
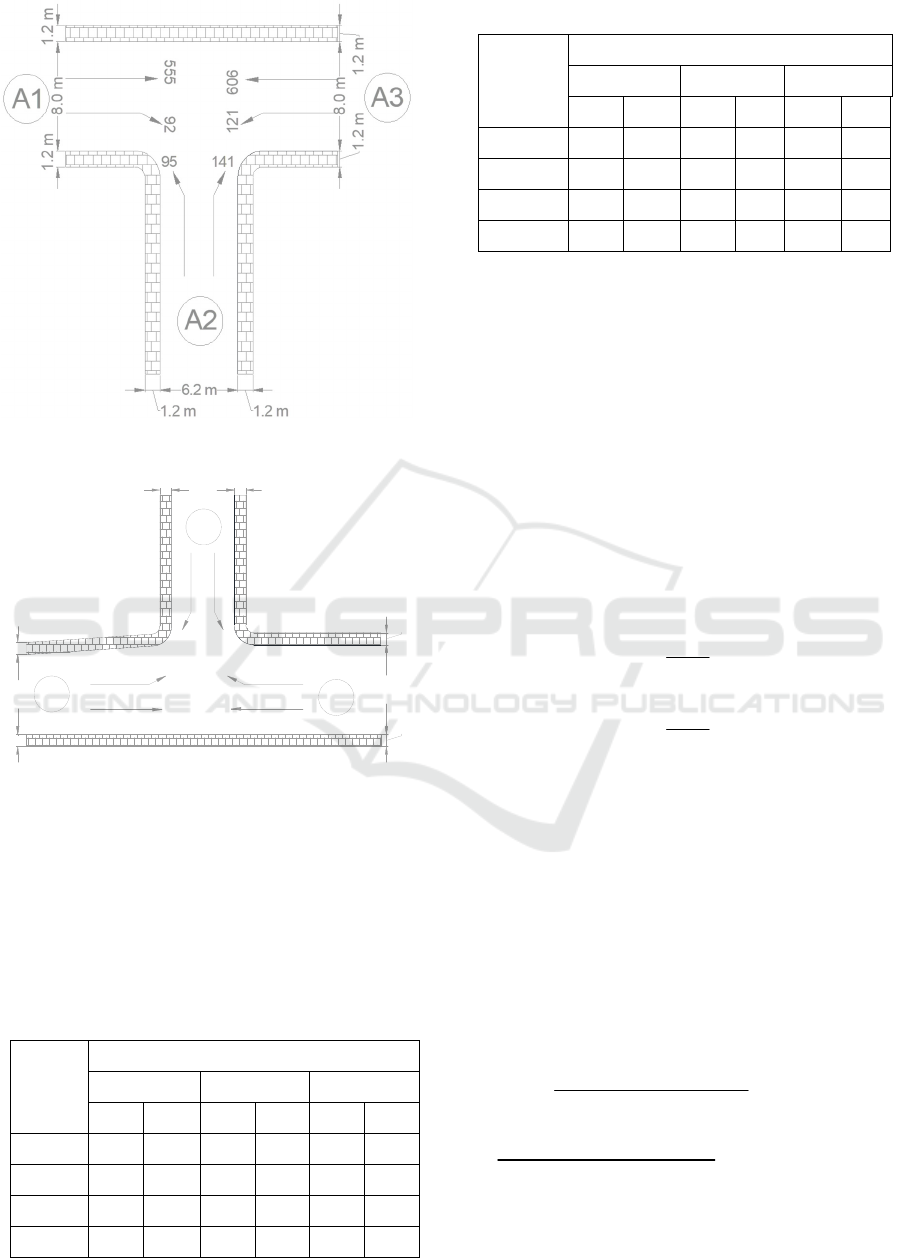
Figure 4: Geometric of Intersection A.
Figure 5: Geometric of Intersection B.
The traffic flow data in figure 4 is in Passenger car
equivalent (pcu) units, while the traffic flow data in
table 1 is in vehicles/hour units for each type of
vehicle with Motorcycle (MC), Light Vehicle (LV),
Heavy vehicle (HV) , and Uninsured motorist (UM)
and for the direction of each vehicle is Left Turn (LT),
Right Turn (RT), straight through (ST).
Table 1: Traffic flow at the peak of Intersection A.
Vehicle
Type
Approach
A1 A2 A3
RT ST RT LT LT ST
MC 206 1097 292 180 309 969
LV 47 325 77 55 56 365
HV 2 6 3 2 2 26
UM 0 1 0 0 0 4
Table 2: Traffic flow at the peak of Intersection B.
Vehicle
Type
Approach
B3 B1 B2
LT ST LT RT ST RT
MC 171 1179 110 315 1047 125
LV 26 370 19 69 330 19
HV 2 6 0 4 25 0
UM 0 2 0 0 1 0
Table 1 and Table 2 show that the type of
motorcycle vehicle is the most common type of
vehicle crossing intersection A and intersection B.
While the type of heavy vehicle is the least crossing
intersection A and intersection B. As for the
Uninsured motorist, it is very little even at several
legs Uninsured motorist found.
3.3 Existing Traffic Performance
The ratio between peak traffic flow (q) for one hour
to capacity (C) which is determined based on the
surrounding environmental conditions and the
existing infrastructure at intersection A and
intersection B.
3
1610
()
2
0
670
0, 6
S
DA==
1471
( ) 0, 588
2500
S
DB==
The additional travel time used by the driver to
pass through Intersection A and Intersection B when
compared to the route without the Intersection. T
consists of Traffic Delay (TLL) and Geometric Delay
(TG). TLL is the waiting time caused by the
interaction of traffic with opposite traffic movements.
TG is the additional travel time caused by the
deceleration and acceleration of vehicles turning at
the intersection. Because the degree of saturation of
intersection A is more than 0.6 then the average
traffic delay for all motorized vehicles entering
Intersection A from all directions is
2
2
1, 0504
() (1 )
(0,2742 0,2042 )
1, 0504
(1 0, 603) 6, 79
(0,2742 0,2042 0,603)
LL J
J
TA D
D
=−−
−×
=−−=
−×
While the degree of saturation from intersection B
is less than 0.6 then the average traffic delay for all
1.2 m
9.0 m
1.2 m
1.2 m
1.2 m1.2 m
6.4 m
1.2 m
8.0 m
137
63
47
614
B1
44
B3
572
B2
iCAST-ES 2021 - International Conference on Applied Science and Technology on Engineering Science
324

motorized vehicles entering Intersection B from all
directions is
2
2
() 2 8,2078 (1 )
2 8, 2078 0, 588 (1 0, 588) 6, 66
LL J J
TB D D=+ × − −
=+ × −− =
The average traffic delay for all motorized
vehicles entering Simpang A from Cak Doko Street
is
1,8
1,8
1, 0503
() (1 )
(0,3460 2460 )
1, 0503
(1 0, 603) 4, 5
(0, 3460 2460 0, 603)
LLma J
J
TA D
D
=−−
−×
=−−=
−×
Meanwhile, the average traffic delay for all
motorized vehicles entering Simpang B from Cak
Doko Street is
1,8
1,8
( ) 1, 8000 5, 8234 (1 )
1, 8000 5, 8234 0,588 (1 0, 588) 5, 02
LLma J J
TB D D=+×−−
=+×−− =
The average traffic delay for all motorized
vehicles entering Simpang A from Nangka Street is
1610 6, 79 1374 4, 5
( ) 19, 92
235
TOT LL ma LLma
LLmi
mi
LLmi
qTqT
T
q
TA
×−×
=
×−×
==
The average traffic delay for all motorized
vehicles entering Simpang B from Pemuda Street is
1471 6, 66 1292 5, 02
() 18,52
178
TOT LL ma LLma
LLmi
mi
LLmi
qTqT
T
q
TB
×−×
=
×−×
==
So the waiting time caused by traffic interaction
with opposite traffic movements at Cak Doko Street
intersection A is 4.5 seconds/pcu and for intersection
B is 5.02 seconds/pcu. Meanwhile, the average traffic
delay for Nangka Street is 19.92 seconds/pcu and for
Pemuda Street is 18.52 seconds/pcu.
The mean geometrical delay of the entire
intersection
{}
( ) 2, 48
(1 0, 603) 6 0, 28 3 (1 0, 28) 4 0, 603
G
TA==
−××+×−+×
{}
() 3,83
(1 0, 588) 6 0,19 3 (1 0,19) 4 0, 588
G
TB=
−××+×−+×
So the additional travel time caused by the
deceleration and acceleration of vehicles turning at
intersection A and intersection B or what is called the
geometric delay is 2.48 seconds/pcu for intersection
A and 3.83 seconds/pcu for intersection B.
So, the total delay of intersection A and
intersection B is
( ) 6, 79 2, 48 9, 27
( ) 6, 66 3,83 10, 49
LL G
TT T
TA
TB
=+
=+=
=+=
The additional travel time used by the driver to go
through intersection A when compared to a track
without an intersection is 9.27 seconds/skr, while for
intersection B it is 10.49 seconds/pcu
The probability that a queue will occur at each
approach at intersection A is
23
47, 71 0, 603 24, 68 0, 603 56, 47 0, 603 15%
A
P =
×−× +× =
23
9, 02 0, 603 20, 66 0, 603 10, 49 0, 603 32%
A
P =
×+× +× =
While the probability of a queue at each approach
at intersection B is
23
47, 71 0, 588 24, 68 0, 588 56, 47 0, 588 15%
A
P
=
×−× +× =
23
9, 02 0, 588 20, 66 0, 588 10, 49 0, 588 31%
A
P =
×+× +× =
Based on the results of the analysis, the
probability of queuing vehicles at intersection A is
15-32% while at intersection B is 15-31%.
3.4 Traffic Conditions for the Next 10
Years
Traffic projections in the next 10 years in the city of
Kupang is based on the growth rate of motor vehicle
obtained from the Central Statistics Agency of
Kupang City (Badan Pusat Statistik Kota Kupang,
2018) City (Badan Pusat Statistik Kota Kupang,
2014) can be seen in Figure 6 and Table 3
Improvement of Traffic Performance at Intersections on Cak Doko Street, Kupang City, Indonesia
325
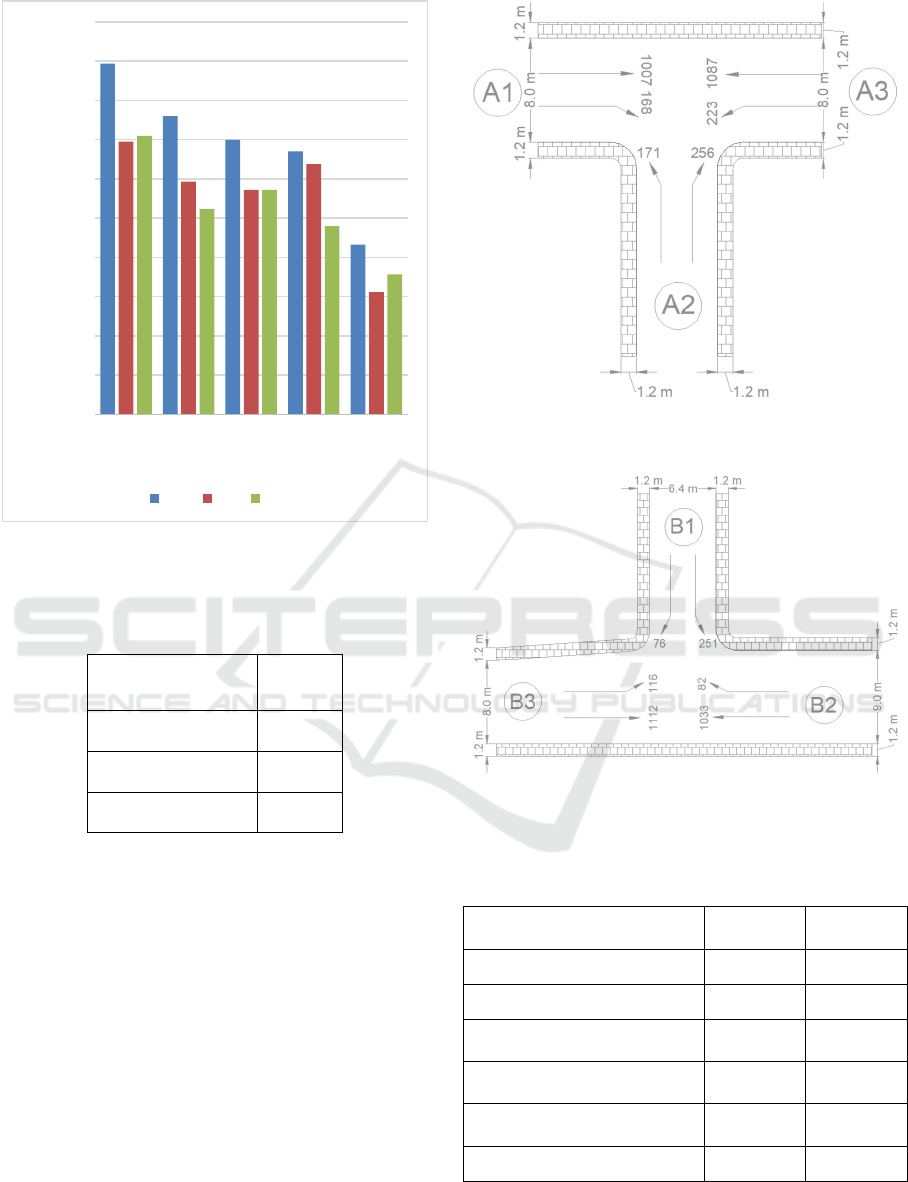
Figure 6: Growth in the Number of Vehicles in Kupang
City.
Table 3: Average Growth in the Number of Vehicles in
Kupang City.
Vehicle Type Average
Motorcycle (MC) 6.91%
Light Vehicle (LV) 5.62%
Heavy vehicle (HV) 5.28%
From Figure 6 it can be seen that the highest
growth of motorized vehicles occurred in 2016 in the
type of motorcycle vehicle with a growth rate of
8.93%, while the lowest growth rate occurred in 2020
in the type of light vehicle which was 3.11%. From
table 3, it is found that the average growth of each
type of vehicle over the last 5 years is 6.91% for
motorcycles, 5.62% for light vehicles, and 5.28% for
heavy vehicles. From the average growth rate for each
type of vehicle, this is then used to project traffic
conditions in the next 10 years.
Traffic flow in the next 10 years as shown in
Figure 7 and Figure 8 is then analyzed using PKJI
2014 to obtain traffic behavior and traffic
performance without handling or in other words no
improvements have been made, traffic management
is still as it is today as shown in table 4.
Figure 7: Traffic flow conditions in the next 10 years on
Intersection A.
Figure 8: Traffic flow conditions in the next 10 years on
Intersection B.
Table 4: Intersection Performance Conditions for the Next
10 Years.
Parameter
Intersecton
A
Intersecton
B
Total Traffic Flow, pcu/hour 2912 2669
Degree of saturation 1,090 1,068
Intersection traffic delay,
sec/
p
cu
20,34 18,71
Intersection geometric delay,
sec/pcu
4,00 4,00
Total Intersection delay,
sec/pcu
24,34 22,71
Queue Opportunity, % 48 - 96
46 - 82
It can be seen from table 4 that there will be a
decline in the performance of the intersection in the
0%
1%
2%
3%
4%
5%
6%
7%
8%
9%
10%
2016 2017 2018 2019 2020
Growth
Years
MC LV HV
iCAST-ES 2021 - International Conference on Applied Science and Technology on Engineering Science
326
next 10 years, with increasing traffic flow, in year 0
the traffic flow only reached 1610 pcu/hour at
intersection A, increasing to 2912 pcu/hour, while at
intersection B the traffic flow traffic in year 0 was
1471 increasing to 2669 pcu/hour. As a result of the
increase in traffic flow then the impact on the degree
of saturation which in the 10th year at intersections A
and B only reached 0.603 and 0.588 increased to
1.090 and 1.068, respectively. This increase in v/c
ratio also has an impact on the total delay of
intersections A and B, which initially only reached
9.27 sec/pcu in year 0 and 10.49 sec/pcu, in the 10th
year it increased to 22.71 sec/pcu. pcu and 24.34
sec/pcu with queuing probability for intersection A is
48%-96% and for intersection B is 46%-92%.
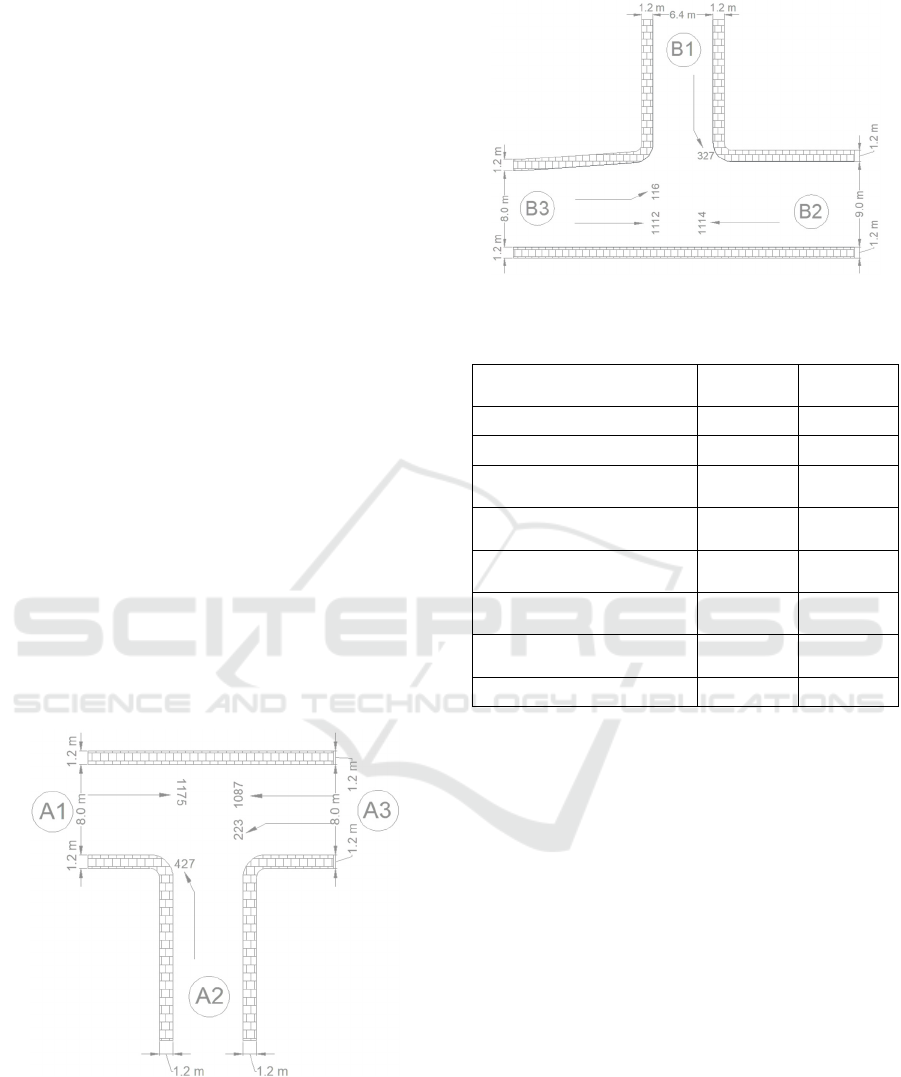
3.5 Intersection Performance
Improvement
One of the ways to improve intersection performance
with traffic management is to regulate the movement
of traffic flow by prohibiting each leg of the
intersection to turn right (E. S. Prassas et al., 2020) (S.
R. Srinivasula et al., 2020). This is the most
economical step without adding infrastructure or
overhauling existing infrastructure (J. Goyani, P, et
al., 2019). The analysis is carried out using traffic
conditions in the next 10 years with infrastructure
conditions that are still the same as in year 0 with the
arrangement of traffic movements not turning right as
shown in Figure 9 and Figure 10.
Figure 9: Arrangement of intersection A traffic movement.
Seen in Figure 9 and Figure 10, the traffic flow at
intersection A and intersection B if a right turn
prohibition is applied, so there is no conflict at the
intersection. Traffic flow on this movement is then
analyzed based on the PKJI 2014.
Figure 10: Arrangement of intersection B traffic movement.
Table 5: Traffic Performance After Traffic Arrangements.
Parameter
Intersection
A
Intersection
B
Total Traffic Flow, pcu/hou
r
2912 2669
Degree of saturation 0.843 0.825
Intersection traffic delay,
sec/
p
cu
10.27 9.90
Major Road Traffic Delay,
sec/pcu
6.1 6.56
Minor Road Traffic Delay,
sec/
p
cu
34.76 33.87
Intersection geometric delay,
sec/
p
cu
1.10 3.91
Total Intersection delay,
sec/pcu
11.37 13.81
Queue Opportunity, % 29 - 57 27 - 54
It can be seen in table 5, that there was an increase
in traffic performance at both intersections due to the
regulation of traffic movement at the intersection.
The traffic flow in the 10th year at intersection A and
intersection B, namely 2912 pcu/hour and 2669
pcu/hour turned out to produce a degree of saturation
of 0.843 and 0.825, which decreased the v/c ratio
from before treatment was 1.090 and 1.068.
Meanwhile, the total delay at the intersection after
adjusting the traffic movement resulted in a delay of
11.37 sec/pcu for intersection A and 13.81 sec/pcu for
intersection B, this decreased from the previous
which reached 24.34 sec/pcu for intersection A and
22.71 sec/pcu for intersection B. Chances of queues
are also decreasing due to traffic movement
regulation, which only reached 29%-57% for
intersection A and 27%-54% for intersection B, this
is better than before the regulation namely reaching
48%-96% for intersection A and 46%-82% for
intersection B.
Based on the results of the analysis in table 5, the
performance of intersection A and intersection B is
still sufficient for the next 10 years, with no need for
Improvement of Traffic Performance at Intersections on Cak Doko Street, Kupang City, Indonesia
327

additional infrastructure, it is only enough to
rearrange traffic movements at both intersections by
prohibiting vehicles to turn right at both intersections.
4 CONCLUSIONS
Based on the results and discussion, The analysis of
the condition of intersection A and intersection B in
10 years will cause traffic jams, the capacity of the
intersection will not be able to accommodate traffic
flows that have exceeded capacity, this can be seen
from the v/c ratio of intersection A which reaches
1.090 and intersection B reaches 1.068. Traffic
regulation in the form of a right turn prohibition for
each leg of the intersection will improve the
performance of the intersection, this can be seen from
the capacity of the intersection that will be able to
accommodate traffic flow with a v/c ratio for
intersection A 0.843 and intersection B 0.825.
ACKNOWLEDGEMENTS
A very high appreciation is conveyed to the Kupang
State Polytechnic which has supported this research
in the form of research funds originating from the
2021 PNK DIPA.
REFERENCES
J. Zhang, Y. Wang, and M. Xin, “Optimizing traffic
organization in urban intersections: A simulation study,”
2015, doi: 10.1061/9780784479384.209.
Q. Fang, S. Wu, and Z. Yang, “Estimation of traffic flows
at intersections based on traffic assignment and neural
network model,” 2011, doi: 10.1061/41186(421)102.
L. L. Dai, Y. Li, Y. X. Wang, and D. B. Liu, “Application
of collaborative optimization strategies for traffic
control of urban arterial intersection,” 2013, doi:
10.1061/9780784413036.139.
F. I. Ukonze, M. U. Nwachukwu, D. C. Okeke, and U.
Jiburum, “Analysis of vehicle ownership growth in
Nigeria: Policy implications,” Case Stud. Transp.
Policy, vol. 8, no. 3, 2020, doi:
10.1016/j.cstp.2020.05.018.
P. Ouyang, P. Liu, J. Wu, and H. Yu, “Irregular merging
behavior investigation of left-turning vehicles at un-
signalized T-intersections,” in CICTP 2017:
Transportation Reform and Change - Equity,
Inclusiveness, Sharing, and Innovation - Proceedings of
the 17th COTA International Conference of
Transportation Professionals, 2018, vol. 2018-January,
doi: 10.1061/9780784480915.469.
Y. Yao et al., “Analyzing the Effects of Rainfall on Urban
Traffic-Congestion Bottlenecks,” IEEE J. Sel. Top.
Appl. Earth Obs. Remote Sens., vol. 13, pp. 504–512,
2020, doi: 10.1109/JSTARS.2020.2966591.
A. Wadu, R. Kusumawardhani, and I. Suherminingsih,
“Manajemen Lalu Lintas Di Jalan Lingkar Kampus
Universitas Brawijaya,” JUTEKS - J. Tek. Sipil, vol. 3,
no. 2, 2019, doi: 10.32511/juteks.v3i2.277.
PKJI, “Pedoman Kapasitas Jalan Indonesia,” Pandu.
Kapasitas Jalan Indones., 2014.
Badan Pusat Statistik Kota Kupang, “Kota Kupang Dalam
Angka,” Badan Pus. Stat. Kota Kupang, vol. 39, no. 5,
2018.
Badan Pusat Statistik Kota Kupang, Kota Kupang Dalam
Angka 2014. 2014.
E. S. Prassas and R. P. Roess, “Unsignalized Intersections:
All-Way STOP Control (AWSC),” in Springer Tracts
on Transportation and Traffic, vol. 12, 2020.
S. R. Srinivasula, A. Chepuri, S. S. Arkatkar, and G. Joshi,
“Developing proximal safety indicators for assessment
of un-signalized intersection–a case study in Surat city,”
Transp. Lett., vol. 12, no. 5, 2020, doi:
10.1080/19427867.2019.1589162.
J. Goyani, P. Nishant, G. Ninad, M. Jain, and S. Arkatkar,
“Investigation of traffic conflicts at unsignalized
intersection for reckoning crash probability under
mixed traffic conditions,” J. East. Asia Soc. Transp.
Stud., vol. 13, 2019, doi: 10.11175/easts.13.2091.
iCAST-ES 2021 - International Conference on Applied Science and Technology on Engineering Science
328
